Market Minds Advisory
Weigh-In-Motion System Market

Weigh-In-Motion System Market: Weigh-In-Motion System Market: Direct Enforcement, Pavement Economics and Sensor Accuracy

Legal metrology approval turned a screening tool into an automatic penalty system, pavement damage economics make the business case without any enforcement revenue, and sensor accuracy still depends on the road it sits in.

Lead Analyst

David Horsley

Published

August 2026

Make Smarter Decisions with Customized Research Insights

Request a free sample report and evaluate market opportunities, growth trends, and competitive dynamics relevant to your business needs.

2025 MARKET VALUE$0.9BMarket Size 2025
2036 FORECAST VALUE$2.3BBase Case , 2026 to 2036
CAGR 2026 TO 20368.8 %Bull 10.0% / Bear 7.6%
INCREMENTAL OPPORTUNITY$1.3BNet 10- year value creation
EXPANSION MULTIPLE2.32x2036 value over 2026 base
Strategic Levers
M&A Pipeline
Regional Outlook
Country Rankings
Competitive Intelligence
Segmental Deep-dive
Call-Us : 91 93563 13602

Executive Snapshot and Market Trajectory.

The economics behind this market rest on a piece of pavement engineering most people have never heard of. Road damage rises roughly with the fourth power of axle load, which means a truck 20% over the limit does about double the damage of a legal one.
Quartz piezoelectric strip sensor systems grow at 13.2%, a full 1.50 times the market rate, because they hold accuracy across temperature and traffic variation well enough to satisfy legal metrology approval. East Asia holds 32% of global value, above the standard band, because China ran the largest overload enforcement programme that any country anywhere has ever attempted, instrumenting its road networks at a scale nobody else has approached.
Concentration sits at 42% for the top five, and what separates the tiers is certification rather than manufacturing. Building a sensor that weighs a moving truck is entirely achievable. Building one whose measurement survives legal challenge when a haulier disputes an automatic penalty is considerably harder, and that distinction now decides who competes for the highest value deployments at all. Certification rather than engineering capability is the real barrier in this market.
Market Definition
This report covers weigh-in-motion systems measuring vehicle and axle weight at speed, spanning quartz and ceramic piezoelectric sensors, bending plates, load cells, fibre-optic and bridge-based systems, together with the roadside electronics, enforcement software and data platforms integrating them across highway, toll plaza, weigh station, bridge protection and freight corridor applications. Static weighbridges, onboard vehicle weighing, portable wheel load scales, general traffic counting equipment and pavement construction works are excluded from the sizing.
Base Year Value
$0.9B in 2025 (MMA Primary Research Dataset, August 2026)
Forecast Period
2026 to 2036, eleven discrete annual values
CAGR
8.8% base case. Bull 10.0%. Bear 7.6%.
Fastest Growth Segment
Quartz Piezoelectric Strip Sensor System: 13.2% CAGR
Fastest Growth Country
India: 11.6% CAGR
Fastest Growth Region
South Asia and Pacific: 11.0% CAGR
Largest Region
East Asia: 32% of 2025 global value
Market Leaders
Kistler Group, International Road Dynamics, Q-Free, Kapsch TrafficCom and TE Connectivity lead on installed lane deployment. Source: MMA Analysis, July 2026.
Primary Survey
n=3,800 procurement and R&D decision-makers, Q4 2025, six countries
Methodology
Demand-side build-up, cross-validated against public data, 47 expert interviews

Weigh-In-Motion System Market Forecast Scenarios

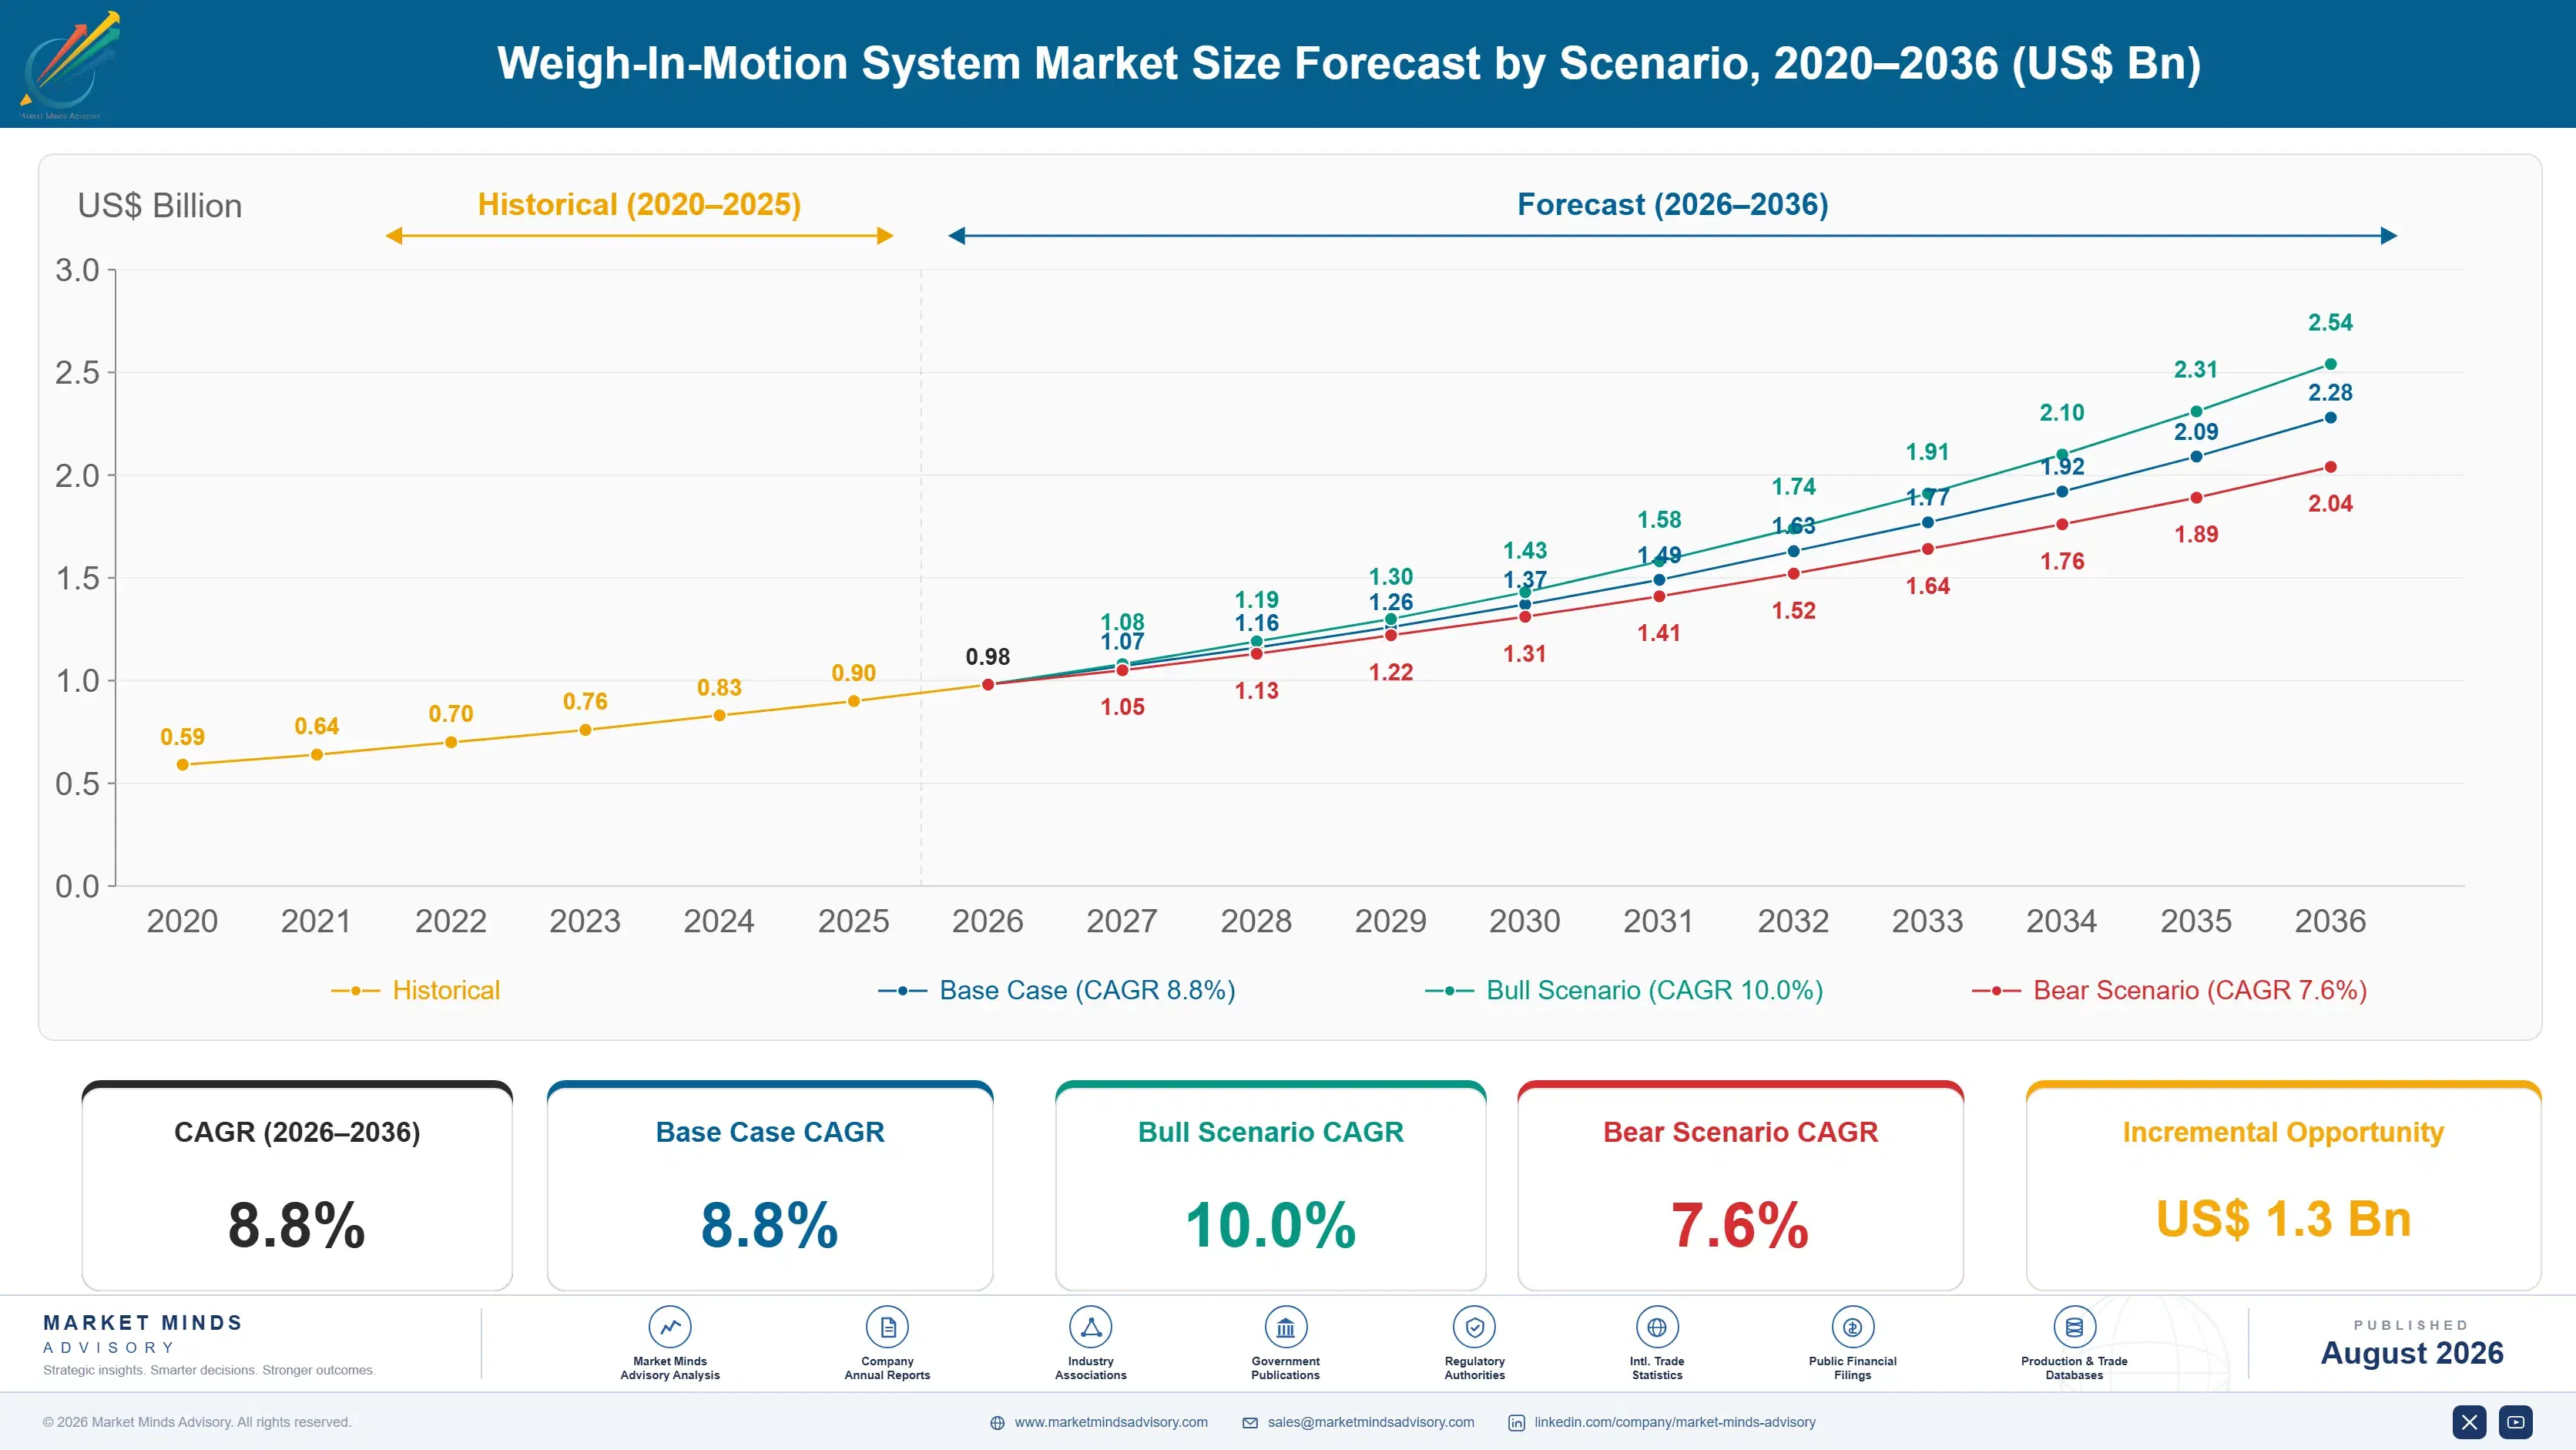
weigh-in-motion-system-market-size-forecast-scenario-1787322277552
Between 2020 and 2025 the market compounded at 7.4%, and the character of demand changed more than the total did. Chinese deployment slowed as its national programme approached coverage. European direct enforcement moved in the opposite direction, converting weigh-in-motion from a screening aid into a legally binding measurement, and that shift raised realised value per lane considerably faster than unit volume grew.
The base case at 8.8% rests on three mechanisms. Direct enforcement adoption keeps spreading as legal frameworks catch up with the metrology, and certified systems command multiples of screening-grade pricing. Infrastructure protection arguments keep funding deployment independently of enforcement revenue, since pavement damage from overloaded axles falls directly on road maintenance budgets. Emerging market highway programmes, particularly across India and Southeast Asia, add genuine deployment volume where overloading is severe and pavement funding is scarce.
The bull case at 10.0% turns on more jurisdictions adopting direct enforcement, which converts every existing screening installation into a candidate for certified replacement rather than merely adding new sites. The bear case at 7.6% is legal challenge succeeding against automatic penalties in a significant jurisdiction, which would stall the certification-driven value increase that this market's growth currently depends upon.

What Actually Drives Weigh-In-Motion Value

Two quite different businesses use the same equipment. Screening systems identify likely overloaded vehicles so inspectors stop the right ones, and accuracy of ten percent is perfectly adequate for that. Direct enforcement systems issue penalties automatically without anybody stopping the vehicle, and everything about the requirement changes.
TOP FIVE CONCENTRATION42%Share held by the five largest weigh-in-motion system suppliers
COST PER LANE$84,000Typical cost to instrument one highway lane completely
WEIGHING ACCURACY3% deviationTypical accuracy achieved by direct enforcement grade systems
SOFTWARE REVENUE SHARE26%Portion of supplier revenue from software and data services
OVERLOAD DETECTION RATE12%Share of heavy vehicles found exceeding permitted axle limits
SENSOR SERVICE LIFE8 yearsTypical period before an in-pavement sensor requires replacement
Legal metrology certification is the dividing line. A measurement that produces a fine must survive challenge in court, which means documented accuracy across temperature, speed and pavement condition, traceable calibration and an audit trail nobody can pick apart. Certified systems command roughly three times screening-grade pricing and the supplier field narrows sharply to those holding the approvals, which take years and considerable expense to obtain in each separate jurisdiction rather than once for all of them.
The underlying business case is pavement rather than penalties, and it is stronger than most road authorities initially realise. Damage rises with roughly the fourth power of axle load, so preventing overloading protects maintenance budgets by far more than the enforcement revenue generated. Authorities that understand this arithmetic fund deployment from maintenance rather than from enforcement, which is a considerably more durable source.
"The fourth power law is the most persuasive number in road engineering and hardly anybody outside the discipline knows it exists. Once a road authority genuinely understands that one overloaded truck does the damage of several thousand cars, the business case for this equipment stops being a discussion."
Practice Director, Transport Infrastructure Systems, Market Minds Advisory · MMA Technology Practice · August 2026

Market Trends

Direct Enforcement Converts Screening Into Legally Binding Measurement

Several European jurisdictions now issue overload penalties automatically from weigh-in-motion measurement without stopping the vehicle at all, which requires legal metrology certification that screening systems never needed. The measurement must survive court challenge, which means documented accuracy across temperature, speed and pavement variation, plus traceable calibration and a complete audit trail behind every reading. Certified systems command roughly three times screening-grade pricing and the supplier field narrows sharply, because those approvals take years and considerable expense to obtain separately in every single jurisdiction. Few suppliers have committed to that path.
Market Impact: Damage rises 4 times faster
Bridge Structures Become Instrumented Weighing Platforms

Bridge weigh-in-motion uses strain sensors on an existing structure to derive axle weights from how the bridge itself responds, which avoids cutting the road surface entirely and instruments a whole crossing rather than a single lane. Installation costs considerably less than in-pavement sensors wherever a suitable bridge already exists, and the same sensors monitor structural health as a genuine secondary benefit for the asset owner. Accuracy trails dedicated pavement systems, which currently confines the approach to screening and asset monitoring rather than the direct enforcement work carrying the highest value.
Market Impact: Detects 12% overloaded vehicles

Market Opportunities and Growth Drivers

Pavement Damage Economics Fund Deployment From Maintenance Budgets

Road pavement damage rises with roughly the fourth power of axle load, which means a moderately overloaded truck does several times the pavement damage of a legal one, and a badly overloaded vehicle does very much worse than that again. Road authorities calculating avoided maintenance rather than enforcement revenue reach a business case that pays back quickly and depends on issuing no penalties whatsoever. That framing also makes the funding considerably more durable across political cycles, since maintenance budgets exist regardless of whatever political appetite for enforcement happens to prevail.
Market Impact: Adds 6% error on poor pavement

Emerging Market Highway Programmes Instrument At Scale

India, Indonesia, Vietnam and several African corridor projects all face severe overloading against pavement funding that cannot absorb the resulting damage, which makes weigh-in-motion one of the highest return infrastructure investments available to those authorities. Indian national highway deployment at toll plazas charges overloaded vehicles directly, which converts enforcement into revenue collection that funds the whole programme itself. Development bank financing supports much of the African deployment, which shapes procurement timelines and supplier selection considerably more than any local preference does. Overloading rates across those corridors run far above developed market norms.
Market Impact: Risks 3 times pricing premium

Market Restraints and Challenges

Pavement Condition And Temperature Both Degrade Measurement Accuracy

A weigh-in-motion sensor measures what the road under it does, and rutted, cracked or thermally expanded pavement introduces error the sensor cannot distinguish from vehicle weight. The root cause is physical rather than any limitation in the electronics or the signal processing. Commercially this means sites need suitable pavement before installation and periodic recalibration afterwards, both of which add cost that procurement processes frequently underestimate badly. Participants are responding with temperature-compensated quartz sensors, automatic calibration against reference vehicles, and site suitability assessment built directly into the sales process rather than discovered afterwards during commissioning.
Market Impact: Commands 3 times screening pricing

Legal Challenge Threatens The Direct Enforcement Value Case

Automatic penalties issued from weigh-in-motion measurement invite challenge from hauliers with real money at stake, and a successful challenge in a significant jurisdiction would undermine the certification premium the whole growth case depends upon. The root cause is that any measurement made at speed carries uncertainty a determined lawyer will probe. Commercially the legal exposure sits with road authorities rather than with suppliers, but the demand effect on suppliers would be immediate and severe. Participants are responding with tighter metrology documentation, conservative tolerance application and expert witness support for authorities defending challenges in court.
Market Impact: Cuts installation cost 45%
3 additional market trends, 4 additional growth drivers, and 2 additional restraints and challenges are covered in the full report. Contact sales@marketmindsadvisory.com to access the complete intelligence.

Segment CAGR and Growth Architecture

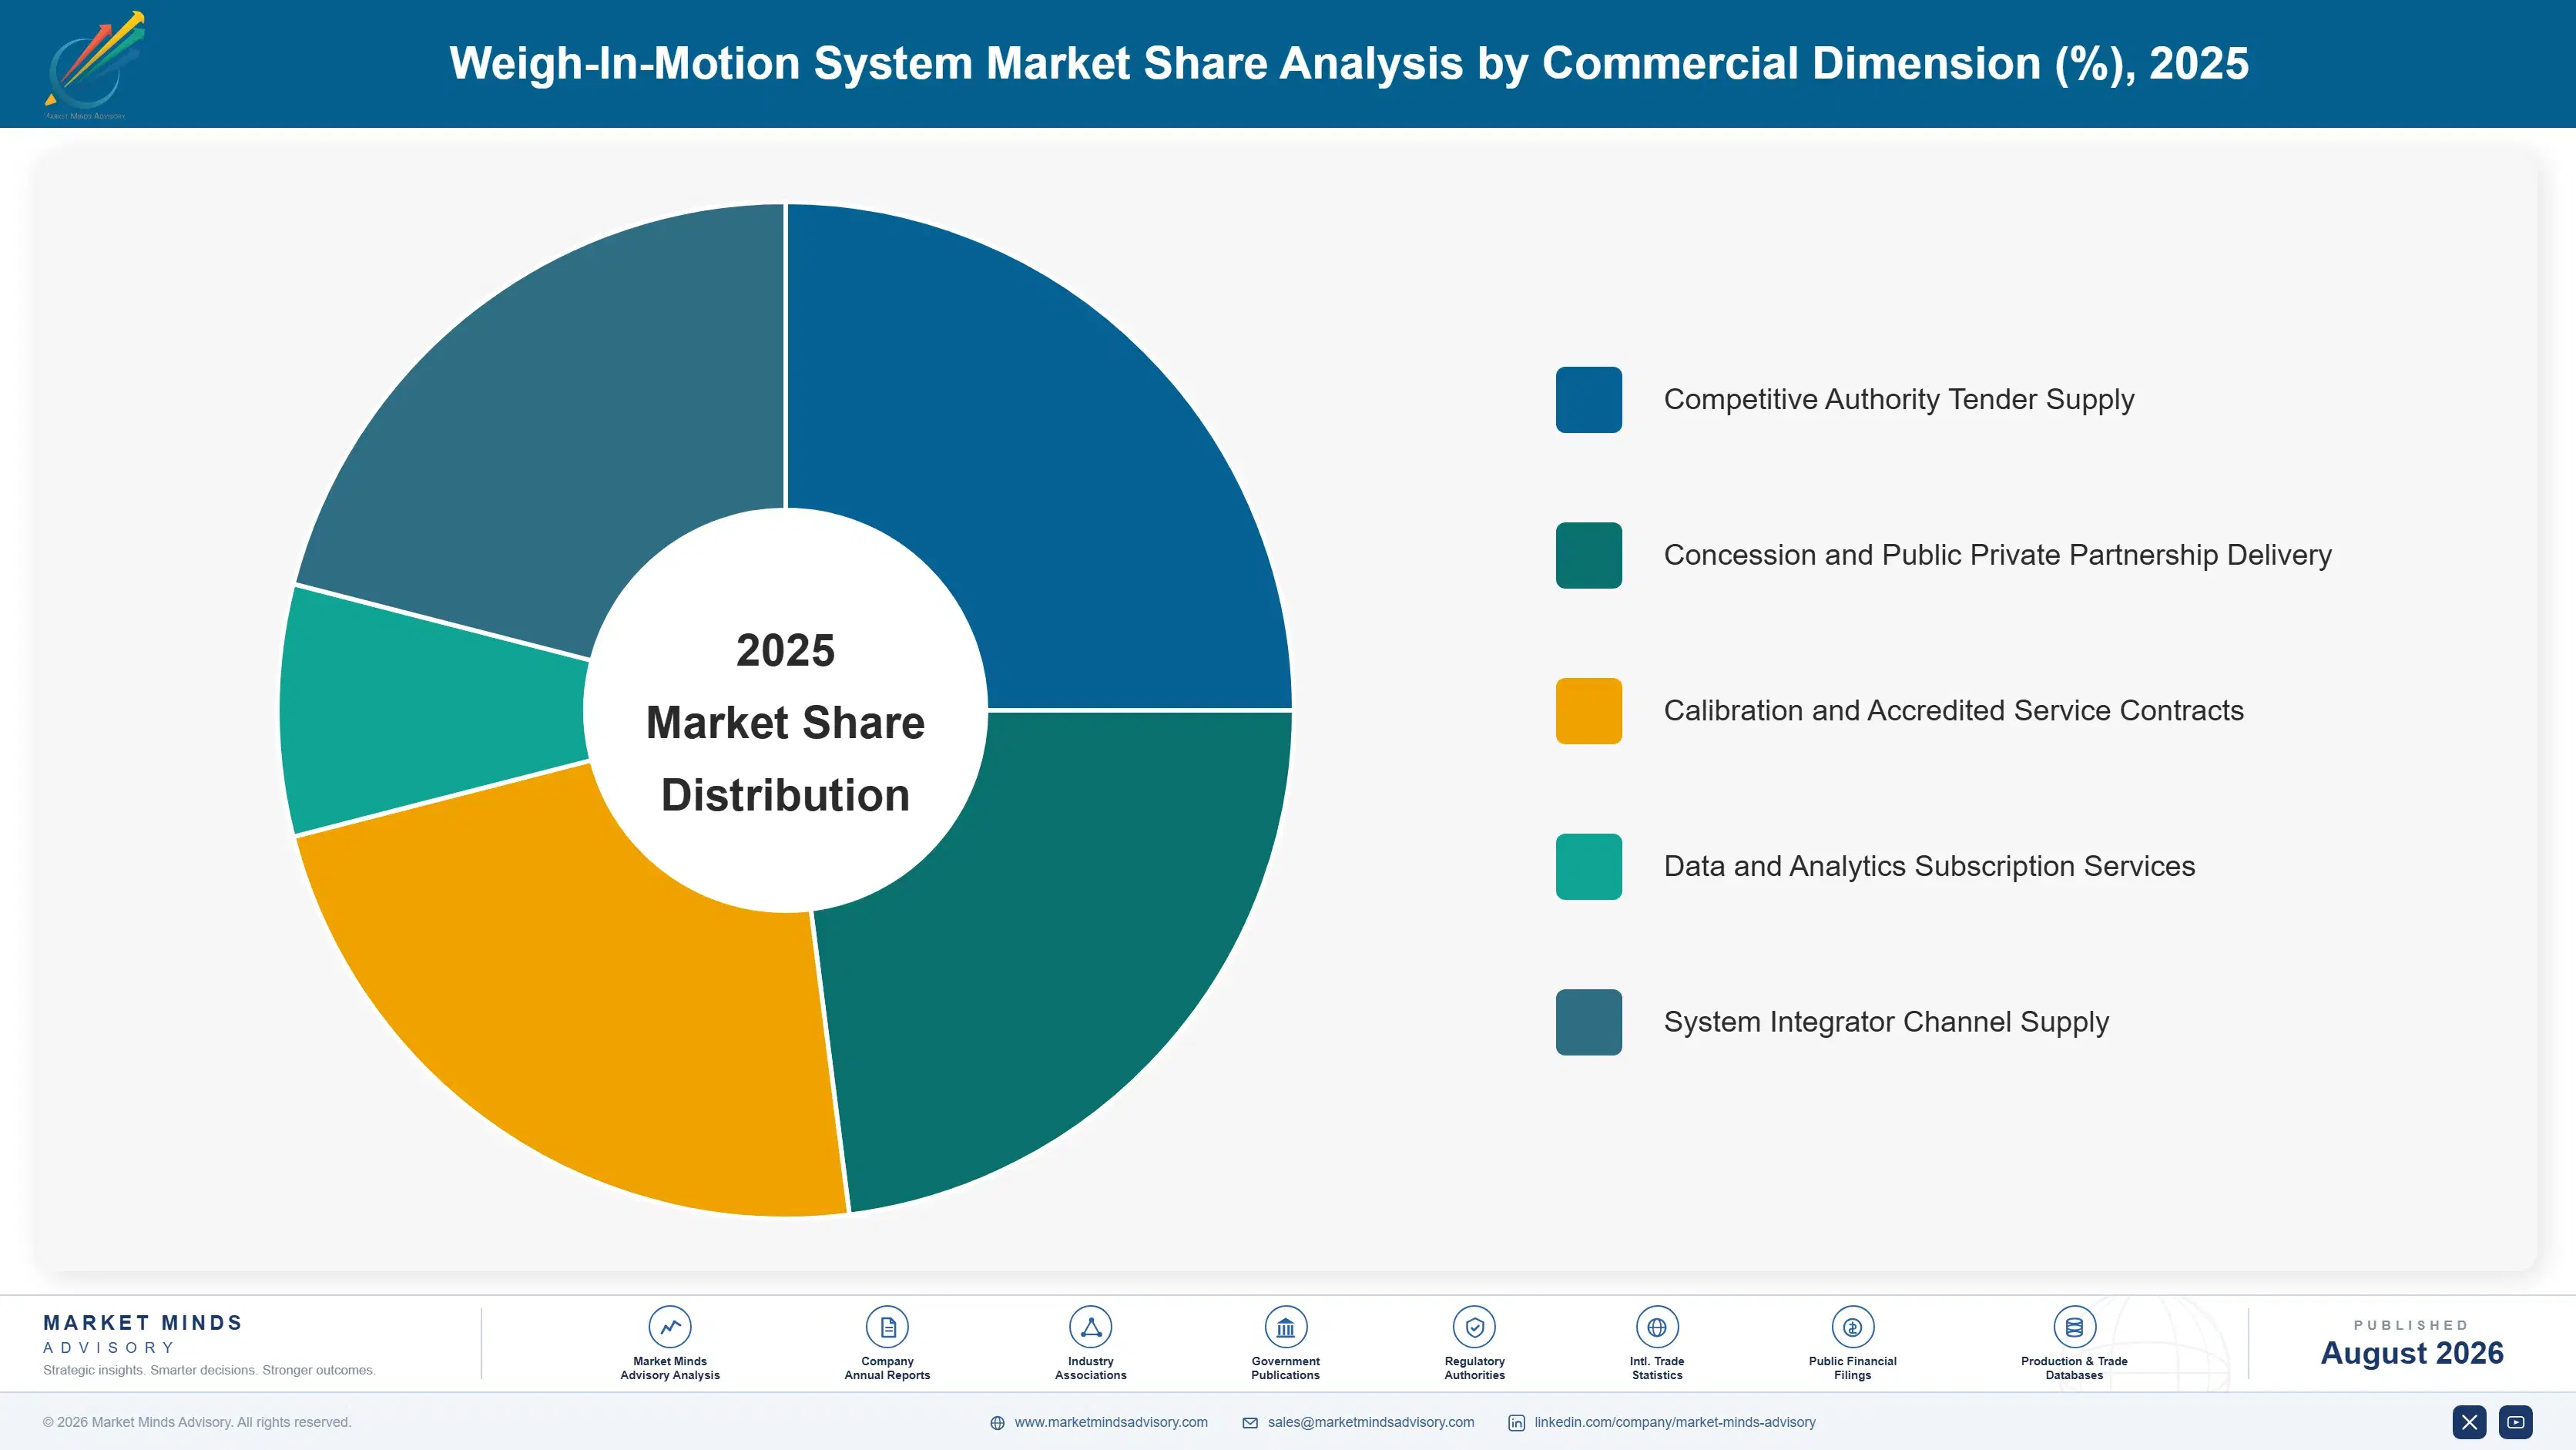
Segmentation follows sensor technology, because how weight is actually measured determines achievable accuracy, temperature stability, installation method, service life and whether a system can obtain the legal metrology approval that direct enforcement demands. Software, enforcement integration, calibration regime and data services all sit downstream of that sensor decision, and every one of them is priced directly against it.
weigh-in-motion-system-market-market-share-analysis-1787322278136

Quartz Piezoelectric Strip Sensor System

The fastest segment at 13.2%, a full 1.50 times the market rate, covering sensors using quartz crystal elements in strip form set into the pavement, where charge generated under load gives a measurement that stays stable across temperature in a way polymer and ceramic alternatives do not. Temperature stability is the whole commercial argument. Direct enforcement requires accuracy documented across the full operating range, and a sensor drifting with road temperature cannot obtain the legal metrology approval that automatic penalties demand. Quartz systems cost considerably more than polymer strips at installation and last longer in service, which changes the whole life comparison substantially in their favour once certification value is counted.
CAGR 13.2%

Fibre-Optic and Bridge Weigh-In-Motion System

Growing at 10.6% on fibre-optic sensing and bridge weigh-in-motion, which derives axle weights from how an existing bridge structure responds rather than from anything embedded in the road surface. Avoiding installation entirely is what drives adoption here. Instrumenting a bridge requires no lane closure, no pavement cutting and no reinstatement, and it covers every lane crossing the structure rather than one instrumented strip. The same sensors monitor structural health continuously, which lets an authority fund the installation from two budgets at once. Accuracy currently trails dedicated pavement systems, which confines the approach to screening and asset monitoring rather than the direct enforcement work that carries the highest value in this market.
CAGR 10.6%
Full segment breakdown across 5 segments available in the complete report.

Regional Architecture and Country Demand Map

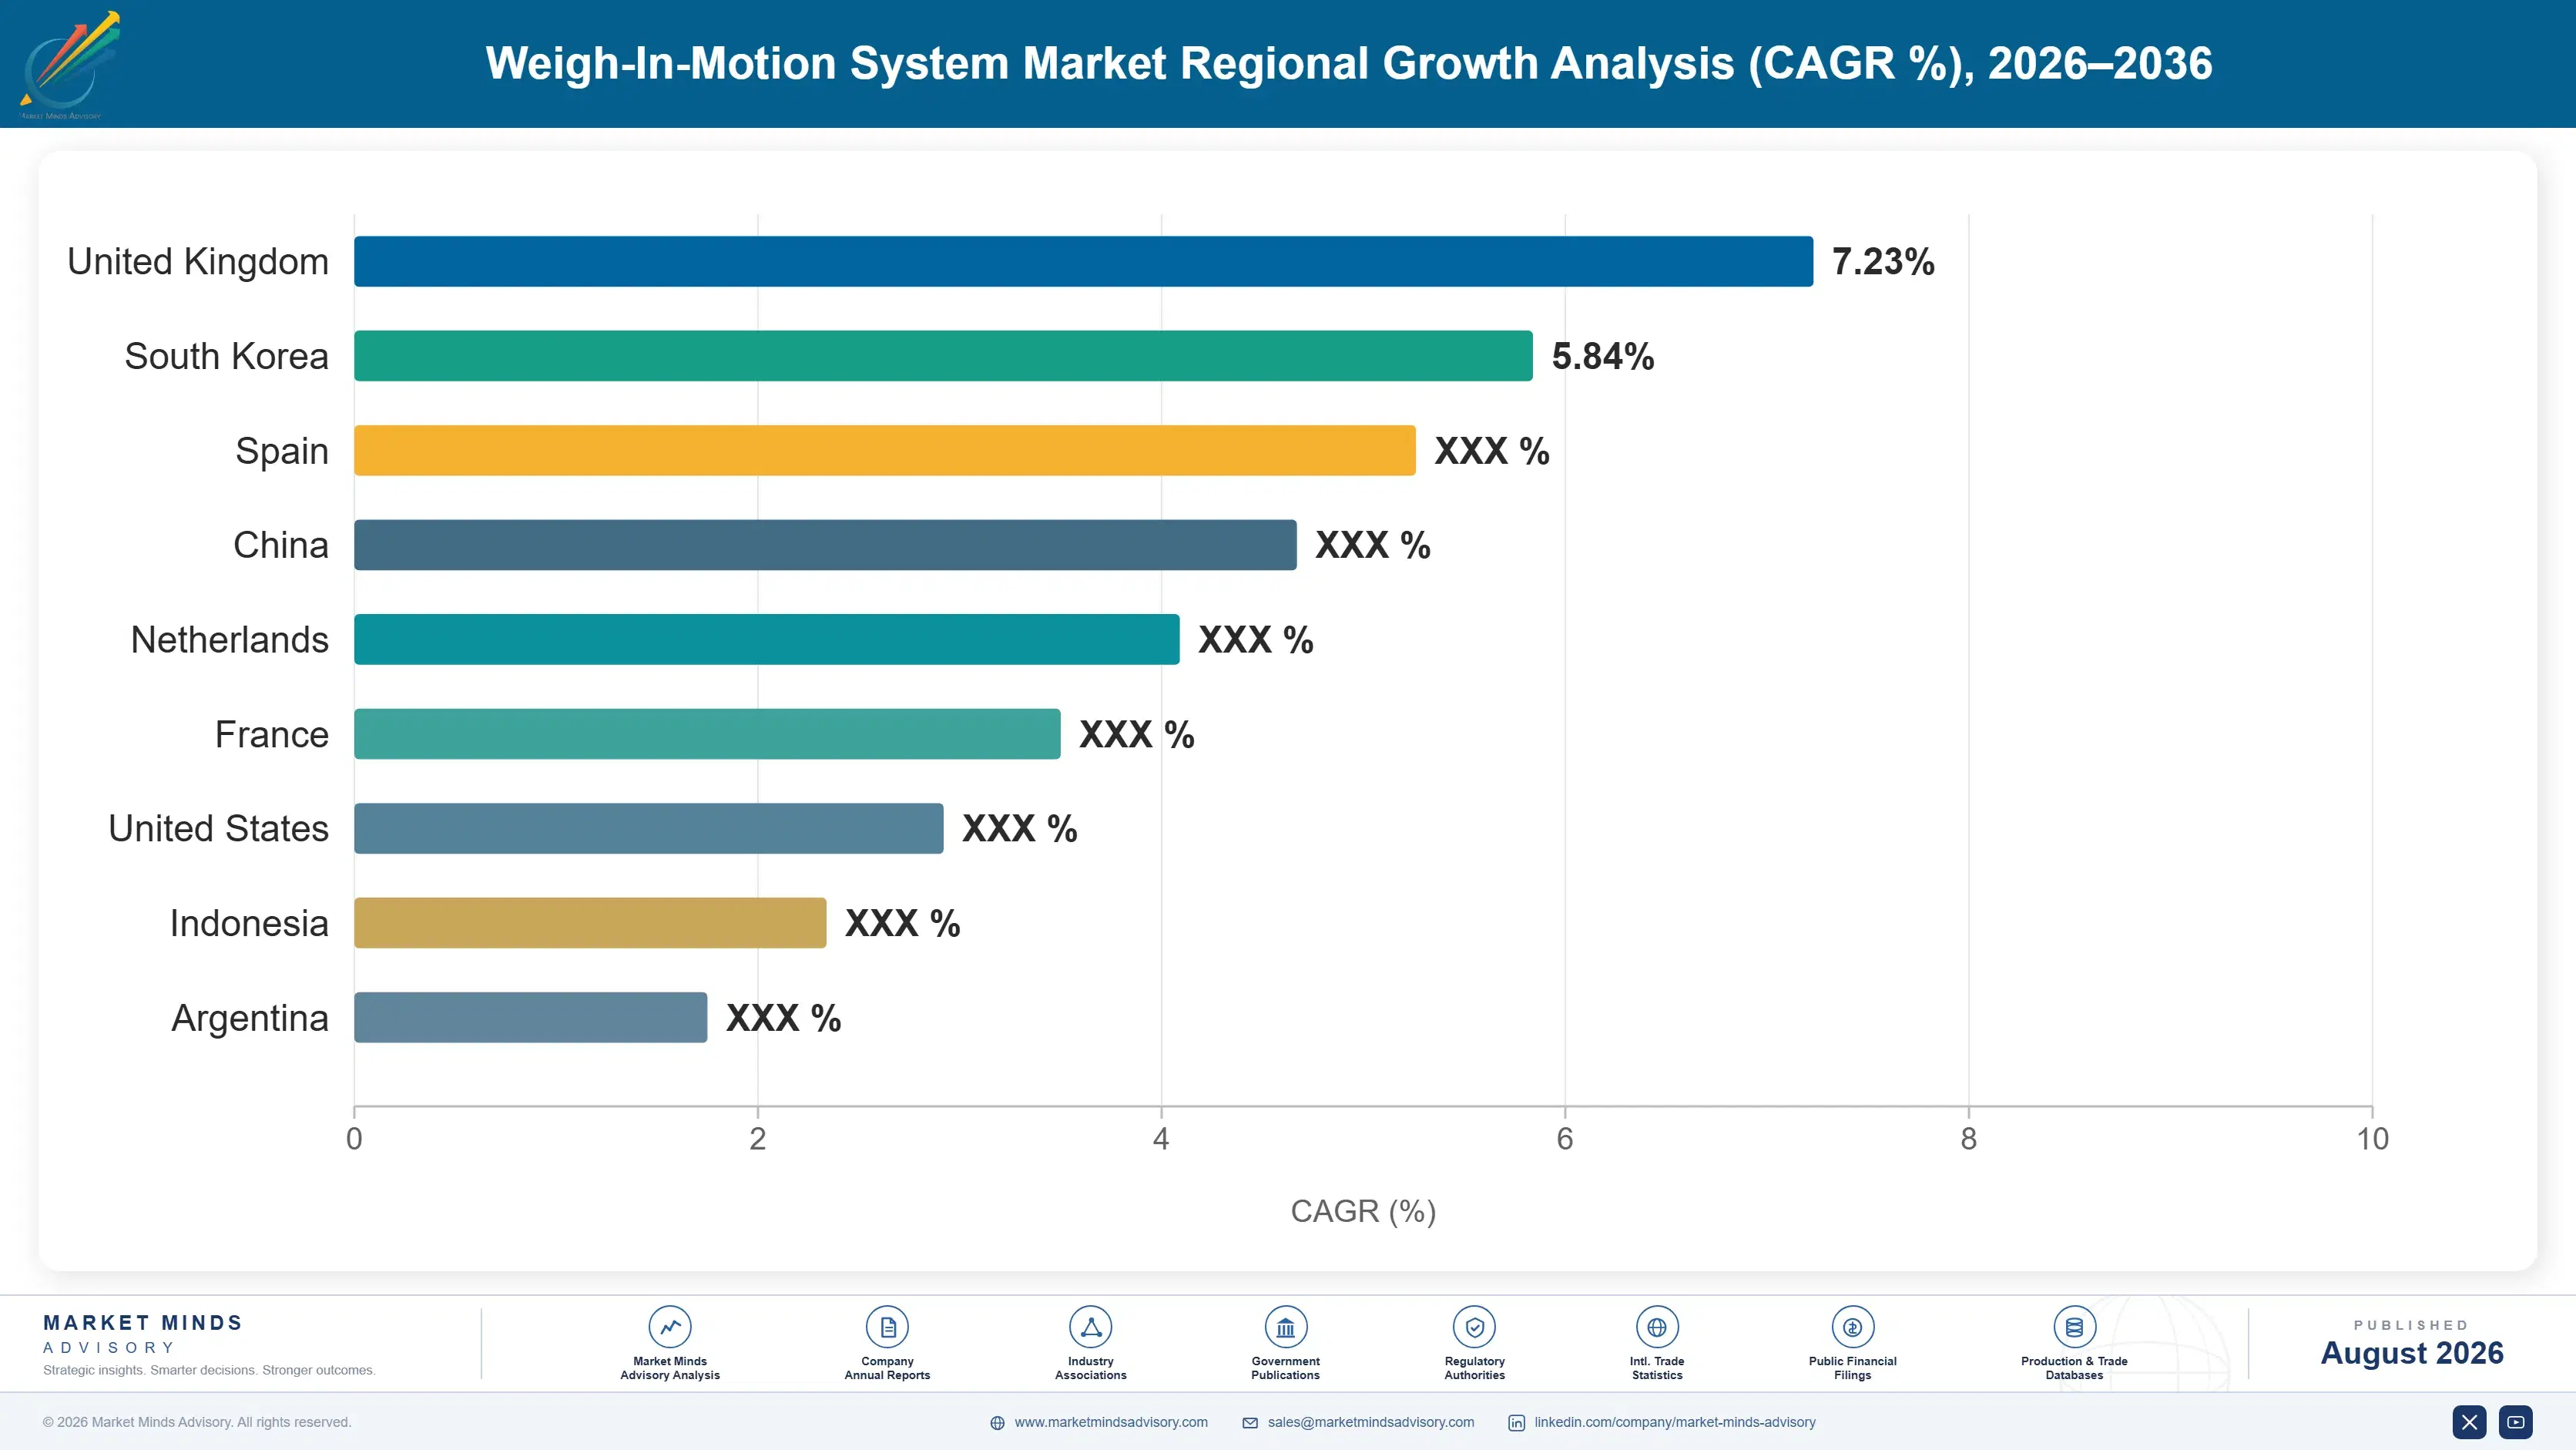
East Asia holds 32% of global value on a Chinese overload enforcement programme considerably larger than anything attempted anywhere else. Western Europe follows closely on direct enforcement adoption and legal metrology approval, while growth runs fastest across South Asia and Pacific on national highway programme deployment and severe overloading.

East Asia

Note: East Asia holds 32% against a 22 to 30% band because China ran the largest overload enforcement programme any country has attempted, instrumenting highway and provincial road networks at a scale nobody else approaches. Bridge failures attributed to overloaded trucks made the case politically unavoidable, and deployment followed at a pace Western procurement could not match. Beijing Wanji, Hikvision and Dahua supply most of it domestically. Japanese and Korean deployment is mature and enforcement-focused, integrated with expressway tolling infrastructure that was built alongside. Regional export activity into Southeast Asia and Africa is substantial and growing steadily. Coverage rather than initial deployment now drives the domestic replacement cycle across China.
Share: 32% | CAGR: 10.0% (2026 to 2036)

Western Europe

Direct enforcement is furthest advanced here and it changes what the technology must deliver. Several countries now issue penalties automatically from weigh-in-motion measurement without stopping the vehicle, which demands legal metrology certification and accuracy that pre-screening systems never required. That regulatory step raised system value sharply and narrowed the supplier field to those holding the approvals. Bridge weigh-in-motion using existing structures as instrumented scales has also developed furthest across European research and deployment. Infrastructure protection rather than revenue drives most procurement, since overloaded axles damage pavement disproportionately and road authorities fund the systems from maintenance budgets. Certification rather than raw sensing capability is what decides who actually competes across this whole region.
Share: 24% | CAGR: 7.3% (2026 to 2036)
Regional intelligence for 5 additional markets available in the complete report: North America, South Asia and Pacific, Latin America, Middle East and Africa, Eastern Europe. Contact sales@marketmindsadvisory.com.
weigh-in-motion-system-market-country-cagr-analysis-1787322278649

Where Weigh-In-Motion Margin Is Won

Four commercial positions separate the suppliers earning genuine returns from those selling sensors into somebody else's system integration: holding legal metrology certification across jurisdictions, selling avoided pavement maintenance to asset teams rather than enforcement revenue to police, converting one-off installations into genuinely recurring data service revenue, and owning calibration and service capability across the deployed base.

Hold Legal Metrology Certification Across Several Jurisdictions

Direct enforcement requires approval that survives court challenge, and obtaining it takes years and considerable expense in every jurisdiction separately. Suppliers holding certification across multiple regimes realise roughly three times screening-grade pricing and face a competitive field narrowed to a handful of names, which is a rare position in any infrastructure market. The barrier protects whoever cleared it far better than any patent could, and it explains why certified deployments concentrate among suppliers who committed to that path long before the regulation actually arrived. Certified systems command roughly 3 times screening pricing, and certification itself is the whole asset.
Market Impact: Realises 3 times the screening grade system pricing

Sell Avoided Pavement Maintenance Not Enforcement Revenue

Road damage rises with roughly the fourth power of axle load, which means preventing overloading protects maintenance budgets by far more than any penalty income the same system ever generates. Suppliers framing the business case that way reach maintenance budgets rather than enforcement ones, and maintenance budgets are considerably larger, far more durable and much less politically exposed. Deployments justified on avoided maintenance close 25% to 34% faster than those depending on penalty revenue projections, which finance departments quite reasonably discount heavily before approving anything. The framing decides which budget you reach.
Market Impact: Closes deployment decisions 34% faster than penalty cases

Convert Installations Into Recurring Data Service Revenue

Software and data services already supply 26% of supplier revenue at gross margins running 20 to 28 points above hardware, and authorities value continuous traffic loading data for pavement design fully as much as for enforcement itself. Structuring calibration, reporting and analytics as subscriptions holds that customer across the whole eight year sensor life rather than only at the point of installation. The revenue also arrives during entire years when no capital deployment happens at that authority at all, which smooths a genuinely lumpy business. The shift is largely irreversible now.
Market Impact: Adds 28 margin points across all data services

Own Calibration And Service Across The Deployed Base

Certified systems require periodic recalibration against reference vehicles in order to maintain their legal standing, and an authority whose calibration has lapsed cannot lawfully issue any penalties at all. Suppliers holding accredited calibration capability capture 18% to 25% additional lifetime revenue per installed lane, and they make themselves genuinely difficult to displace, since switching supplier means requalifying the entire measurement chain from the sensor upward. Independent service providers otherwise take that work entirely, and they take the customer relationship sitting behind it as well. Independents rarely hold the accreditation required.
Market Impact: Captures 25% additional lifetime revenue on each lane

Who Controls the Margin Pool

Concentration sits at 42% for the top five measured on installed lane deployment, the basis used throughout this section. Kistler leads on quartz sensor technology that most certified direct enforcement systems depend upon, while International Road Dynamics and Q-Free hold strong system integration positions and Kapsch competes across wider traffic infrastructure. TE Connectivity supplies sensing components across several competitors' systems simultaneously, which complicates the competitive picture considerably.
Competitive activity runs on three fronts. Legal metrology certification is the first and the most consequential, since it determines who can quote direct enforcement deployments at all. Data service conversion is the second, and suppliers are restructuring commercial models toward recurring revenue as authorities value loading data alongside enforcement. The third is calibration and service network coverage, which keeps certified systems legally valid and the customer relationship intact.

Pressure arrives from two directions. Chinese suppliers compete at delivered costs Western manufacturers cannot approach, particularly across African and Southeast Asian corridor projects funded through development lending. Separately, bridge weigh-in-motion approaches threaten in-pavement sensor demand where suitable structures exist. Rankings will shift on who holds certification when more jurisdictions adopt direct enforcement frameworks.
weigh-in-motion-system-market-company-positioning-matrix-1787322279177

Competitive Moat and Risk Dimensions

KISTLER GROUP

Moat: Quartz sensor technology position

Quartz sensing technology that holds accuracy across temperature is what makes legal metrology certification achievable, and most certified direct enforcement systems depend on it regardless of who integrates them. That component position captures value from competitors' deployments as well as its own, which is an unusually comfortable place to sit in any market.
KISTLER GROUP

Risk: Component supplier margin ceiling

Supplying sensing technology into systems that others integrate means capturing component value rather than the system and service revenue that carries higher margin. Integrators who develop or qualify alternative sensing would remove that position, and several are actively investigating exactly that as certified deployment volume grows large enough to justify the effort.
INTERNATIONAL ROAD DYNAMICS

Moat: System integration and enforcement software

Complete system capability spanning sensors, roadside electronics, enforcement software and calibration service means the authority buys one accountable supplier rather than assembling a measurement chain from several. That breadth also positions the business to hold the calibration relationship that keeps certified systems legally valid year after year.
INTERNATIONAL ROAD DYNAMICS

Risk: Dependence on external sensor supply

Core sensing technology arrives from component suppliers whose pricing and roadmap the business does not control, which caps margin and creates exposure if a supplier prioritises a competitor. Developing internal sensing capability would require metrology expertise and certification work measured in years rather than in product cycles.

Players Tracked

Prominent Players

Kistler Group
International Road Dynamics
Q-Free
Kapsch TrafficCom
TE Connectivity

Other Key Players

Intercomp
Cross Zlin
Sterela
Traffic Data Systems
ECM Electronique Controle Mesure
Sensys Gatso Group
Mettler-Toledo
Avery Weigh-Tronix
Rice Lake Weighing Systems
Hikvision
Dahua Technology
Beijing Wanji Technology
Toledo do Brasil
Efkon
Siemens Mobility

Recent Developments

MARCH 2025

Direct enforcement approval granted for additional highway corridor

A national road authority obtained full legal metrology approval to issue overload penalties automatically across an additional major highway corridor during the year, which extends direct enforcement to sites that had previously operated only as screening installations feeding manual inspection at a nearby weigh station.
Signal: Direct enforcement approval converts every existing screening installation into an immediate candidate for certified system replacement
JULY 2025

Bridge weigh-in-motion deployed across structural monitoring programme

A national transport authority deployed bridge-based weigh-in-motion sensing across several crossings within a wider bridge structural health monitoring programme running across the network, obtaining axle loading data and bridge condition assessment from exactly the same sensor installation without ever having to close a single traffic lane.
Signal: Bridge instrumentation lets authorities fund weighing capability from asset monitoring budgets rather than from enforcement ones
NOVEMBER 2025

Overload charging linked directly to toll plaza collection

A national highway operator linked its weigh-in-motion measurement directly to the toll plaza charging system, billing overloaded vehicles a supplementary charging rate at the actual point of vehicle passage rather than having to pursue any separate enforcement action through a separate penalty process weeks afterwards.
Signal: Charging overloaded vehicles at the toll point converts enforcement into revenue collection that funds itself entirely

What Drives Weigh-In-Motion Cost

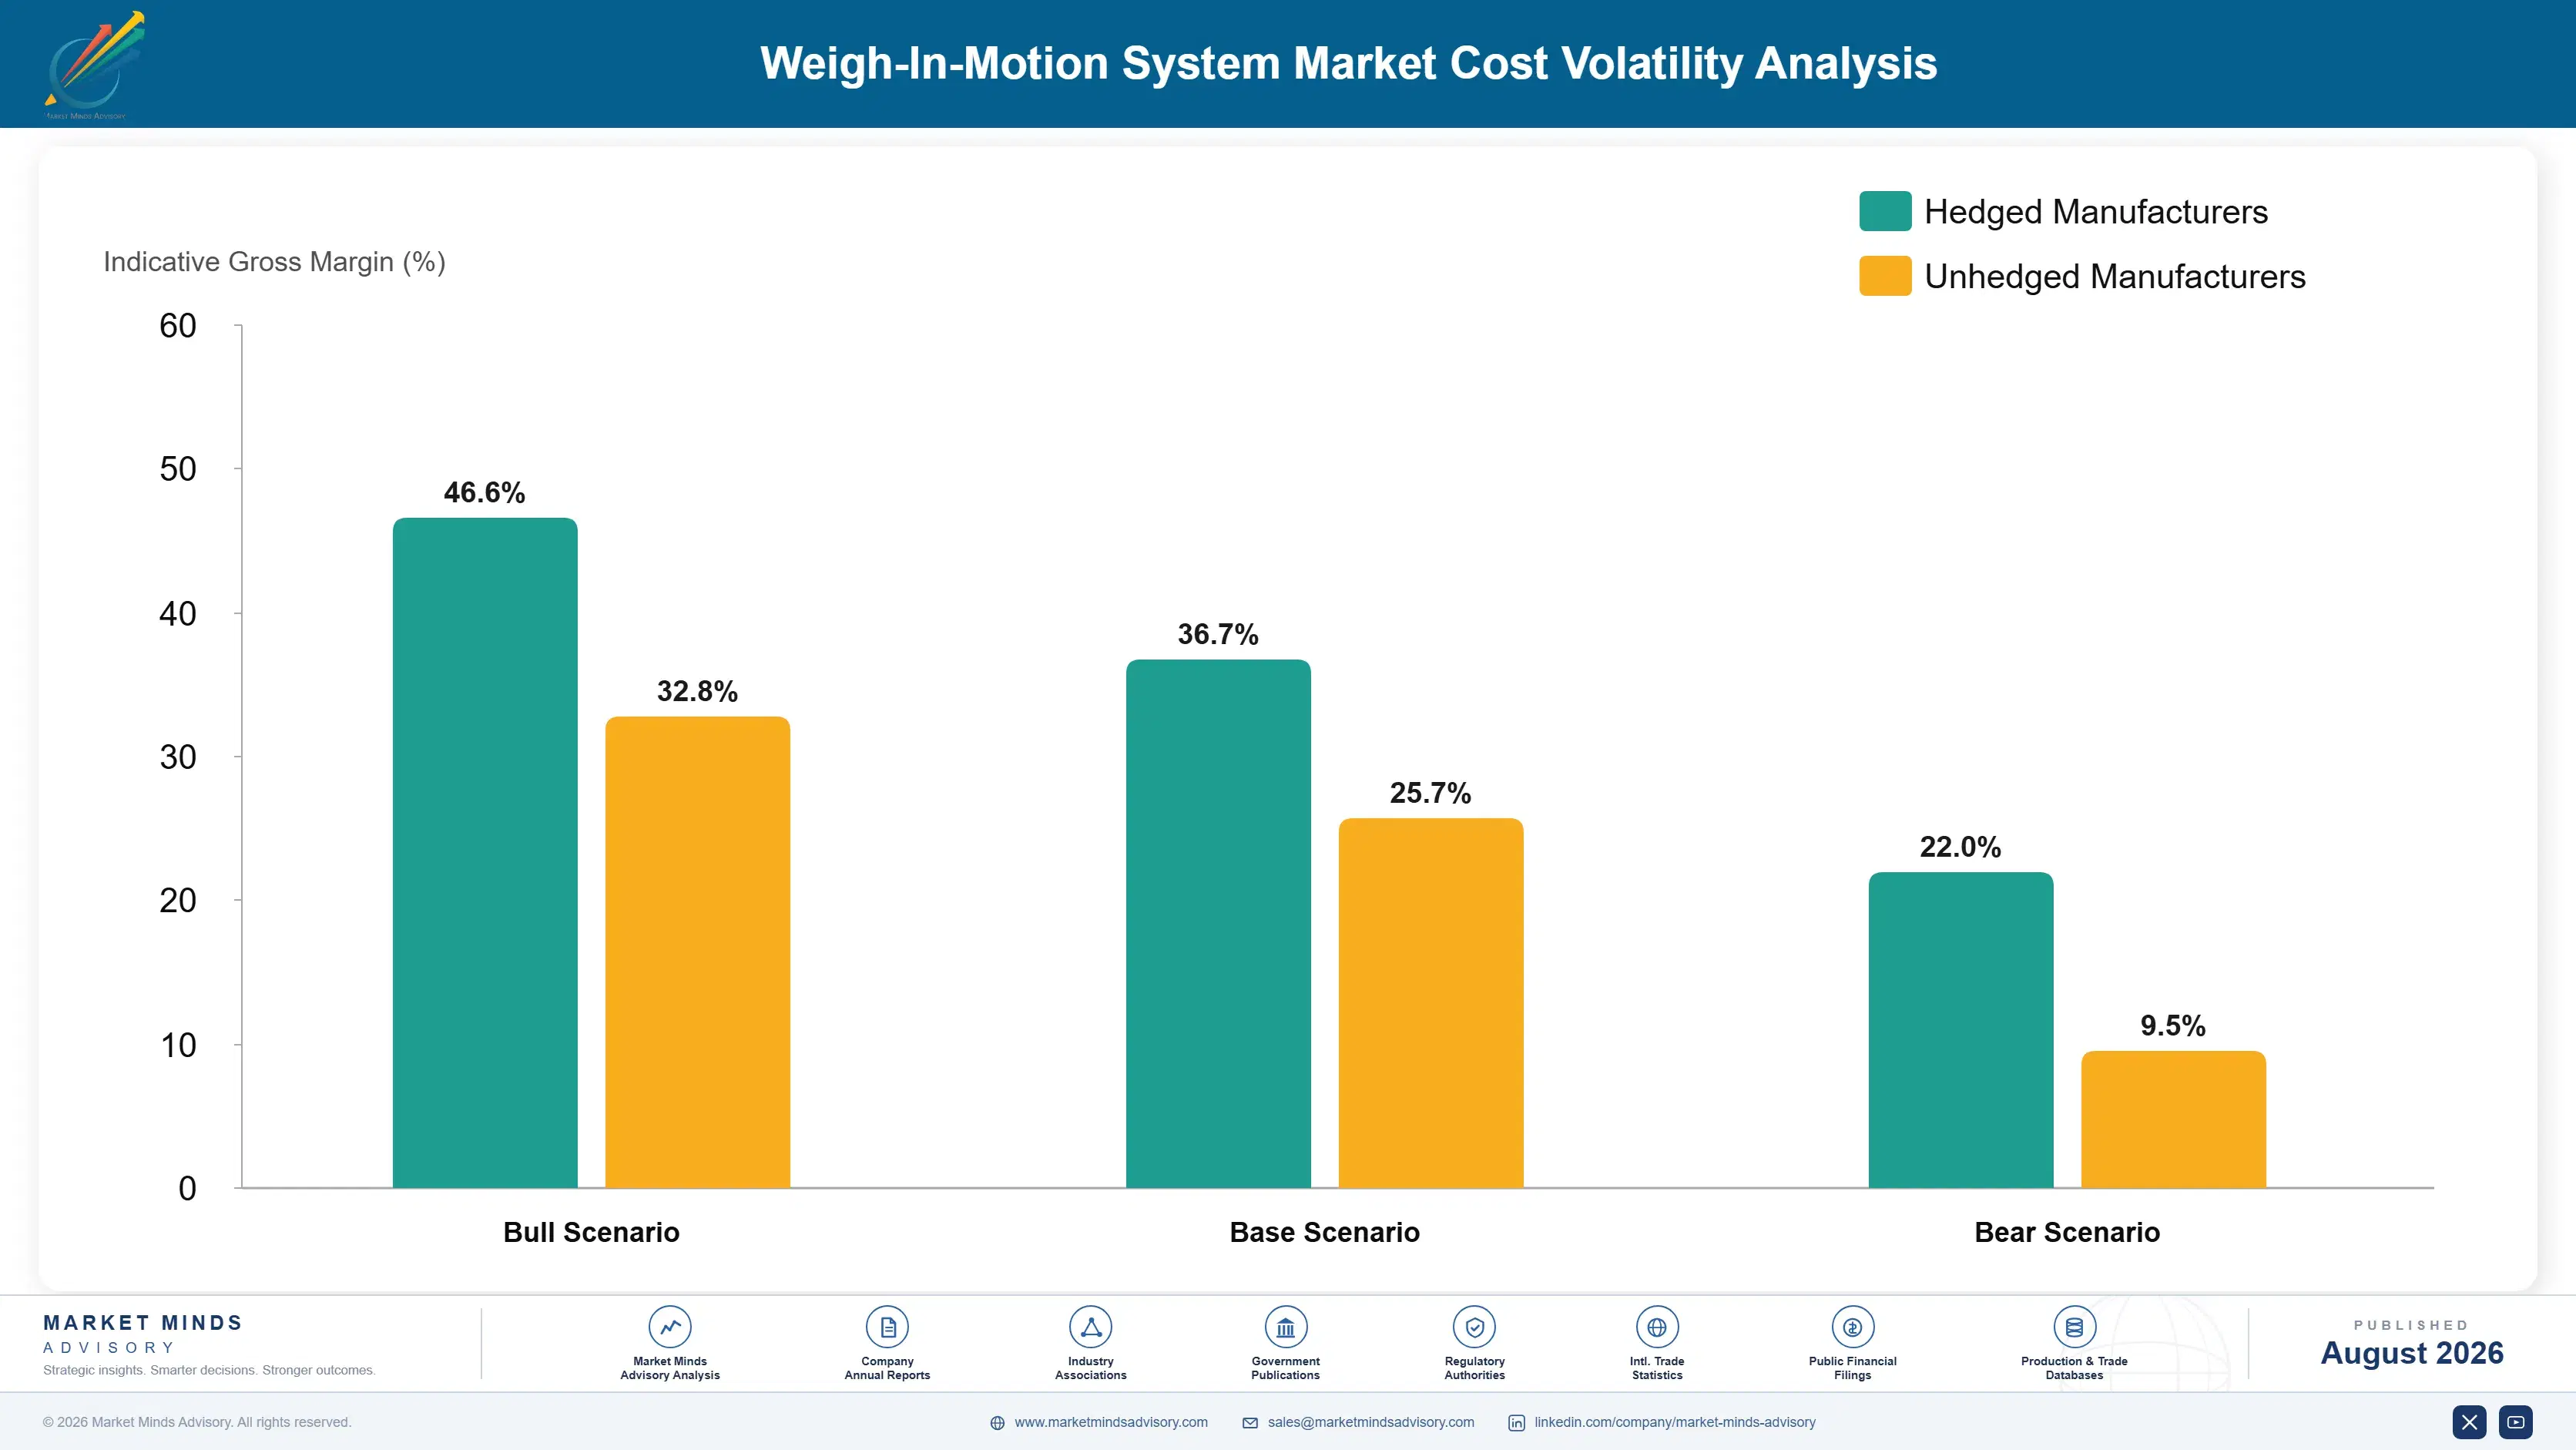
Sensors account for roughly 32% of delivered system cost, and quartz elements carry a substantial premium over ceramic or polymer alternatives that certified deployments must nonetheless pay. Roadside electronics, cabinets and communications add around 18%. Civil installation, including lane closure, pavement cutting and reinstatement, contributes a further 28% and rises sharply where traffic management is complex. Software, calibration and commissioning account for about 15% of a typical installation.
Construction labour has risen steadily since 2021 across most markets, and it affects this industry disproportionately because installation is nearly a third of cost. Semiconductor availability delayed roadside electronics deliveries through the 2021 shortage and pushed several programmes past funding deadlines. Kapsch TrafficCom Annual Report 2025 identifies component availability and project cost inflation as continuing factors, and European Commission road programme data shows the funding cycles behind deployment timing.

The disadvantage mechanism is installation exposure rather than sensor purchasing. A supplier carrying civil works within a fixed-price contract holds construction labour risk that has moved faster than any hardware component, and lane closure costs on busy highways can exceed the equipment itself. Exposure varies by technology too: bridge weigh-in-motion avoids pavement works entirely, removing the most volatile cost line from the project.
weigh-in-motion-system-market-cost-volatility-analysis-1787322279371

Separate civil works scope from system supply contracts

Pavement cutting, reinstatement and traffic management carry construction labour risk that system suppliers are poorly placed to manage and that has moved faster than equipment pricing. Contracting those elements separately or through a specialist partner carrying the exposure protects margin on the technology scope. Some authorities prefer single-point responsibility, which makes this a negotiation rather than a unilateral choice.

Favour bridge instrumentation where suitable structures exist

Bridge weigh-in-motion requires no lane closure, no pavement cutting and no reinstatement, which removes the most volatile cost line from a project entirely. It also serves structural monitoring budgets alongside weighing ones. Accuracy currently limits the approach to screening rather than direct enforcement, so the choice depends on what the authority actually needs from the site.

Qualify roadside electronics across multiple component vendors

Controllers and communications hardware built so comparable parts from two or three vendors substitute without redesign remove the allocation exposure the 2021 shortage created. The cost is duplicated validation at design stage. Against a deployment that missed its funding deadline waiting for one vendor's components, that cost recovers on the first avoided delay comfortably.

Portfolio Architecture for Margin Defence

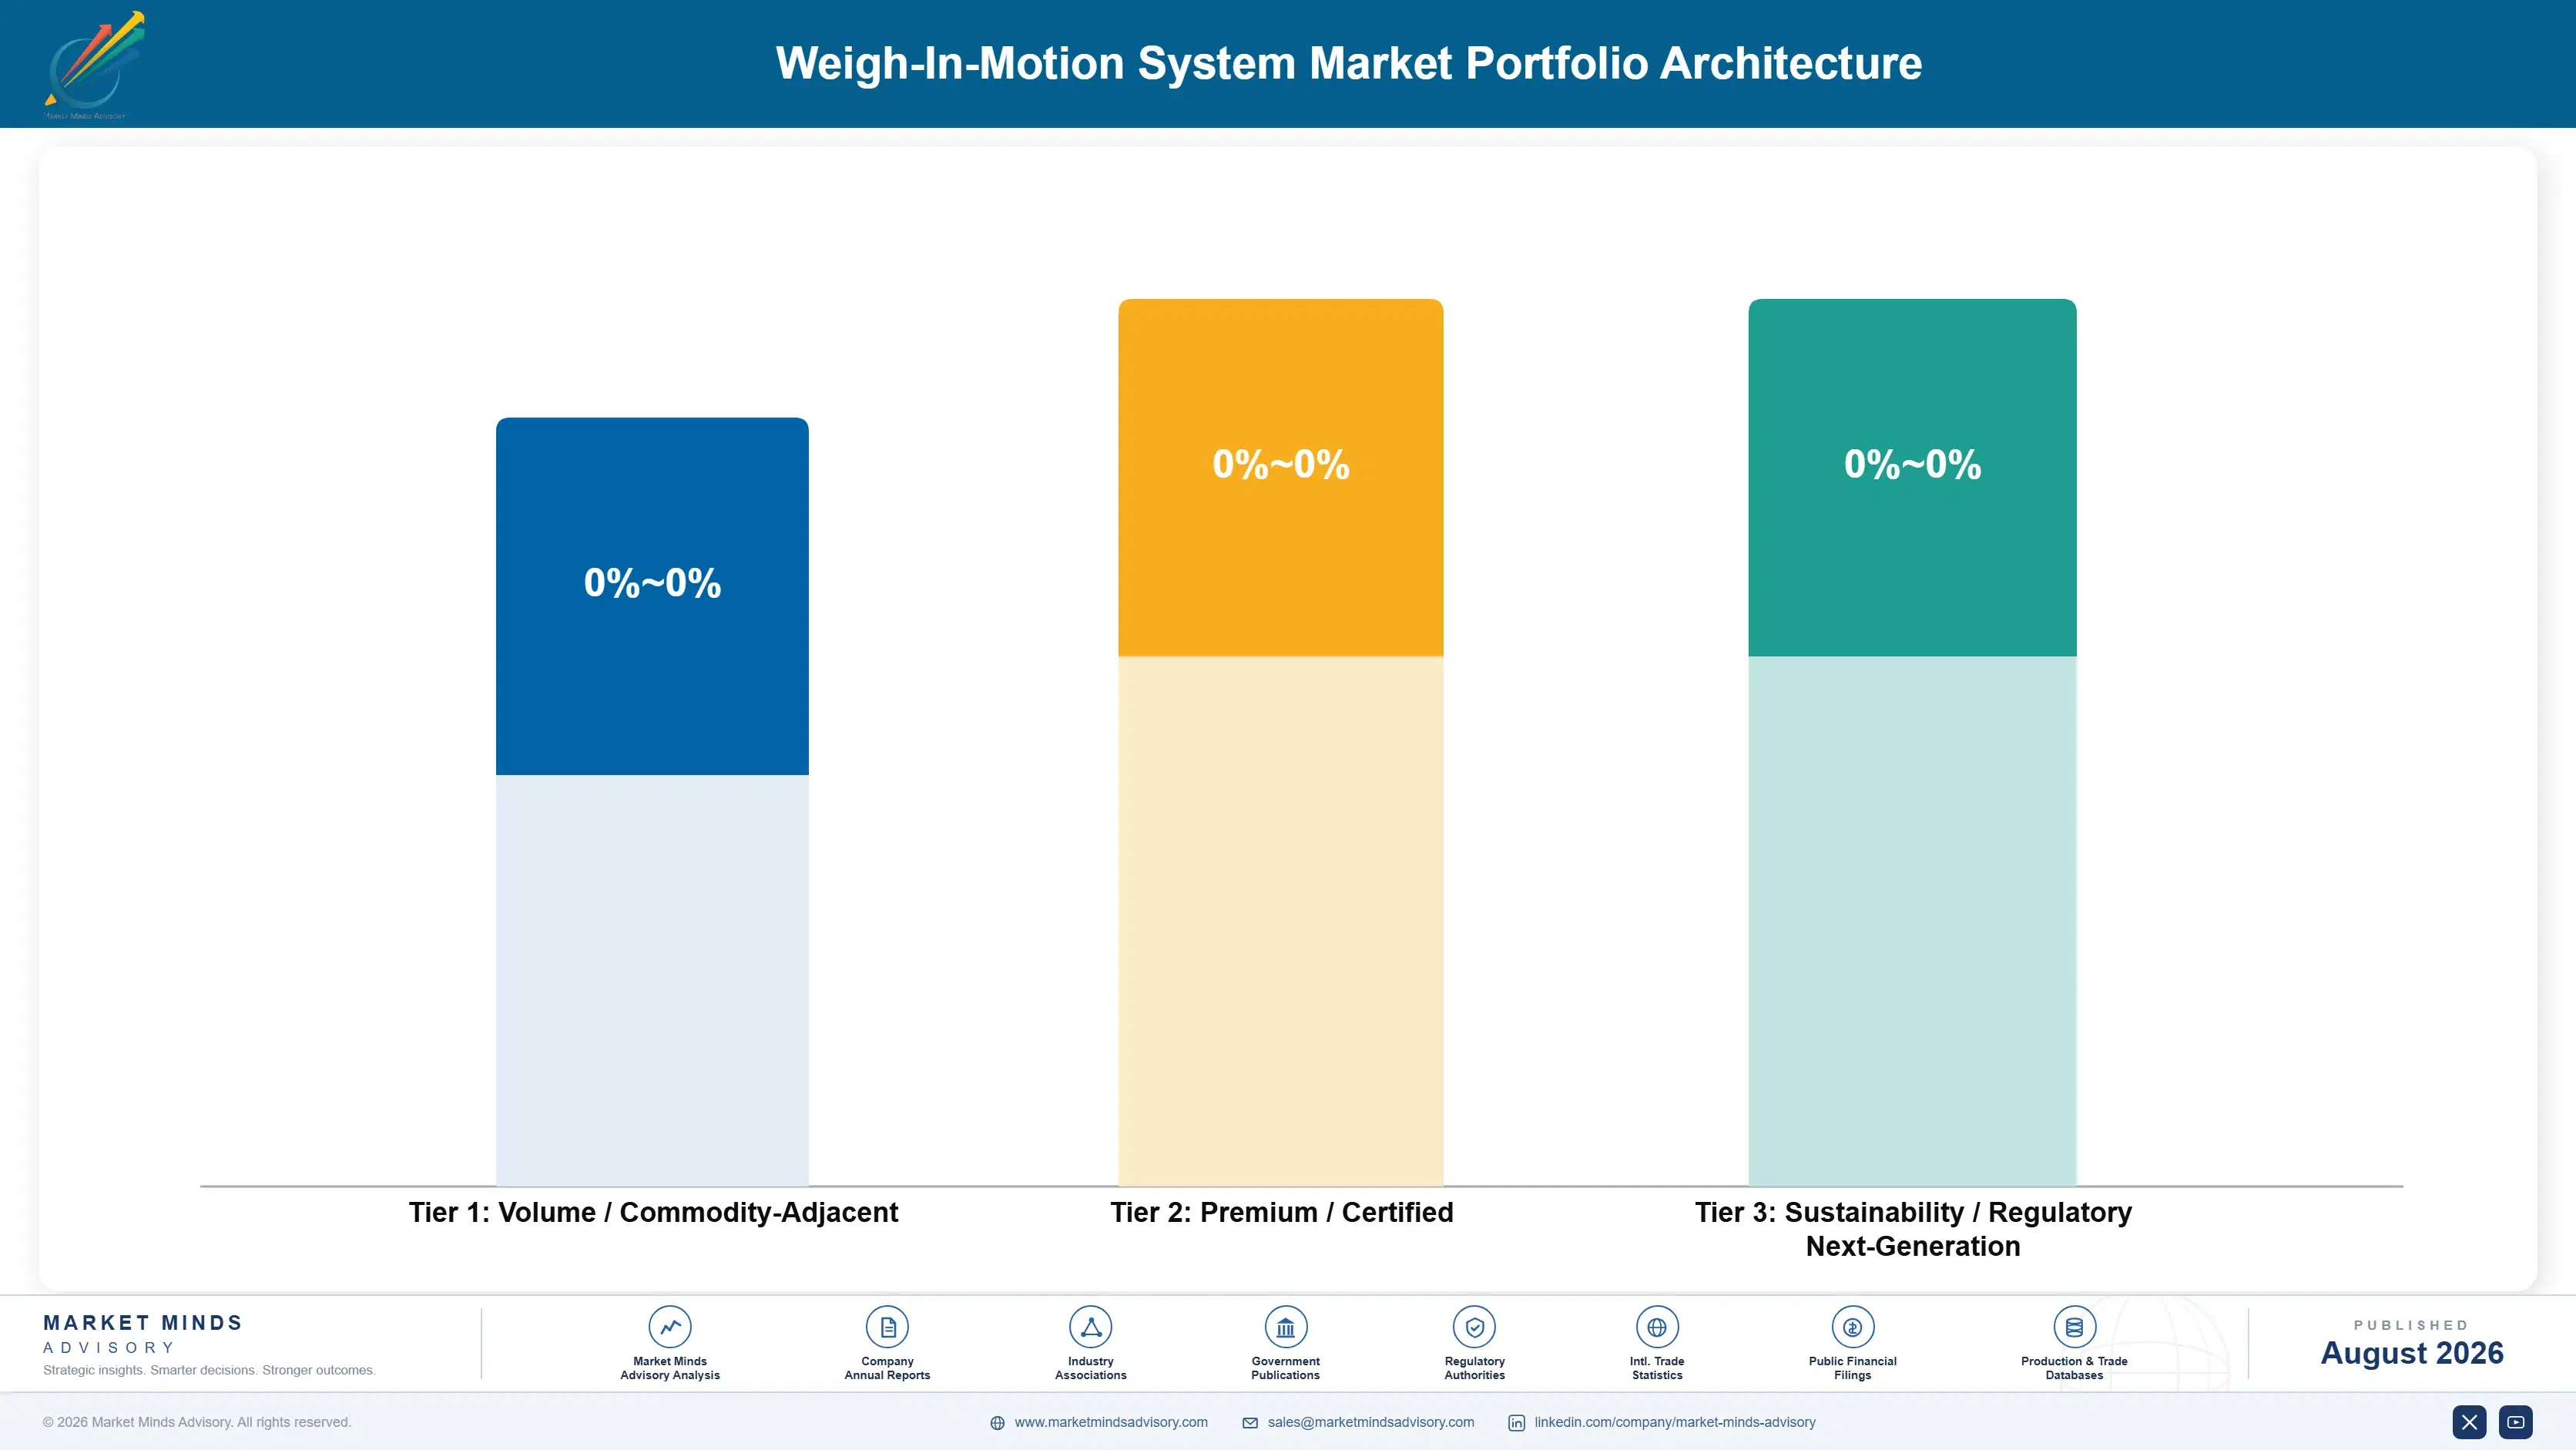
Portfolio economics here divide on certification and recurring content rather than on sensor type. Screening-grade systems supplied into competitive tenders earn gross margins in the high teens, because accuracy requirements are modest enough that several suppliers qualify and price decides the award once technical compliance is established by everybody bidding. Volume here secures the authority relationship rather than any margin at all.
The premium tier is certified direct enforcement supply. Legal metrology approval that survives court challenge narrows the field to a handful of suppliers, commands roughly three times screening pricing and takes years to obtain in each jurisdiction, which makes the position genuinely defensible. Margins run in the mid thirties. Approval breadth decides where in that range a supplier actually lands.

Above both sits calibration, data services and analytics revenue. Certified systems require periodic recalibration to maintain legal standing, authorities value continuous loading data for pavement design independently of enforcement, and both revenues recur across an eight year sensor life. Margins reach the low forties, and the calibration relationship makes displacement genuinely awkward because switching supplier means requalifying the whole measurement chain. Authorities value the loading data almost as much as the enforcement.

Volume / Commodity-Adjacent

Screening-grade systems supplied into competitive tenders for pre-selection and data collection. Accuracy requirements are modest enough that several suppliers qualify, and price decides the award once basic technical compliance has been established by everyone bidding.
Gross Margin: 16 to 22%

Premium / Certified

Certified direct enforcement systems carrying legal metrology approval. The range reflects how many jurisdictions a supplier holds approval in, which determines both pricing power and how much deployment it can address.
Gross Margin: 31 to 39%

Sustainability / Regulatory / Next-Generation

Accredited calibration, data services and pavement loading analytics delivered across the deployed base. The wide range spans basic reporting through to full managed responsibility for the authority's entire measurement chain.
Gross Margin: 39 to 47%
weigh-in-motion-system-market-portfolio-architecture-1787322279876

High-value Sub-segments and Strategic Watch-out

Accredited Calibration And Data Services

High value and high growth sitting squarely together. Certified systems need periodic recalibration in order to keep their legal standing at all, authorities value loading data for pavement design independently of enforcement, and switching supplier would mean requalifying the entire measurement chain from the sensor upward.
Gross Margin: 40 to 48%

Certified Direct Enforcement Systems

High value running on genuinely rapid underlying growth. Legal metrology approval that survives court challenge takes several years to obtain in each jurisdiction separately, which narrows the competitive field to a handful of names and it supports pricing at roughly three times what screening grade systems command.
Gross Margin: 31 to 39%

Bridge And Structural Instrumentation

The genuinely emerging tier sitting inside this particular portfolio. Instrumenting an existing structure avoids pavement works entirely and it serves structural asset monitoring budgets alongside the weighing budgets themselves, though measurement accuracy currently confines the approach to screening rather than the higher value enforcement work.
Gross Margin: 26 to 34%

Screening Grade System Supply

The strategic watch-out sitting squarely inside this particular portfolio. Volumes here remain genuinely substantial across pre-selection and data collection sites everywhere, but accuracy requirements are modest enough that many suppliers qualify, and nothing durable at all accrues to the supplier from winning any individual award.
Gross Margin: 16 to 22%

How Weigh-In-Motion Demand Repeats

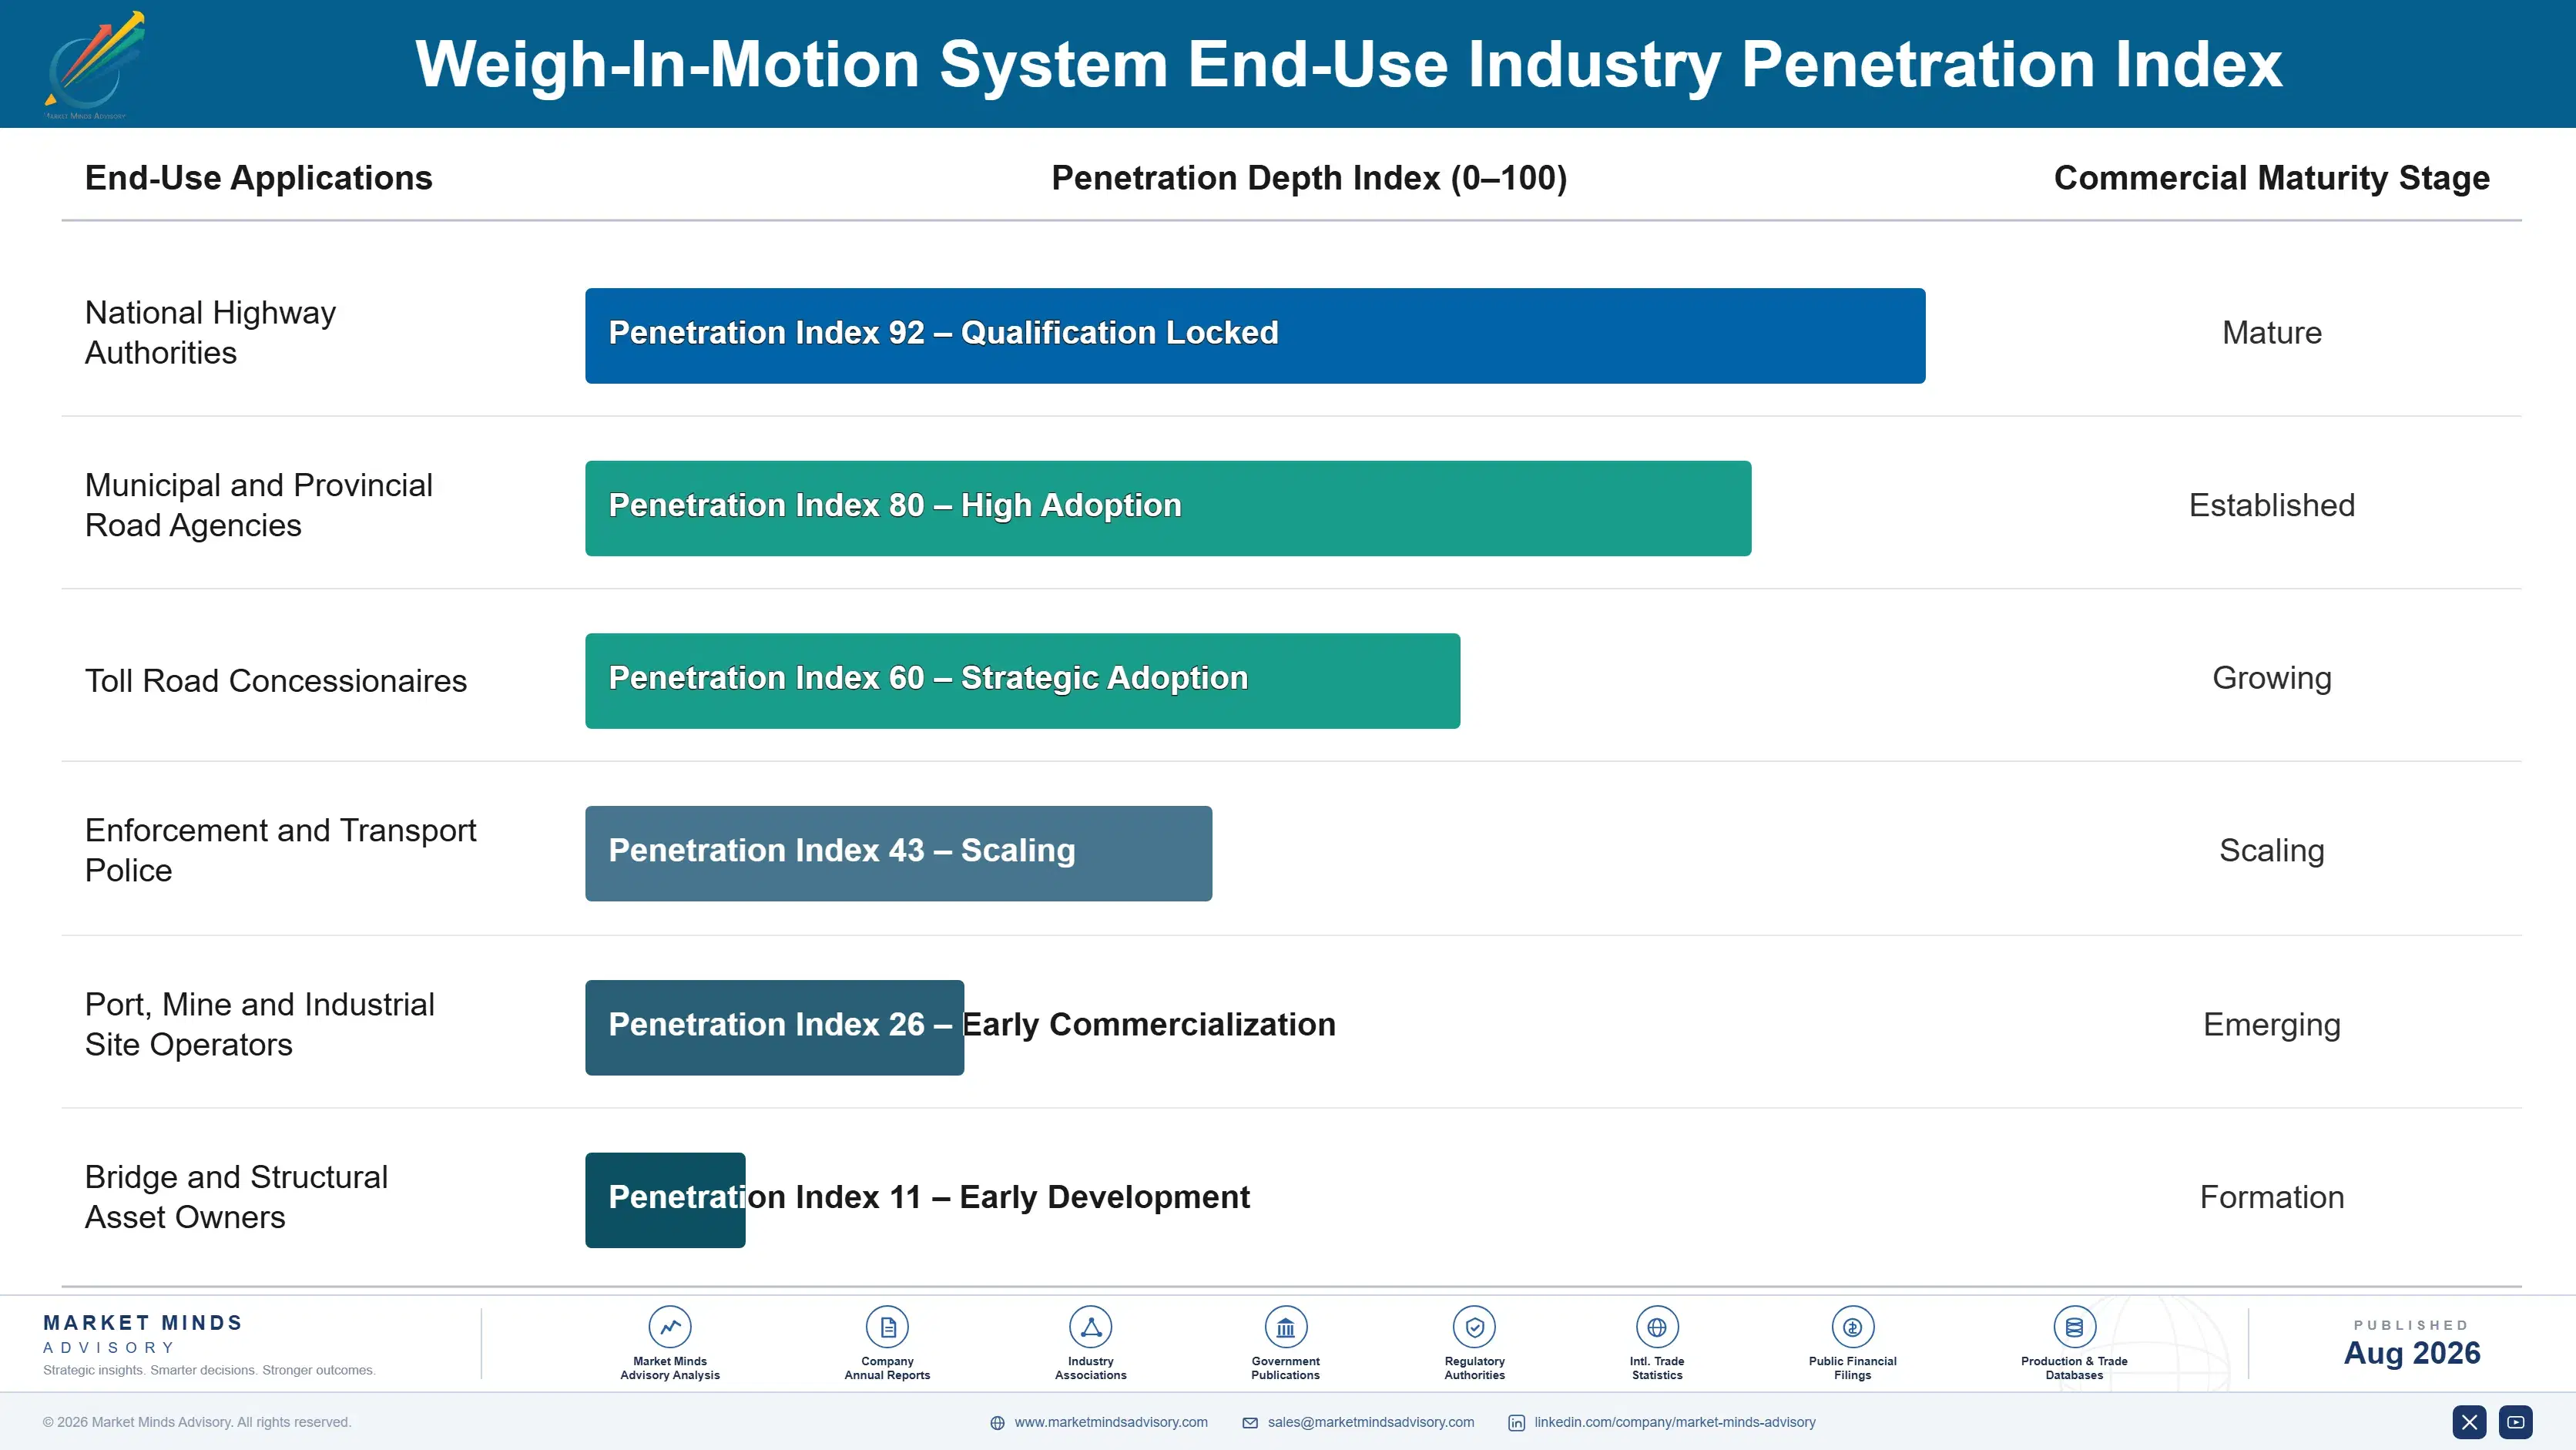
The annuity here is the deployed lane rather than any individual project. A sensor installation lasts around eight years before replacement, and across that period it generates calibration, service, software and data revenue continuously, all of it recurring against an authority budget that exists regardless of new deployment. Winning the original installation therefore secures roughly a decade of related spending, which is why suppliers accept thin margins on screening hardware to establish a position.
Stickiness varies considerably by system type. Certified direct enforcement installations are the stickiest by a wide margin, because switching supplier means requalifying the entire measurement chain and obtaining fresh legal approval, neither of which any authority undertakes lightly. Calibration relationships are nearly as durable for the same reason. Screening installations are considerably more contestable at replacement. Data-only deployments for pavement research show the least loyalty of all, retendering freely on price.

The buyer profile has shifted noticeably. Procurement once sat with enforcement agencies evaluating detection capability in isolation from anything else. Today it increasingly involves road asset management teams weighing pavement damage avoidance, structural monitoring and loading data alongside enforcement, which favours suppliers who can argue infrastructure economics rather than only demonstrate that the scale works.
weigh-in-motion-system-market-end-use-penetration-index-1787322280361

Where To Compete And Why

These are among the four positions where our research anticipates prominent divergence between winners and laggards over the coming forecast period. Each is grounded in the demand model, the regulatory perimeter, and the announced capacity pipeline.
01 / LEGAL METROLOGY CERTIFICATION

Approval decides who quotes at all

Direct enforcement requires certification that survives court challenge, and obtaining it takes years and considerable expense in every jurisdiction separately rather than once. Suppliers holding approval across multiple regimes realise roughly three times screening-grade pricing, against a competitive field narrowed to a handful of names. The barrier protects whoever cleared it far better than any patent could, and it explains why certified deployments concentrate among the few suppliers who committed to that path years before the regulation had even arrived.
02 / PAVEMENT ECONOMICS FRAMING

Sell to maintenance not to enforcement

Road damage rises with roughly the fourth power of axle load, so preventing overloading protects maintenance budgets by far more than any penalty income the same system ever generates. Suppliers framing the case that way reach maintenance budgets instead, and those are considerably larger, far more durable and much less politically exposed than enforcement ones. Deployments justified on avoided maintenance close 25% to 34% faster than those resting on penalty revenue projections, which finance departments quite reasonably discount before approving anything.
03 / RECURRING DATA CONVERSION

Loading data outlives every enforcement cycle

Software and data services already supply 26% of supplier revenue at gross margins running 20 to 28 points above hardware, and authorities value continuous traffic loading data for pavement design quite as much as they value it for enforcement. Structuring calibration, reporting and analytics as subscriptions holds that customer across a full eight year sensor life rather than only at the point of installation. That revenue also arrives during entire years when no capital deployment happens at that authority at all.
04 / CALIBRATION NETWORK OWNERSHIP

Lapsed calibration voids the whole system

Certified systems require periodic recalibration against reference vehicles in order to maintain legal standing, and an authority whose calibration has lapsed cannot lawfully issue any penalties whatsoever. Suppliers holding accredited calibration capability capture 18% to 25% additional lifetime revenue per installed lane, and they become genuinely difficult to displace at all, since switching would mean requalifying the entire measurement chain from the sensor upward. Independent providers otherwise take that work entirely, and they take the customer relationship sitting behind it as well.

Engagement Snapshot From the Field

A live engagement with an industry participant carrying material or product regulatory and market exposure ahead of a defining policy shift, showing how our research translates into a defensible multi-year portfolio strategy.
MARKET MINDS ADVISORY · CLIENT ENGAGEMENT SUMMARY
Weigh-In-Motion System Producer Strategic Portfolio Review and Transition Roadmap 2026·Investment Scenario on Weigh-In-Motion System Exposure Evaluation 2025-26
CLIENT PROFILE
A European supplier of weigh-in-motion systems with annual revenue near $62 million (client-reported, unverified by MMA), roughly 84% of it from screening-grade installations sold into competitive road authority tenders across nine countries. The business held solid sensing and integration capability but legal metrology approval in only one jurisdiction, and it provided no calibration service across its own installed base at all.
STRATEGIC CHALLENGE
Direct enforcement adoption was converting the client's screening installations into candidates for certified replacement by competitors who held approvals it did not. Margins on screening work had compressed as specifications became comparable across bidders. Management needed to decide between pursuing certification in additional jurisdictions, building accredited calibration capability, or repositioning toward bridge instrumentation where no certification applied.
MMA APPROACH
MMA mapped legal metrology approval requirements and timelines across eleven European jurisdictions, quantified the client's installed base facing certified replacement, and modelled calibration and data service revenue against the deployed lanes it already held. Twenty expert interviews with road authority engineers, metrology officials and enforcement agencies tested where certification would matter most and when.
KEY FINDINGS
  1. Roughly 61% of the client's installed screening base sat in jurisdictions moving toward direct enforcement, which meant those sites would be replaced by certified competitors rather than renewed with the client.
  2. Accredited calibration on the existing installed base was worth more annually than the client's entire new installation margin, and it required accreditation rather than any manufacturing investment at all.
  3. Certification in three additional jurisdictions would take 30 months each but could run in parallel, and the cost was modest against the installed base it would protect from replacement.
  4. Bridge instrumentation offered genuine growth but served screening and structural monitoring budgets rather than the enforcement money carrying the real pricing premium.
CLIENT PROFILE
A European supplier of weigh-in-motion systems with annual revenue near $62 million (client-reported, unverified by MMA), roughly 84% of it from screening-grade installations sold into competitive road authority tenders across nine countries. The business held solid sensing and integration capability but legal metrology approval in only one jurisdiction, and it provided no calibration service across its own installed base at all.
STRATEGIC CHALLENGE
Direct enforcement adoption was converting the client's screening installations into candidates for certified replacement by competitors who held approvals it did not. Margins on screening work had compressed as specifications became comparable across bidders. Management needed to decide between pursuing certification in additional jurisdictions, building accredited calibration capability, or repositioning toward bridge instrumentation where no certification applied.
MMA APPROACH
MMA mapped legal metrology approval requirements and timelines across eleven European jurisdictions, quantified the client's installed base facing certified replacement, and modelled calibration and data service revenue against the deployed lanes it already held. Twenty expert interviews with road authority engineers, metrology officials and enforcement agencies tested where certification would matter most and when.
KEY FINDINGS
  1. Roughly 61% of the client's installed screening base sat in jurisdictions moving toward direct enforcement, which meant those sites would be replaced by certified competitors rather than renewed with the client.
  2. Accredited calibration on the existing installed base was worth more annually than the client's entire new installation margin, and it required accreditation rather than any manufacturing investment at all.
  3. Certification in three additional jurisdictions would take 30 months each but could run in parallel, and the cost was modest against the installed base it would protect from replacement.
  4. Bridge instrumentation offered genuine growth but served screening and structural monitoring budgets rather than the enforcement money carrying the real pricing premium.
RECOMMENDED STRATEGY
Phase 1: Phase one: obtain accredited calibration capability immediately, capturing service revenue on the existing installed base while certification work proceeds in parallel. Phase 2: Phase two: pursue legal metrology certification in the three jurisdictions where the largest share of installed screening base faces enforcement conversion. Phase 3: Phase three: develop bridge instrumentation as a complementary offer for structural monitoring budgets rather than as a substitute for certification work.
OUTCOME
The client achieved calibration accreditation within nine months and reported service revenue of $11 million in the first full year (client-reported, unverified by MMA). Certification in the first target jurisdiction completed on schedule, blended gross margin improved by roughly eight points, and the business has since retained two installations that had been scheduled for competitive replacement.

Frequently Asked Questions

Foundational context covering the market sizes, CAGR, scope, country, region and competition that inform every finding below. This section is provided to cover basics and most often pre-purchase conversations, answered from the MMA Primary Research Dataset.

What is the current size of the Weigh-In-Motion System Market?

The global weigh-in-motion system market was valued at $0.90 billion in 2025, reaching an estimated $0.98 billion in 2026. That covers sensors, roadside electronics, enforcement software and data platforms across all applications.

How large will the Weigh-In-Motion System Market be by 2036?

MMA forecasts the market reaching $2.28 billion by 2036, an increase of $1.30 billion over the 2026 base. That represents an expansion multiple of 2.32 times across the forecast period.

What is the CAGR for the Weigh-In-Motion System Market 2026 to 2036?

The base case compound annual growth rate is 8.8%, with a bull case of 10.0% and a bear case of 7.6%. Historical growth between 2020 and 2025 ran at 7.4% annually.

Which segment is growing fastest?

Quartz piezoelectric strip sensor systems grow at 13.2%, a full 1.50 times the market rate, on the temperature stability certification requires. Fibre-optic and bridge systems follow at 10.6% annually.

Who are the major companies in the Weigh-In-Motion System Market?

Kistler Group, International Road Dynamics, Q-Free, Kapsch TrafficCom and TE Connectivity lead on installed lane deployment. Together they account for roughly 42% of global installations across all grades.

Which country is growing fastest?

India grows fastest at 11.6% annually, driven by national highway deployment charging overloaded vehicles directly at toll plazas. Vietnam and Saudi Arabia follow on corridor infrastructure programmes.

Report Segmentation Architecture

The full report scope spans multiple orthogonal segmentation dimensions, with cross-tabulated demand data provided for each dimension pair. Coverage extends further to regional breakdowns, trend trajectories, and the competitive detail needed to support segment-level decision-making.

By Sensor Technology

  • Quartz Piezoelectric Strip Sensor System
  • Fibre-Optic and Bridge Weigh-In-Motion System
  • Bending Plate System
  • Load Cell System
  • Ceramic and Polymer Piezoelectric System

By End-Use Industry

  • National Highway Authorities
  • Municipal and Provincial Road Agencies
  • Toll Road Concessionaires
  • Enforcement and Transport Police
  • Port, Mine and Industrial Site Operators
  • Bridge and Structural Asset Owners

By Commercial Dimension

  • Competitive Authority Tender Supply
  • Concession and Public Private Partnership Delivery
  • Calibration and Accredited Service Contracts
  • Data and Analytics Subscription Services
  • System Integrator Channel Supply

By Region

  • North America
  • Western Europe
  • East Asia
  • South Asia and Pacific
  • Latin America
  • Middle East and Africa
  • Eastern Europe

Scope, Methodology, and Coverage

Every figure in this report is reproducible from documented input assumptions. The scope below maps the historical period, the forecast horizon, the segmentation dimensions, and the countries covered, alongside the underlying primary and qualitative methodology.
Historical Period
2020 to 2025
Forecast Period
2026 to 2036
Base Year
2025 (USD billions; MMA Primary Research Dataset, August 2026)
Market Definition
This report covers weigh-in-motion systems measuring vehicle and axle weight at operating speed, spanning quartz and ceramic piezoelectric sensors, bending plates, load cells, fibre-optic and bridge-based sensing, together with roadside electronics, enforcement software, calibration services and data platforms, across highway, toll plaza, weigh station, bridge protection, port and industrial site applications. Static weighbridges, onboard vehicle weighing systems, portable wheel load scales, general traffic counting equipment and pavement construction works are excluded from the sizing.
Quantitative Units
USD billions at supplier realised value; instrumented lanes in thousands; average deployment cost in USD per instrumented lane.
Segmentation Dimensions
By sensor technology; by end-use industry; by commercial dimension; by region.
Regions Covered
North America, Western Europe, East Asia, South Asia and Pacific, Latin America, Middle East and Africa, Eastern Europe
Countries Covered
China, Japan, South Korea, India, Indonesia, Vietnam, Australia, Germany, France, Netherlands, Switzerland, Spain, United Kingdom, United States, Canada, Mexico, Brazil, Saudi Arabia, South Africa, Poland.
Key Companies Profiled
Kistler Group, International Road Dynamics, Q-Free, Kapsch TrafficCom, TE Connectivity, Intercomp, Cross Zlin, Sterela, Traffic Data Systems, Sensys Gatso Group, Mettler-Toledo, Beijing Wanji Technology, Toledo do Brasil and others.
Quantitative Methodology
Primary survey, n=3,800 respondents, Q4 2025, six countries; demand-side model with trade association cross-validation
Qualitative Methodology
47 expert interviews, Q4 2025; applied to validate demand model assumptions, identify emerging dynamics, and assess competitive positioning
Report Format
PDF and XLSX data workbook (Word format preview document)
Publisher
Market Minds Advisory
Report Code
MMA-2026-TEC-033
Published
August 2026
Contact
sales@marketmindsadvisory.com | www.marketmindsadvisory.com

Purchase the full Weigh-In-Motion System Market Report (2026 to 2036).

The full report sizes the weigh-in-motion market across five sensor technologies, six end-use industries and seven regions, with instrumented lane and pricing detail behind every value estimate. It profiles twenty global suppliers on legal metrology certification breadth, calibration accreditation and data service conversion progress. Regional chapters cover enforcement frameworks, approval regimes and infrastructure funding by market. Certification analysis maps approval requirements and timelines across major jurisdictions adopting direct enforcement. Economic analysis quantifies pavement damage avoidance against enforcement revenue as the two competing justifications authorities use for investment.
Instrumented lane and pricing detail by sensor technology
Legal metrology approval mapping across major jurisdictions
Direct enforcement adoption forecasts through 2036
Pavement damage avoidance economics by axle loading
Competitive position assessments across twenty global suppliers
Calibration and data service revenue benchmarking

Built For The People Who Decide

From boardroom strategy to bench-side execution, this report is read cover-to-cover by leaders shaping the next decade of their industry, turning demand scenarios, market dynamics and valuation benchmarks into decisions.
CXOs/ Presidents/ VPs/ Managers
M&A and Corporate Development
Strategy Teams and R&D Heads
Procurement and Product Directors
Regulatory and Compliance Leaders
Investor Relations and Equity Analysts