

Twelve PracticesOne standard of evidence
Each of our practices is led by a partner who has spent the better part of a career inside the discipline they now advise on. The work is run by the people who built the methods not handed down. Below is what we do, how we do it, and what changes when we walk in the door.
FROM THE LEAD ANALYST
“We segment by polymer family and margin tier, not by HS code because that's how producers actually allocate capex.”
Chemicals & Materials Desk · MMA Research Council
The work, at a glance
Twelve practices, designed to be hired alone or stacked. Most engagements draw on two or three. The biggest decisions usually pull from all of them.
Market Sizing & Forecasting
TAM, SAM, SOM and ten-year build-ups your CFO will defend.
Competitive Intelligence
A clear-eyed read on who is winning, where, and why.
M&A Advisory
Target screens, synergy maps, and post-deal value plans.
Voice of Customer
What your buyers actually want, said in their own words.
Pricing Strategy
Elasticity, willingness-to-pay, and the price you should be charging.
Go-to-Market Strategy
Where to play, how to enter, who to partner with, what to spend.
Commercial Due Diligence
Independent diligence for boards and investors, on the clock.
Sustainability & ESG
Decarbonization pathways, ESG diligence, climate scenarios.
Regulatory Affairs
Policy mapping, scenario planning, and a quieter compliance horizon.
Technology Scouting
Patent landscapes, white-space discovery, partnership pipelines.
Operations & Supply Chain
Footprint, sourcing, resilience, and where the next disruption sits.
Innovation Strategy
A portfolio of bets sized, sequenced, and ready to defend.
When the decision is large
the evidence has to be larger
Every practice runs on the same engine primary research, partner-led analysis, models we will defend in any room. The result is a body of work that boards approve on the first pass, and operators put into motion the same week.
Repeat Engagement
81%
Clients who return within twelve months for a second project.
Board-Approved
94%
Of MMA recommendations approved on the first board reading.
Median Tenure
7+ Yrs
Of partner experience inside the industry they now advise on.
Time-to-First-Read
48 hrs
From initial call to a working hypothesis on the table.
A number your CFO willdefend in the boardroom
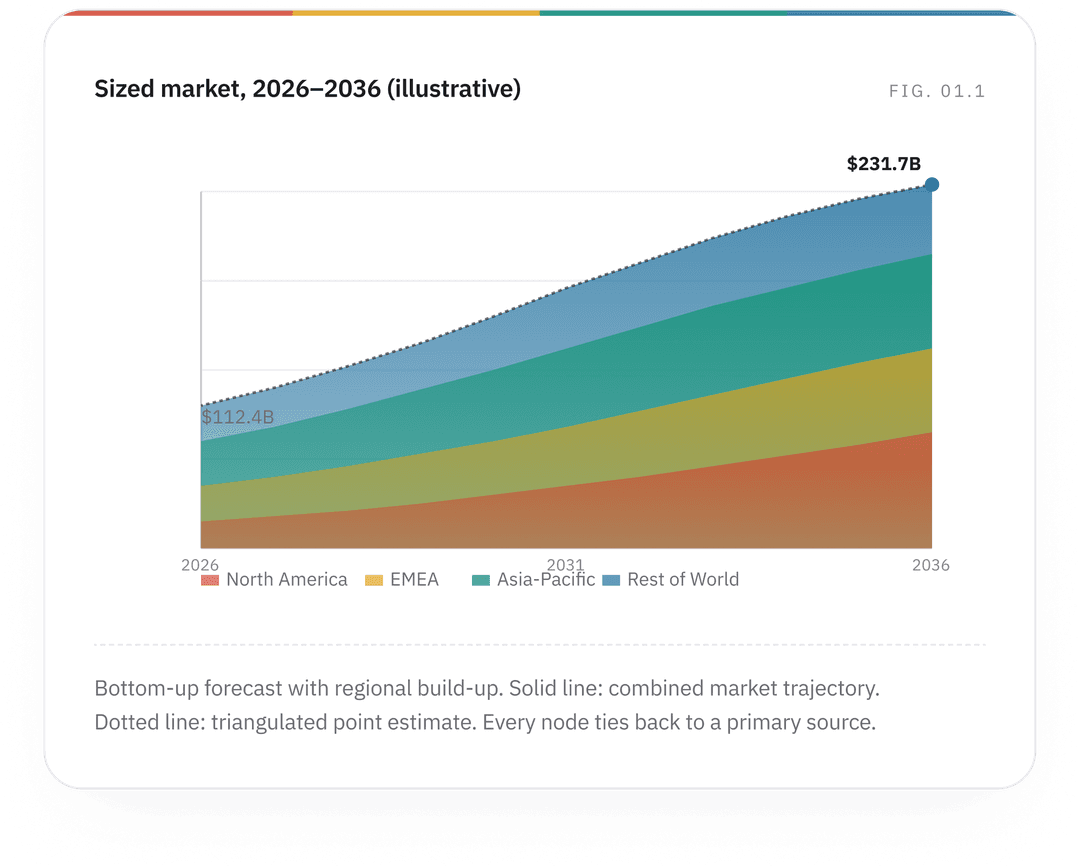
A market number is only as good as the build-up behind it. Ours starts at the customer, climbs through segments and geographies, and lands at a forecast our clients can put in their next plan with confidence.
Most market numbers in circulation today are repackaged from somewhere else, with a tidy CAGR pasted on the front. That kind of figure works for a press release. It does not survive a serious capital decision.
We build every market estimate from the bottom up. We start by speaking with customers and counting the units they actually buy. We layer in capacity from manufacturers, channel inventories, and our own panel data. Where the numbers disagree, we surface the disagreement and walk the client through which method we trust and why.
The result is a figure with three independent triangulation points, a defensible CAGR, and a clear view of the assumptions that move the answer most. When the question changes, the model adjusts. The work earns its place in your plan.
What you get
Bottom-up TAM, SAM, and SOM with a full audit trail of every assumption
Ten-year forecasts at segment, sub-segment, and country level
Three-method triangulation (demand, supply, and channel)
A scenario model so leadership can stress-test the answer in five minutes
An update cadence quarterly or annually so the number never goes stale
±3.4%
Median forecast accuracy, three-year horizon
4–8 Wks
Typical turnaround for a sized market
Typical engagement: 4–8 weeks · Partner-led · Includes a live model your team keeps
HIRE ALONE OR STACK
Who is winning where and why it matters next quarter
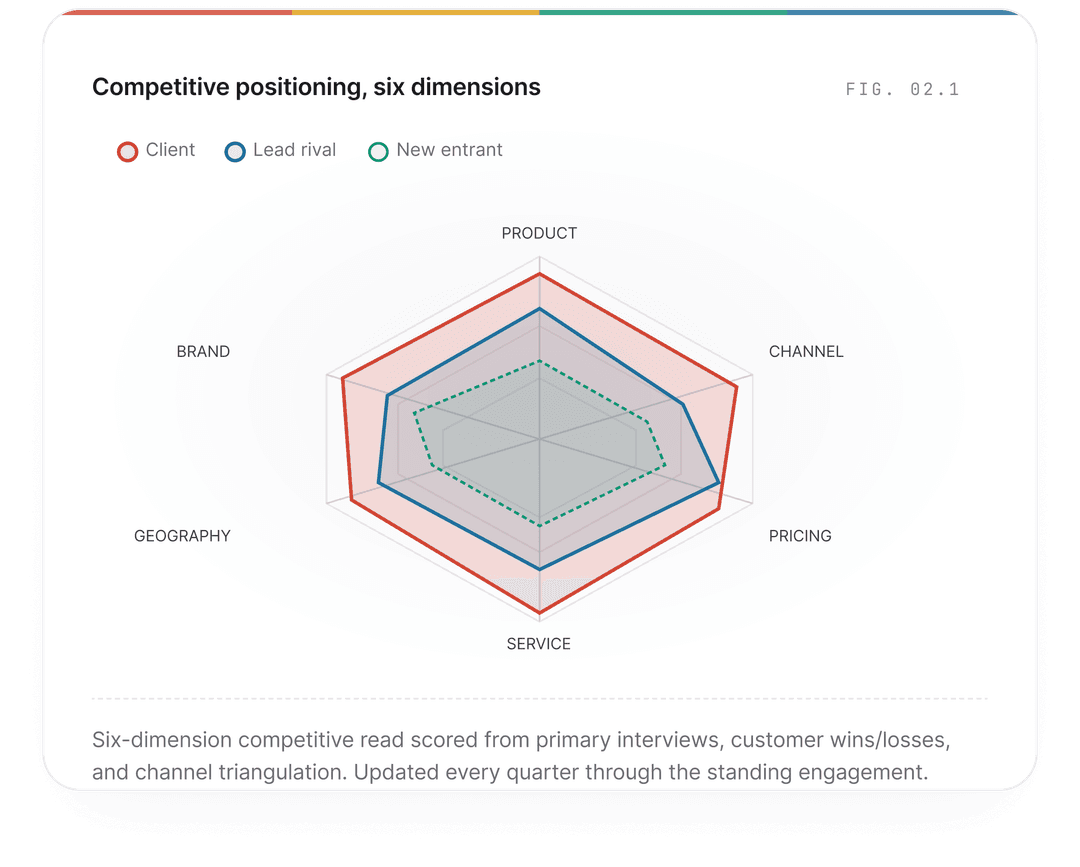
A clear-eyed read on the field your three biggest rivals, the disruptor you have not noticed yet, and the move each of them is most likely to make in the next four quarters.
Competitive intelligence work goes wrong when it stops at the public file. Annual reports tell you what a competitor did last year. They will not tell you what their best engineers are working on this Friday.
Our analysts spend their weeks in the field. We speak with former employees, channel partners, suppliers, and the customers who recently switched. We pair that with our own panel of buyers and a continuously updated patent and hiring database. The picture we build is current within four weeks.
You leave the engagement with a quarterly read on every meaningful rival, a clear view of where the field is tightening, and an early signal on the one or two moves that could change the slope of your year.
What you get
Competitor profiles refreshed every quarter, not every annual report
Win/loss analysis from buyers who recently chose you or chose against you
Early-signal monitoring: hiring, patents, leadership moves, channel chatter
Battlecards your sales team can carry into a call this week
A standing partner who picks up the phone when something changes
~120
Channel and ex-employee touchpoints per study
4 wks
Refresh cadence on every tracked competitor
Typical engagement: Standing quarterly retainer or 6-week one-off · Quarterly partner check-in included
Best run as standing
The target listbuilt around your thesisnot a banker's pipeline
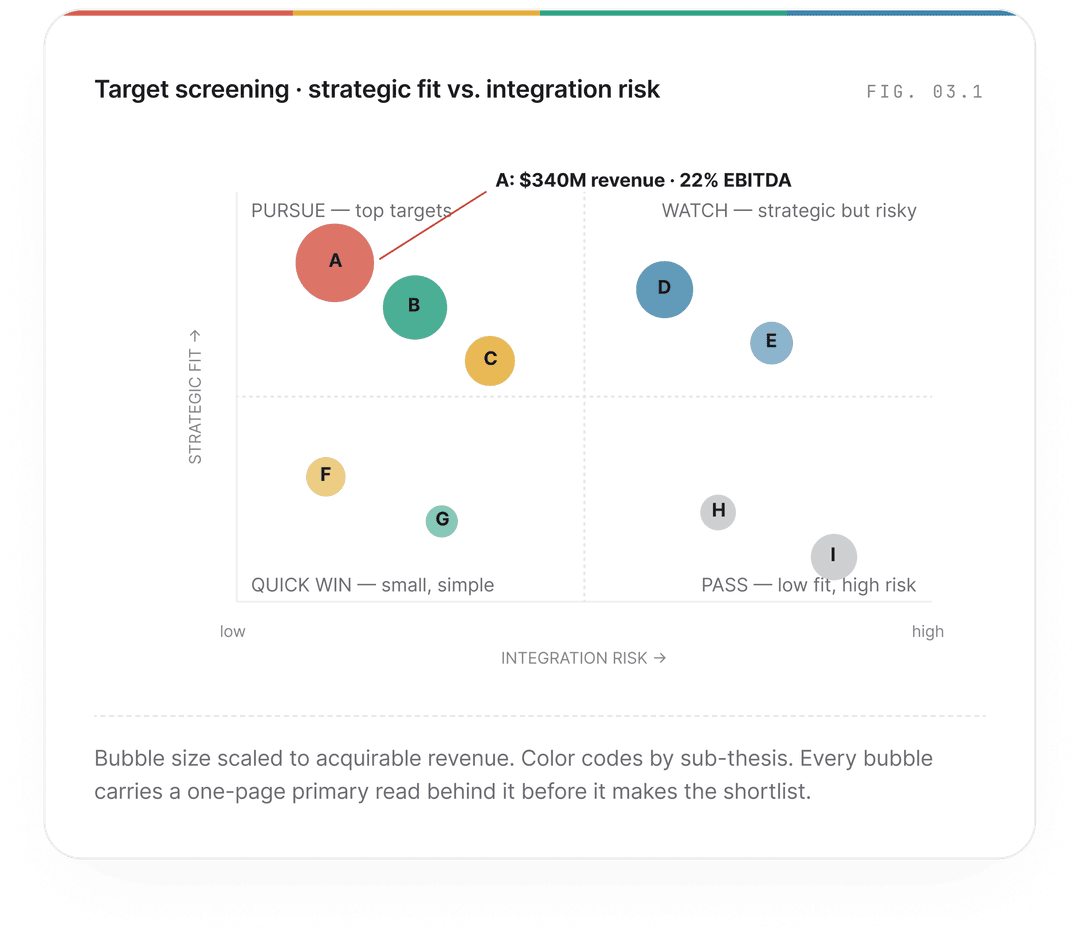
From thematic screens through synergy modelling and post-close value capture, independent diligence for boards, sponsors, and operators who want the substance, not the show.
The deals that compound are almost never the ones that arrive on a Tuesday afternoon from a banker. They are sourced thematically, modelled with a clear-eyed view of synergies, and pursued with the discipline to walk away.
We work on both sides of the table. For corporates, we run thematic screens of one to two hundred candidates, narrow to a defensible short list, and stay close through diligence and integration. For sponsors, we deliver commercial diligence that survives the investment committee and the next one.
Our work is partner-led from day one. Most of our M&A clients retain us for the year after the deal closes, because that is when the model meets the operating reality, and that is when an independent set of eyes matters most.
What you get
Thematic target screens of 100–200 candidates, narrowed to a defensible shortlist
Commercial diligence pack with primary customer references
Synergy modelling, scenario-tested across base, upside, and downside
Post-close 100-day plan with clear ownership and weekly milestones
Year-one operating review with the board, against the original deal model
$11.2B
Deal value advised on in the last twenty-four months
73%
Of clients retain MMA post-close for year-one operating review
Typical engagement Thematic screens 6–10 weeks · Commercial DD 3–5 weeks · Post-close year retained
Both sides of the table
What your buyers said in actually want their own words
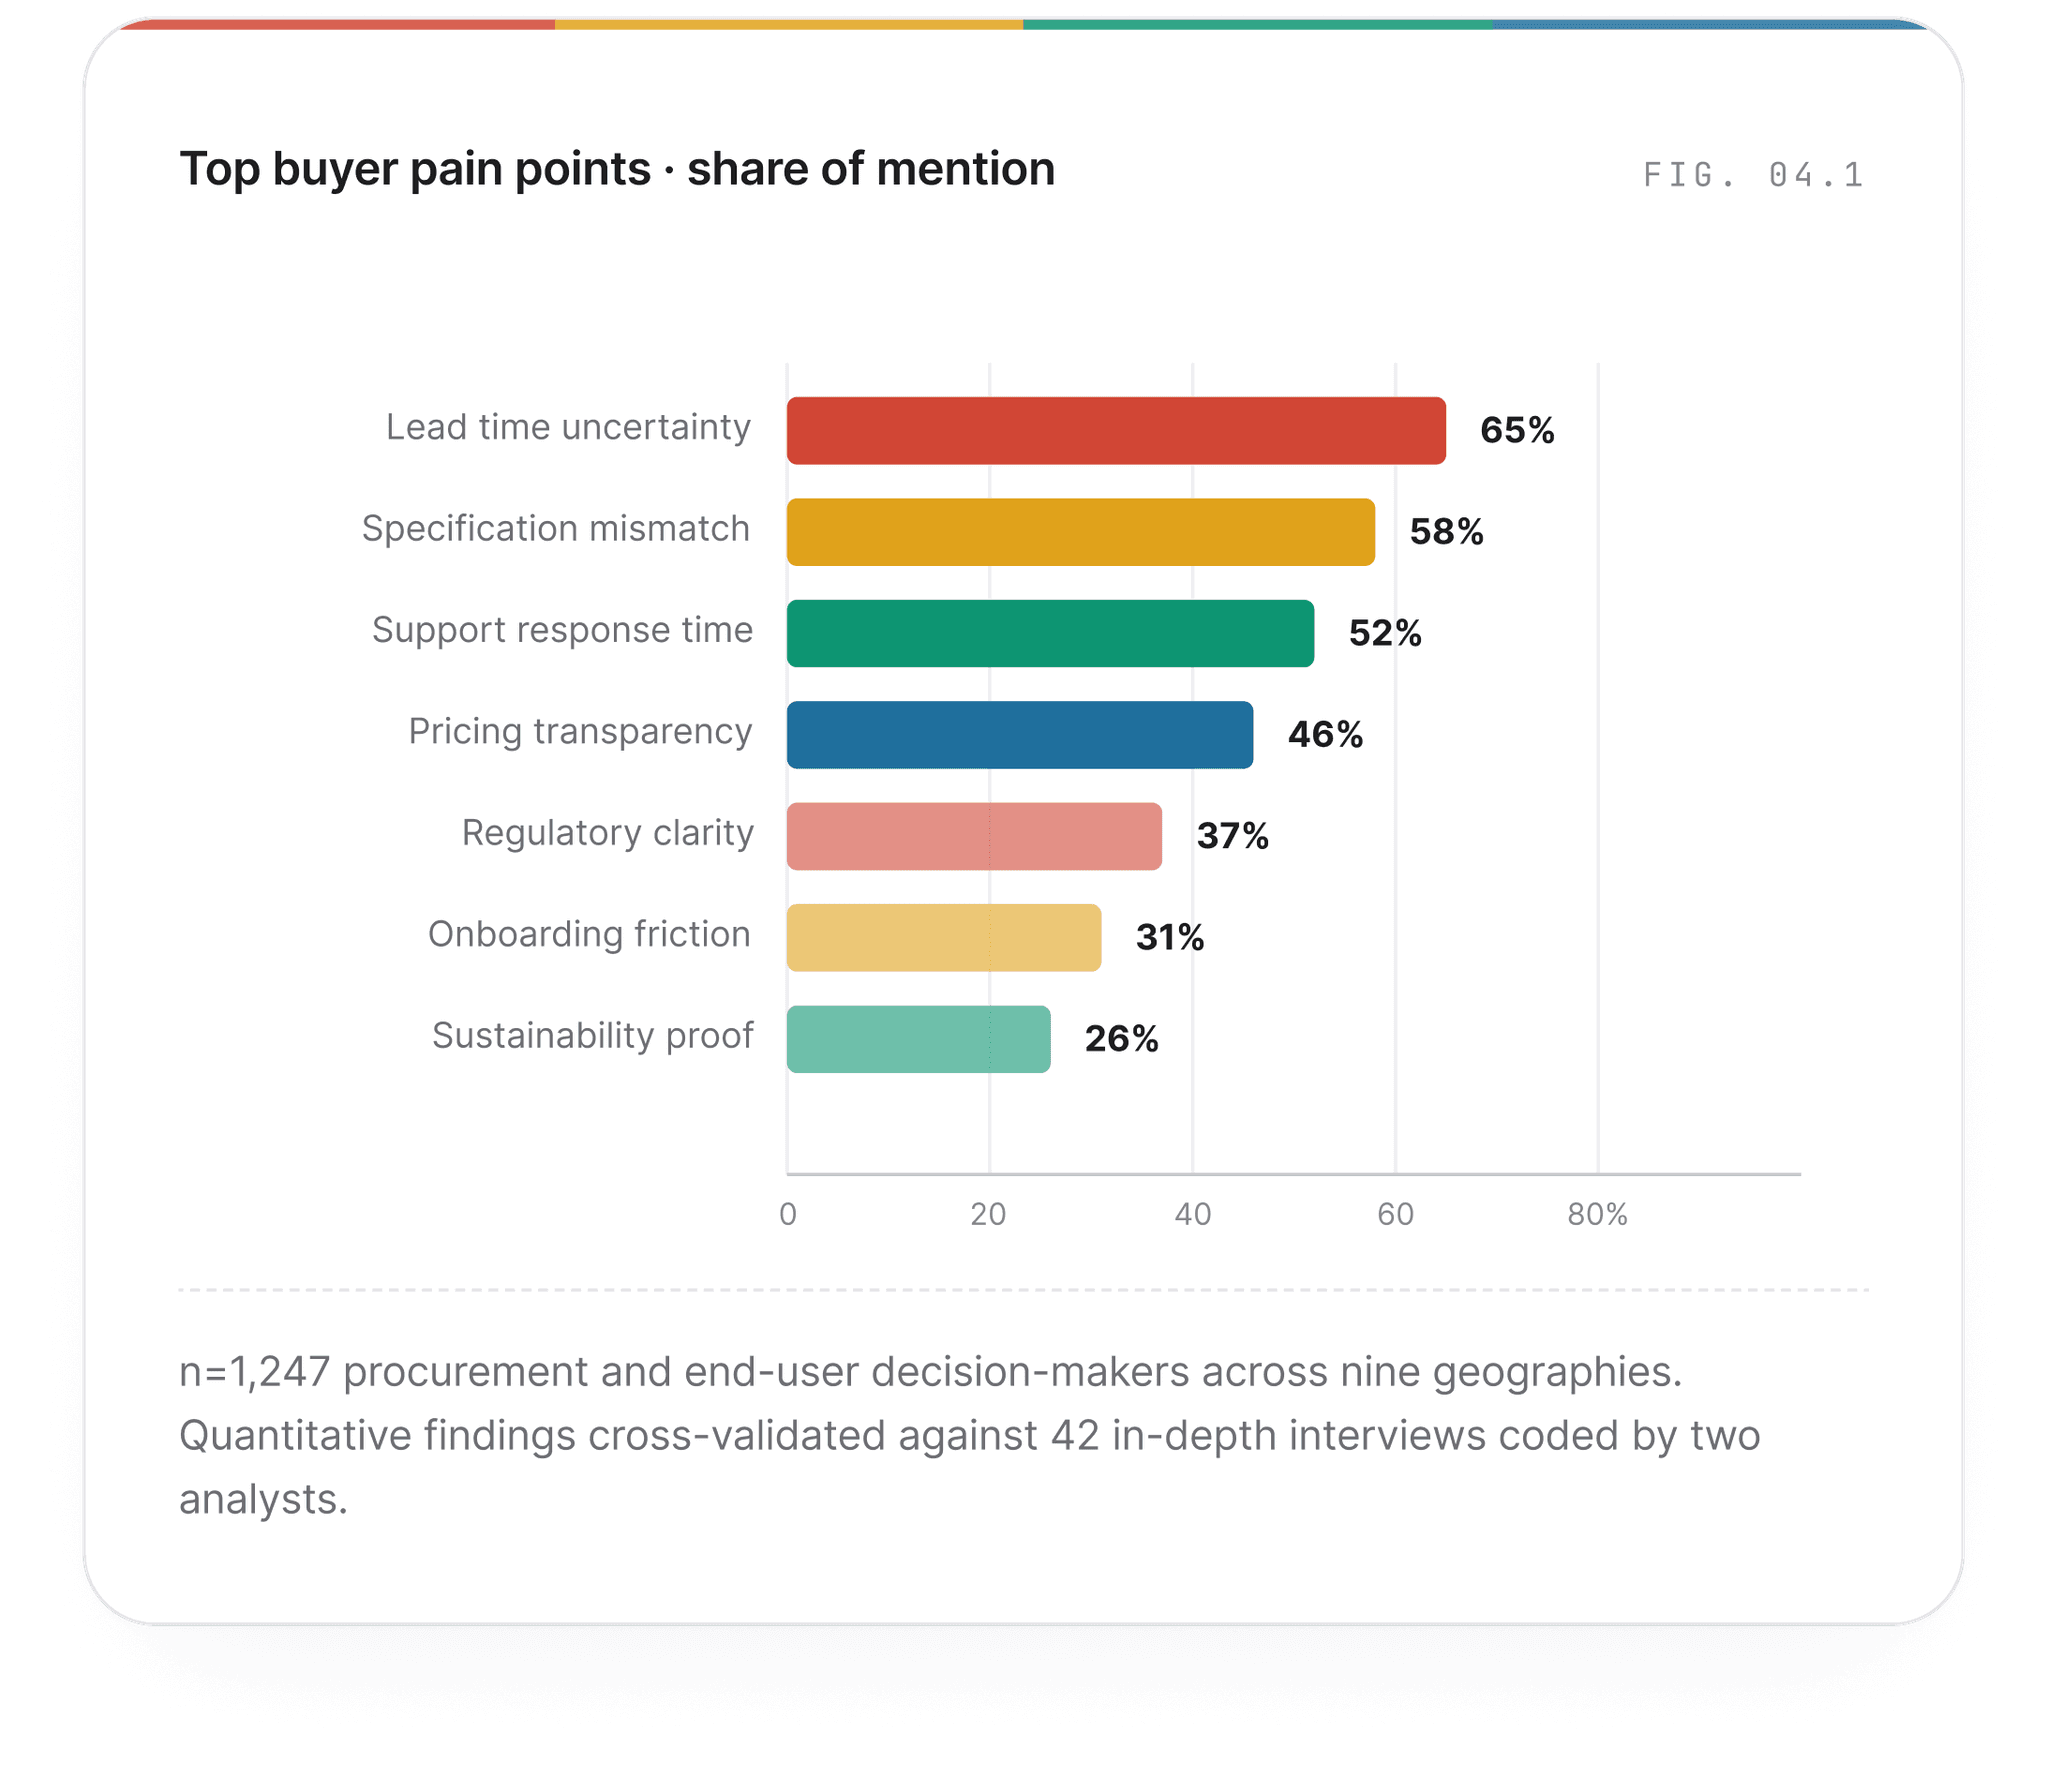
Surveys at the scale of a thousand. Conversations at the depth of an hour. The two stitched together so the numbers and the narrative both tell the same story.
Competitive intelligence work goes wrong when it stops at the public file. Annual reports tell you what a competitor did last year. They will not tell you what their best engineers are working on this Friday.
Our analysts spend their weeks in the field. We speak with former employees, channel partners, suppliers, and the customers who recently switched. We pair that with our own panel of buyers and a continuously updated patent and hiring database. The picture we build is current within four weeks.
You leave the engagement with a quarterly read on every meaningful, clear view of where the field is tightening, and an early signal on the one or two moves that could change the slope of your year.
What you get
Bottom-up TAM, SAM, and SOM with a full audit trail of every assumption
Ten-year forecasts at segment, sub-segment, and country level
Three-method triangulation (demand, supply, and channel)
A scenario model so leadership can stress-test the answer in five minutes
An update cadence quarterly or annually so the numbers never go stale
38K
Decision-makers on the MMA panel, refreshed annually
14
Languages of native-language fieldwork
Typical engagement: 8–12 weeks for full study · Standing panel access available · Quarterly read-out
STANDING PANEL OPTIONAL
The price your buyers will payand the one they will quietly resent
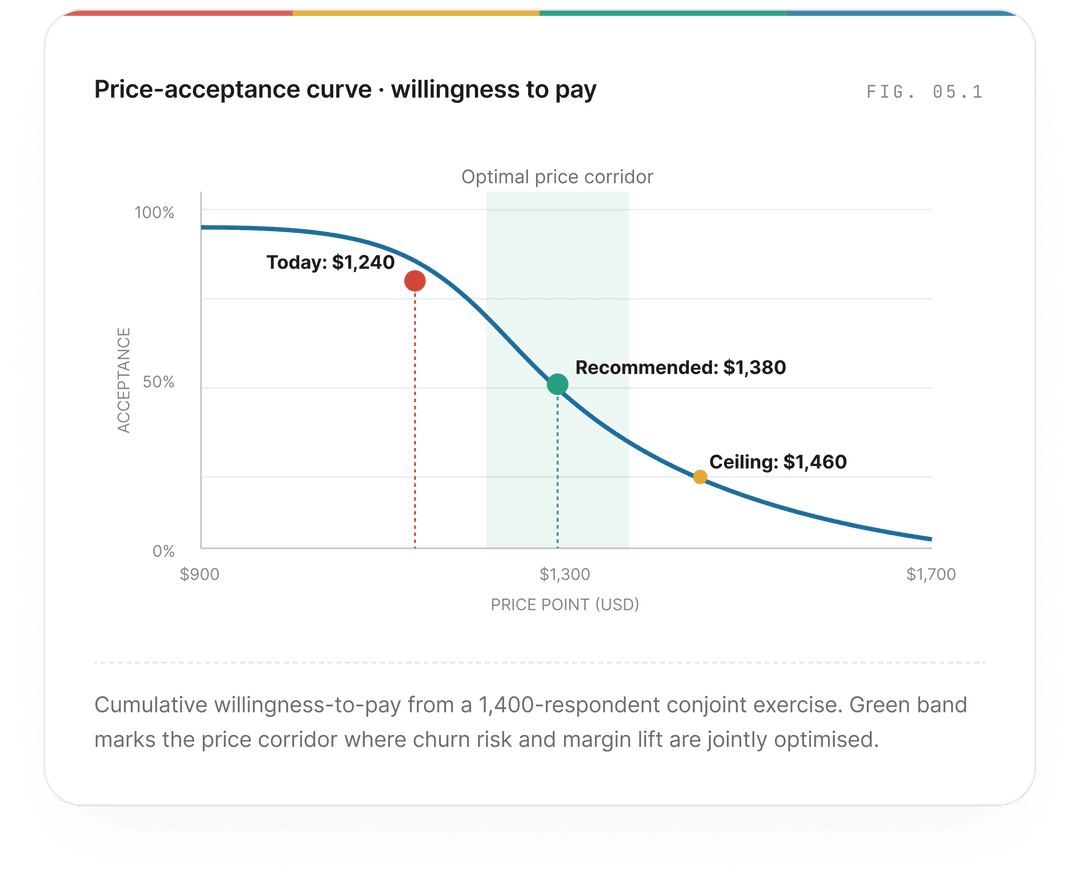
Conjoint, van Westendorp, willingness-to-pay modelling, and price-corridor design the work that turns pricing from an annual exercise into a quarterly margin lever.
Pricing is the single most powerful margin lever in any business and the one most companies still set by feel. A one-percent price improvement, all else equal, drops directly through to operating profit. Most clients we meet are leaving three to seven points on the table.
We build the evidence for a price change the way an econometrician would. We run conjoint exercises to isolate value from list, van Westendorp screens to map buyer sensitivity, and segmentation overlays so the price corridor varies by who is buying, where, and why.
The output is a price book the commercial team can carry into a negotiation tomorrow with floor, ceiling, and walk-away points by segment, plus the talking points that defend the change to a buyer's procurement team.
What you get
Conjoint and van Westendorp studies sized to your segments
Price elasticity curves and willingness-to-pay distributions
Segment-by-segment price corridor with floor, list, and ceiling
Commercial playbook for the sales team: language, defences, walk-away
A live dashboard so you can run the next price test in three weeks, not three quarters
+340bps
Median gross-margin lift across MMA pricing engagements
7%
Average list price increase absorbed with single-digit churn
Typical engagement: 6–10 weeks for full pricing study · Quarterly refresh available · Includes commercial enablement
MARGIN IN 90 DAYS
Where to play how to enterand how much it actually costs
From entry economics through channel design and sales-force coverage the practical work of turning a strategy deck into a quarter-by-quarter operating plan.
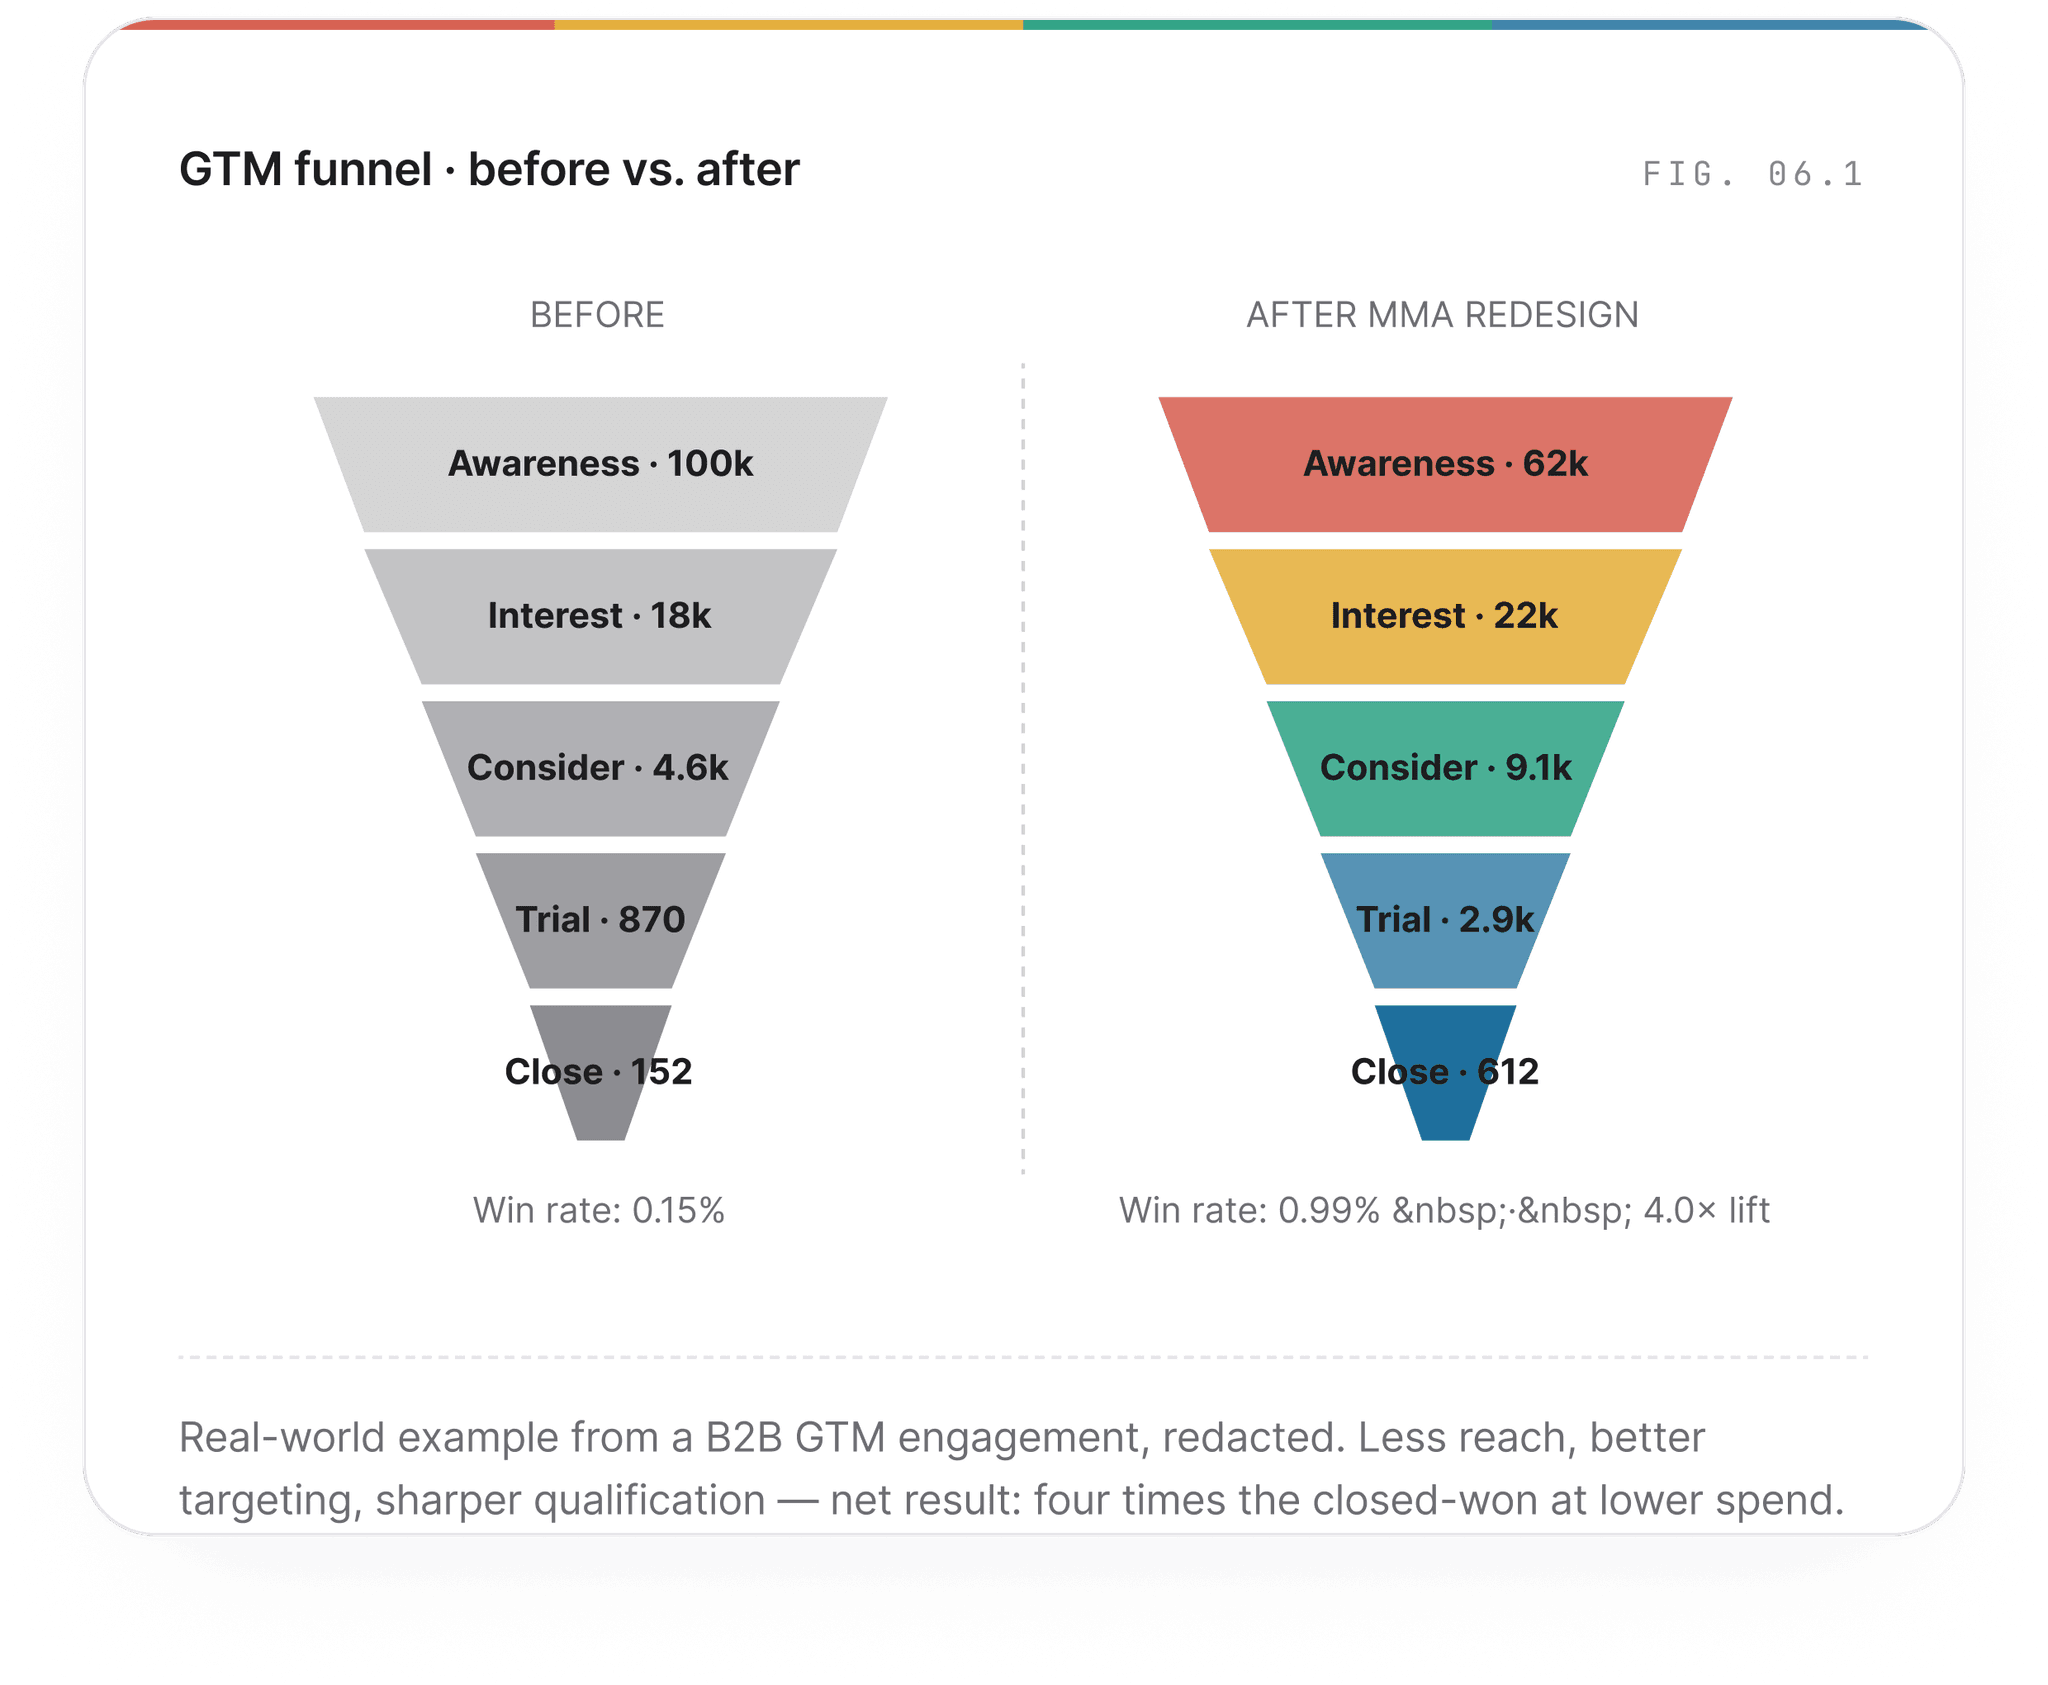
A go-to-market strategy that does not survive a contact with the commercial team is not a strategy. It is a slide. We do not produce slides.
Our go-to-market work is built around the operating cadence the client already runs. We size the addressable opportunity, identify the segments where momentum is genuine rather than imagined, design the channel mix, and model the cost-to-serve for each path. We then write the quarter-one through quarter-four operating plan with the commercial team in the room.
The work earns its keep because the people who will execute it helped build it. Our clients deploy our recommendations because they do not feel handed-down. They feel like a sharpened version of what the team had been arguing about for a year.
What you get
Segment prioritisation with addressable-opportunity sizing
Channel mix and partner shortlist with first-call references
Sales coverage model territories, quotas, comp, ramp
Cost-to-serve modelling by channel and segment
Quarter-one through quarter-four operating plan, with milestones and owners
2.3×
Median pipeline lift in the first four quarters post-deployment
~40%
Reduction in cost-per-qualified-opportunity in target segments
Typical engagement: 10–14 weeks · Designed with the commercial team, not handed to them
BUILT TO BE EXECUTED
The diligence packthat survives the investment committee
Independent commercial diligence for private equity, venture growth, and corporate development partner-led, on the clock, and tested against the questions an IC will actually ask.
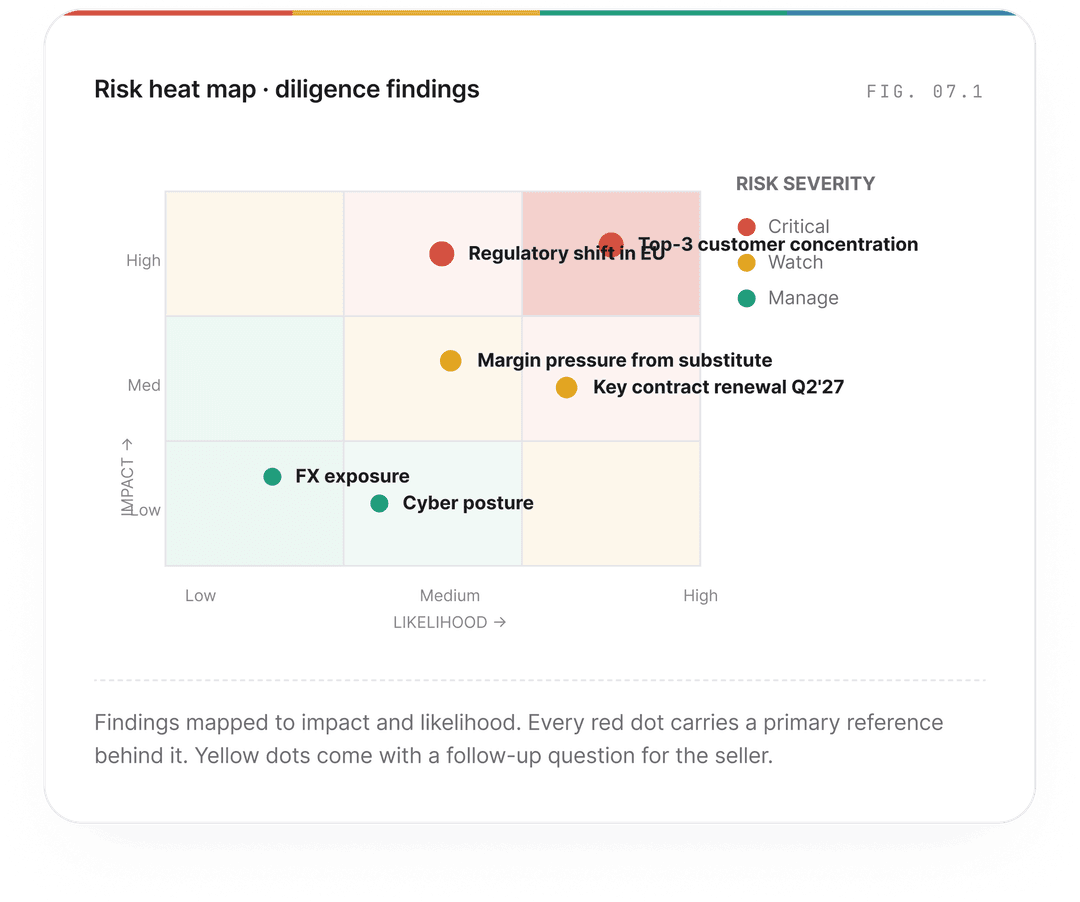
A diligence pack has one job: to stand up to the hardest question your investment committee or board will ask, and the harder one nobody is asking yet. The packs that fail in IC are rarely wrong on the headline. They fail because a load-bearing assumption was not interrogated.
We work to a deadline most diligence shops politely refuse. Our process is built around it. Twenty primary customer references in the first ten days. A working hypothesis on the table by day fourteen. Final pack defended live, by day twenty-one earlier if the seller is moving fast.
We have done more than 180 commercial diligence engagements in the last three years, and our clients have closed on the asset in 71% of cases. When we recommend walking away, they walk away.
What you get
20–60 primary customer reference calls in the first two weeks
Independent market size, growth, and segmentation read
Competitive position assessment with channel triangulation
Customer concentration, churn, and unit economics audit
Red-flag log and ten-question follow-up plan for the seller
IC-ready pack defended live by the partner who led the work
180+
Commercial DDs in the last 36 months
21 days
Standard turnaround, faster if the deal demands it
Typical engagement: 14–28 days · Standing relationships with most major PE houses · Partner-defended at IC
ON THE CLOCK
The decarbonization planthat survives the audit and the analyst day
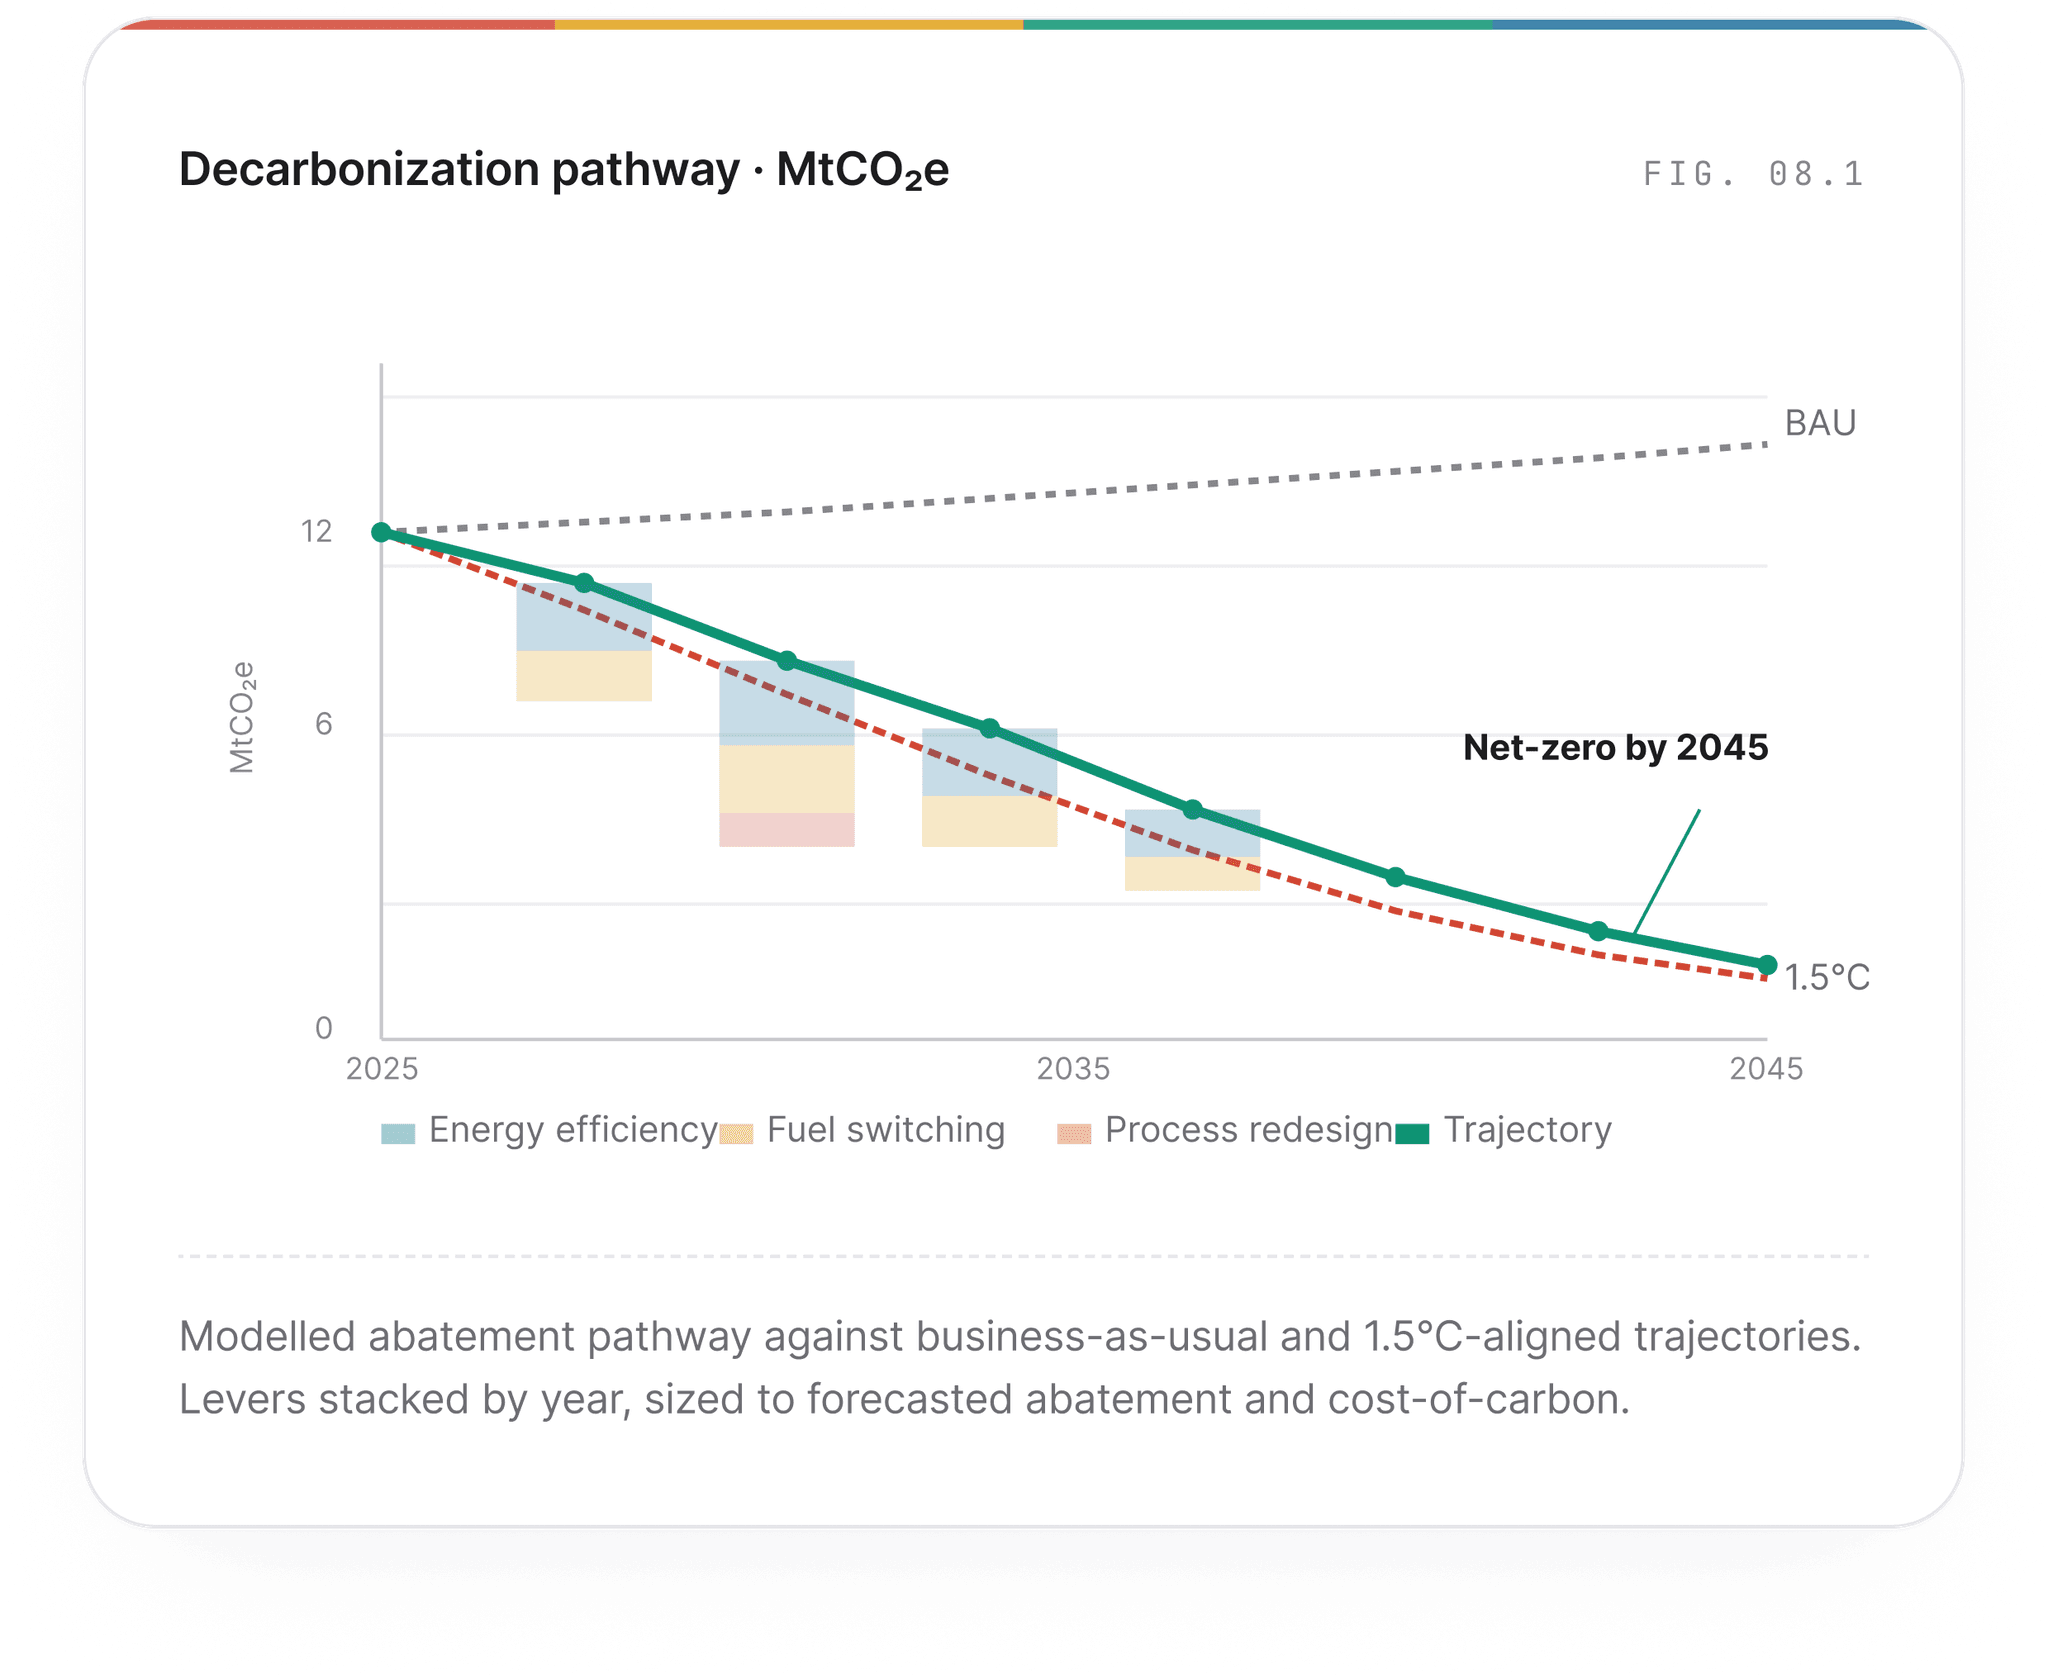
Scope 1, 2, and 3 inventories. Science-based target setting. Climate-scenario modelling and ESG diligence. The work done to the standard your auditors and your investors will both accept.
The era of marketing-led sustainability is over. The disclosures coming through in the next twenty-four months CSRD, the SEC climate rule, the ISSB standards will draw a sharp line between companies whose net-zero claims hold up and those that do not.
We help our clients land on the right side of that line. We build the carbon inventory the way a forensic accountant would. We design the abatement curve with engineering rigour. We model the climate scenarios as your CFO and your insurers will need them. The work is built to be audited.
For sponsors and corporates evaluating an asset, we run ESG diligence to the same standard as our commercial diligence. Material risks surfaced, transition exposure quantified, and a credible decarbonization plan that survives the first hundred days.
What you get
Scope 1, 2, and 3 carbon inventory, audit-ready
Marginal abatement cost (MAC) curve sequenced by payback
Science-based target proposal aligned to 1.5°C or well-below-2°C
Climate-scenario stress test on the five-year financial plan
ESG diligence for M&A transition risk, physical risk, governance
42%
Average abatement potential identified at zero or negative cost
CSRD · SBTi
Disclosure frameworks our deliverables map to natively
Typical engagement: Inventory 4–8 weeks · Pathway design 8–12 weeks · ESG diligence aligned to deal clock
BUILT TO BE AUDITED
Ways to put it to use
Twelve ways to put it to use
Every practice draws on the same evidence engine. Primary research at scale, modelling built in-house, and a partner who owns the answer. The result: numbers our clients put in their plan, recommendations boards approve on the first reading, and a working relationship that compounds.
Annual Interviews
4,800
Conducted by our analysts each year, across functions and seniority.
Panel Refreshed
38K
Verified decision-makers in the MMA panel, refreshed annually.
Countries Reached
90+
National markets where MMA runs native-language fieldwork.
Sectors Covered
17
Industry verticals, each led by a partner with deep operating experience.
The policy horizonmapped before it lands on the desk
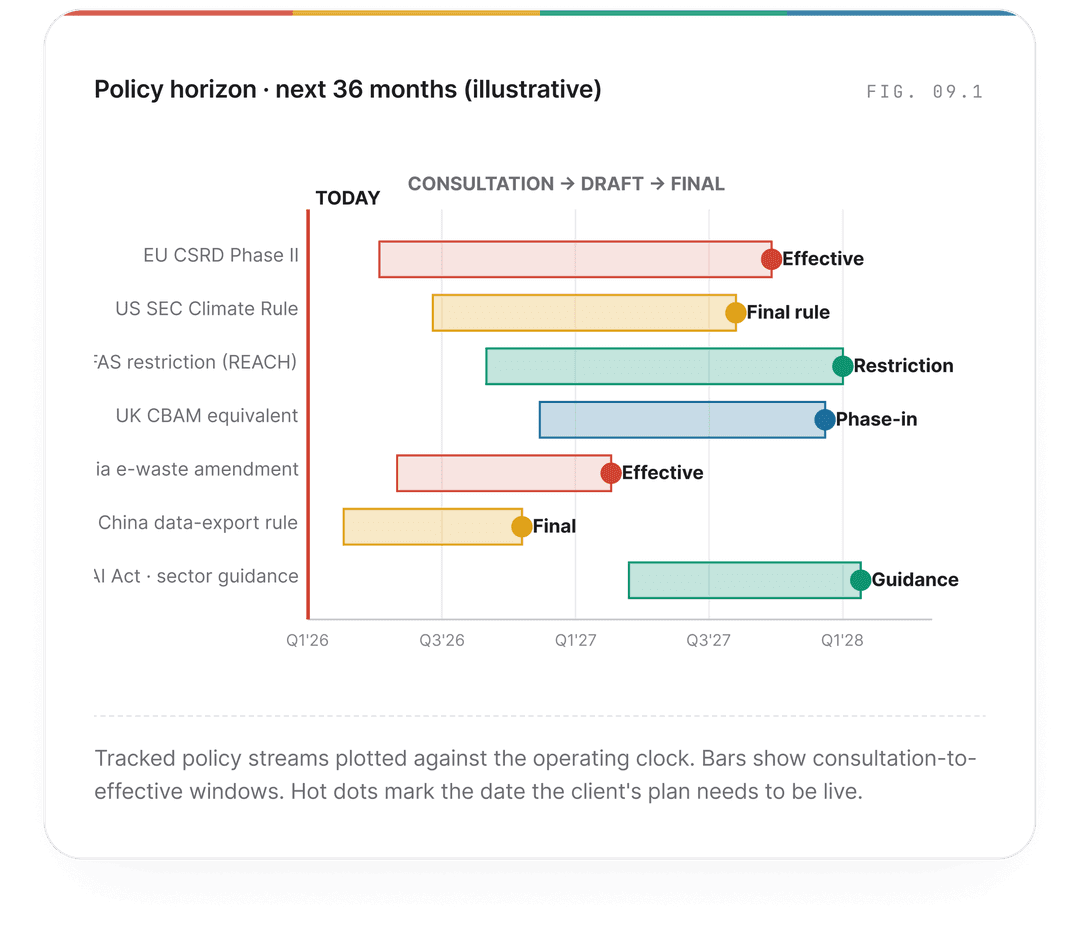
Regulatory scanning, policy scenario modelling, and engagement strategy so leadership sees what is coming twelve to thirty-six months out, not the week the rule is published.
Regulatory change is the most predictable disruption a company faces and the one most often handled at the last minute. Rules do not appear overnight. They go through consultation, draft text, comment, and final publication a process that runs eighteen months on the short side and four years on the long.
Our regulatory practice maps the policy horizon for our clients across every market where they operate. We track the bills, the comment dockets, the agency leadership changes, and the early signal from advisory committees. When a rule lands, our clients have already modelled three scenarios and are working on the implementation plan.
The work includes engagement strategy: who to speak with, what to say, when to file so our clients shape the rules where shaping is still possible. The quieter the compliance horizon ends up being, the better the work was.
What you get
Regulatory horizon map covering 12–36 months across all relevant jurisdictions
Policy scenario modelling with quantified financial and operational impact
Stakeholder map and engagement plan for each material policy stream
Comment letters, position papers, and submission drafting support
Monthly read-out for the GC, head of policy, and CEO
18+ months
Median lead time on policy changes we surface to clients
9
Regulatory jurisdictions tracked actively across the panel
Typical engagement: Standing retainer with monthly read-out · Ad-hoc deep dives on emerging streams · GC and head-of-policy access
BEST RUN AS STANDING
The technology that will resetyour category found while it is still cheap
Patent landscaping, university lab discovery, start-up scouting, and partnership-pipeline design. The white-space work that catches a wave before the rest of the industry has named it.
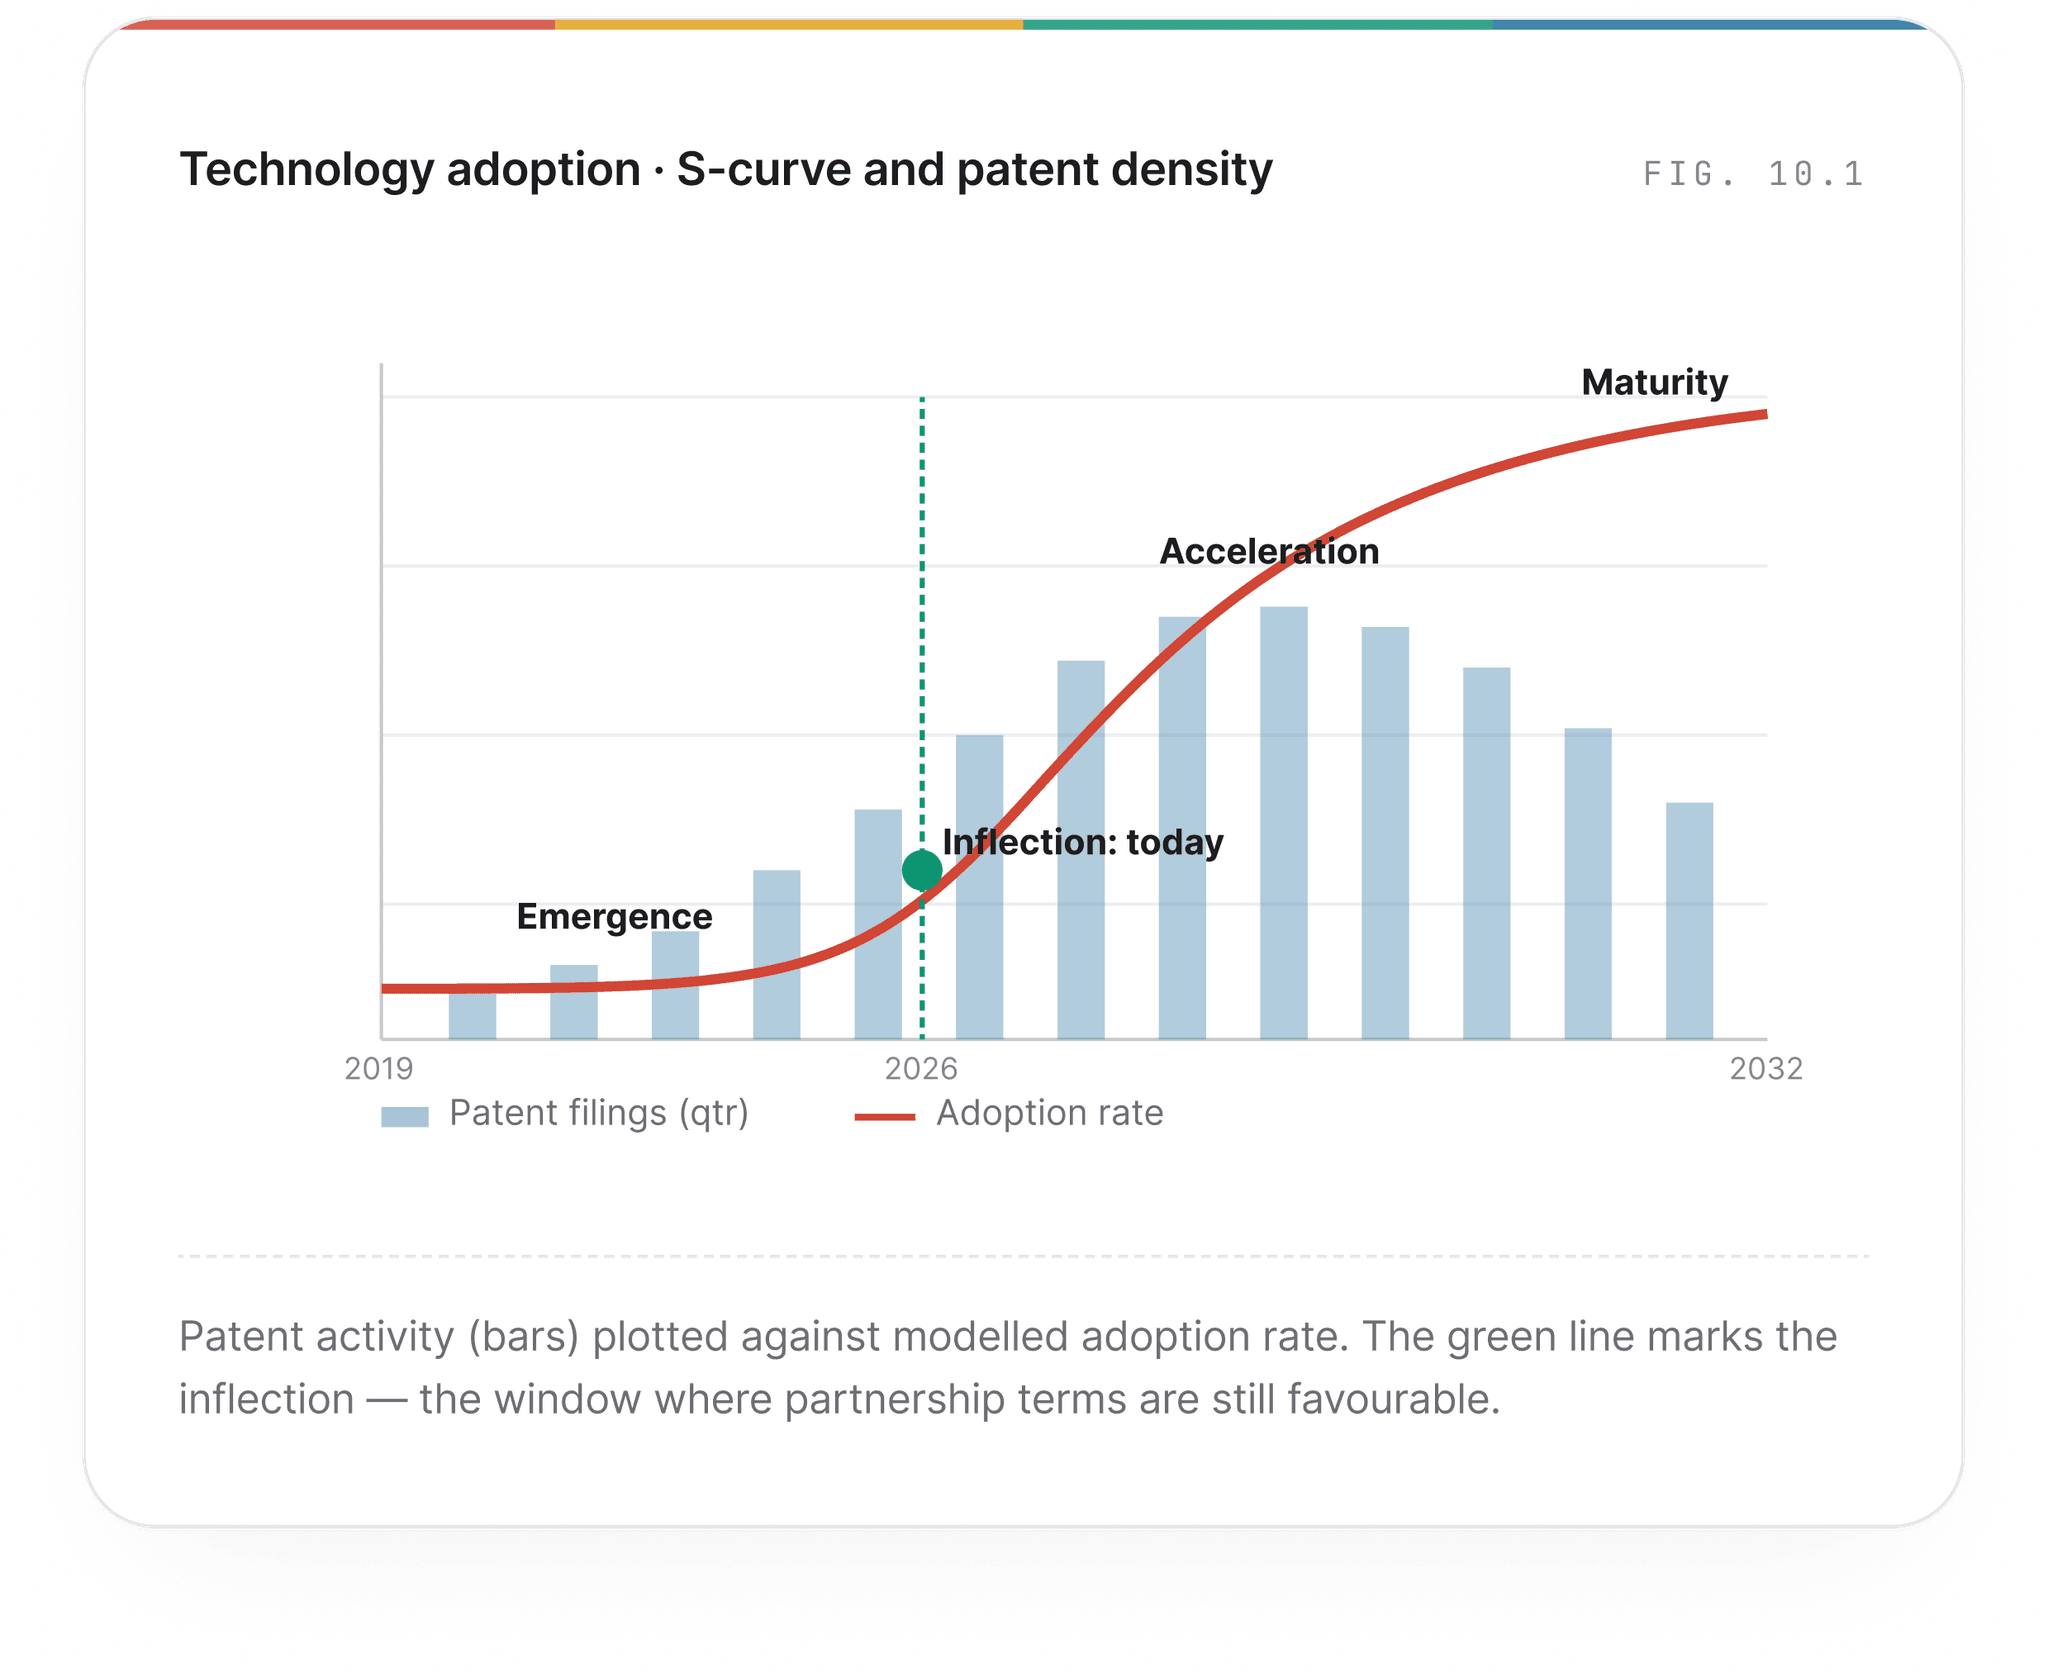
The technologies that reset categories are visible eighteen to thirty-six months before they show up on an earnings call. The signals are in the patent record, in the academic literature, in the start-ups quietly closing a seed round, and in the engineering hires nobody else noticed.
Our technology scouting practice systematises that early-signal work. We run quarterly sweeps of the patent record by sub-segment, mine the relevant academic conferences, profile the start-ups, and produce a partnership pipeline our clients can act on. The work is calibrated to the client's strategic question, not a generic horizon scan.
The output is a shortlist of three to twelve targets per cycle: partnership candidates, license opportunities, or acquisition prospects, each with a primary read on the team, the IP position, and the commercial readiness.
What you get
Quarterly patent landscape with sub-segment trend analysis
Academic and conference monitoring across target domains
Start-up shortlist with founder interviews and IP read
Partnership pipeline ranked by strategic fit and commercial readiness
Licensing and acquisition memo for each priority target
~9,200
Patents reviewed per quarterly cycle across the panel
3–12
Actionable targets surfaced per engagement
Typical engagement: Quarterly retainer with running pipeline · Ad-hoc deep dives on priority targets
STANDING PIPELINE
The footprint, sourcing, and resilience readyour COO will run with on Monday
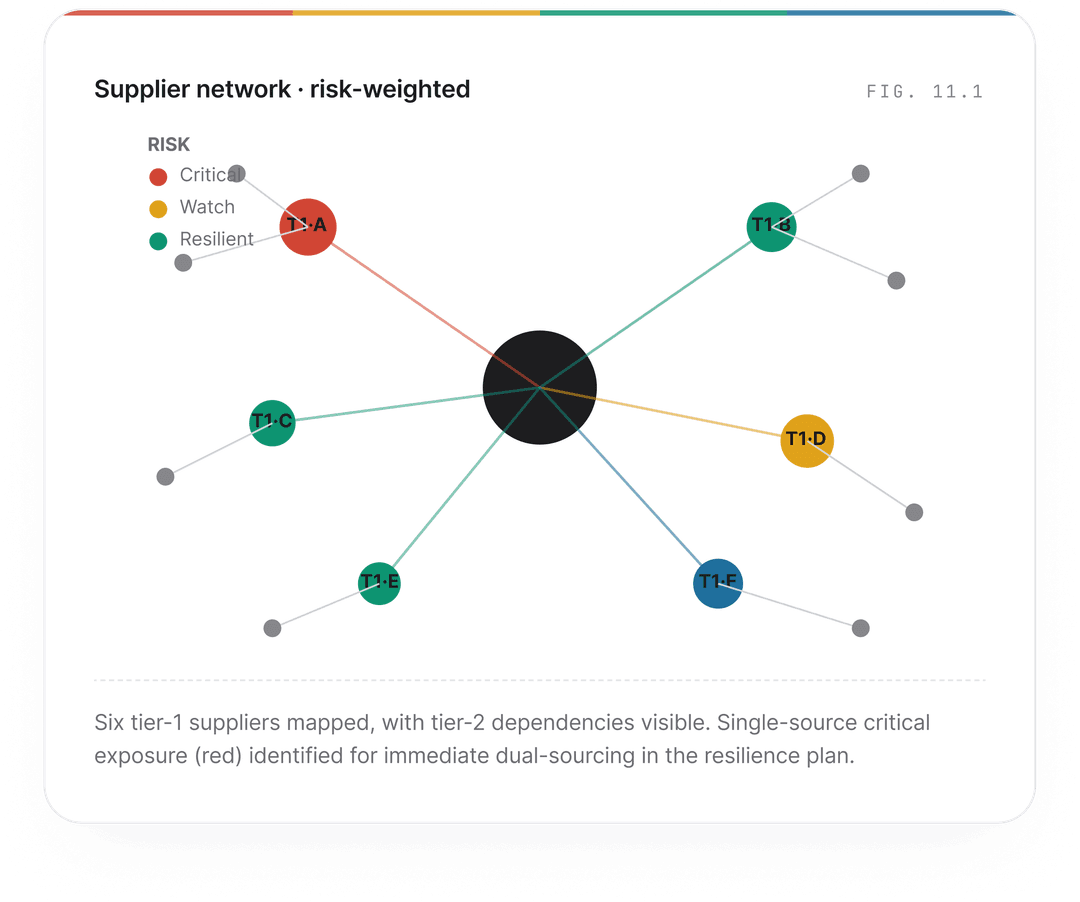
Network design, sourcing strategy, tier-2 and tier-3 mapping, and resilience modelling the operating work behind every credible commercial strategy.
The last five years have made one thing painfully clear: supply chains that look efficient on a spreadsheet can fail spectacularly when the world moves. The companies that came through the recent decade in good shape did not have less exposure. They had better visibility, faster signals, and pre-built playbooks.
Our operations practice builds that visibility for our clients. We map the network down to tier-2 and tier-3 suppliers, model the financial impact of a disruption at every node, and design the sourcing portfolio to absorb the next shock. The work is grounded in primary supplier interviews and our own panel of plant managers.
The deliverable is operational, not academic. A refreshed network design, a sourcing playbook, and a resilience monitor the COO can put on the operating dashboard the day we deliver.
What you get
Network mapping down to tier-2 and tier-3 suppliers
Disruption financial impact model node by node, scenario by scenario
Sourcing strategy with single-source, dual-source, and regional alternatives
Resilience dashboard fed by leading indicators, refreshed monthly
Cost-to-serve and footprint design including reshoring economics
73%
Of mapped clients held service levels through last-cycle shocks
12–18%
Typical landed-cost improvement after sourcing redesign
Typical engagement: 12–16 weeks for full mapping · Monthly resilience monitor as standing service · COO and Head of Supply included
BUILT FOR THE OPERATING CADENCE
The portfolio of betssized, sequenced and ready to defend
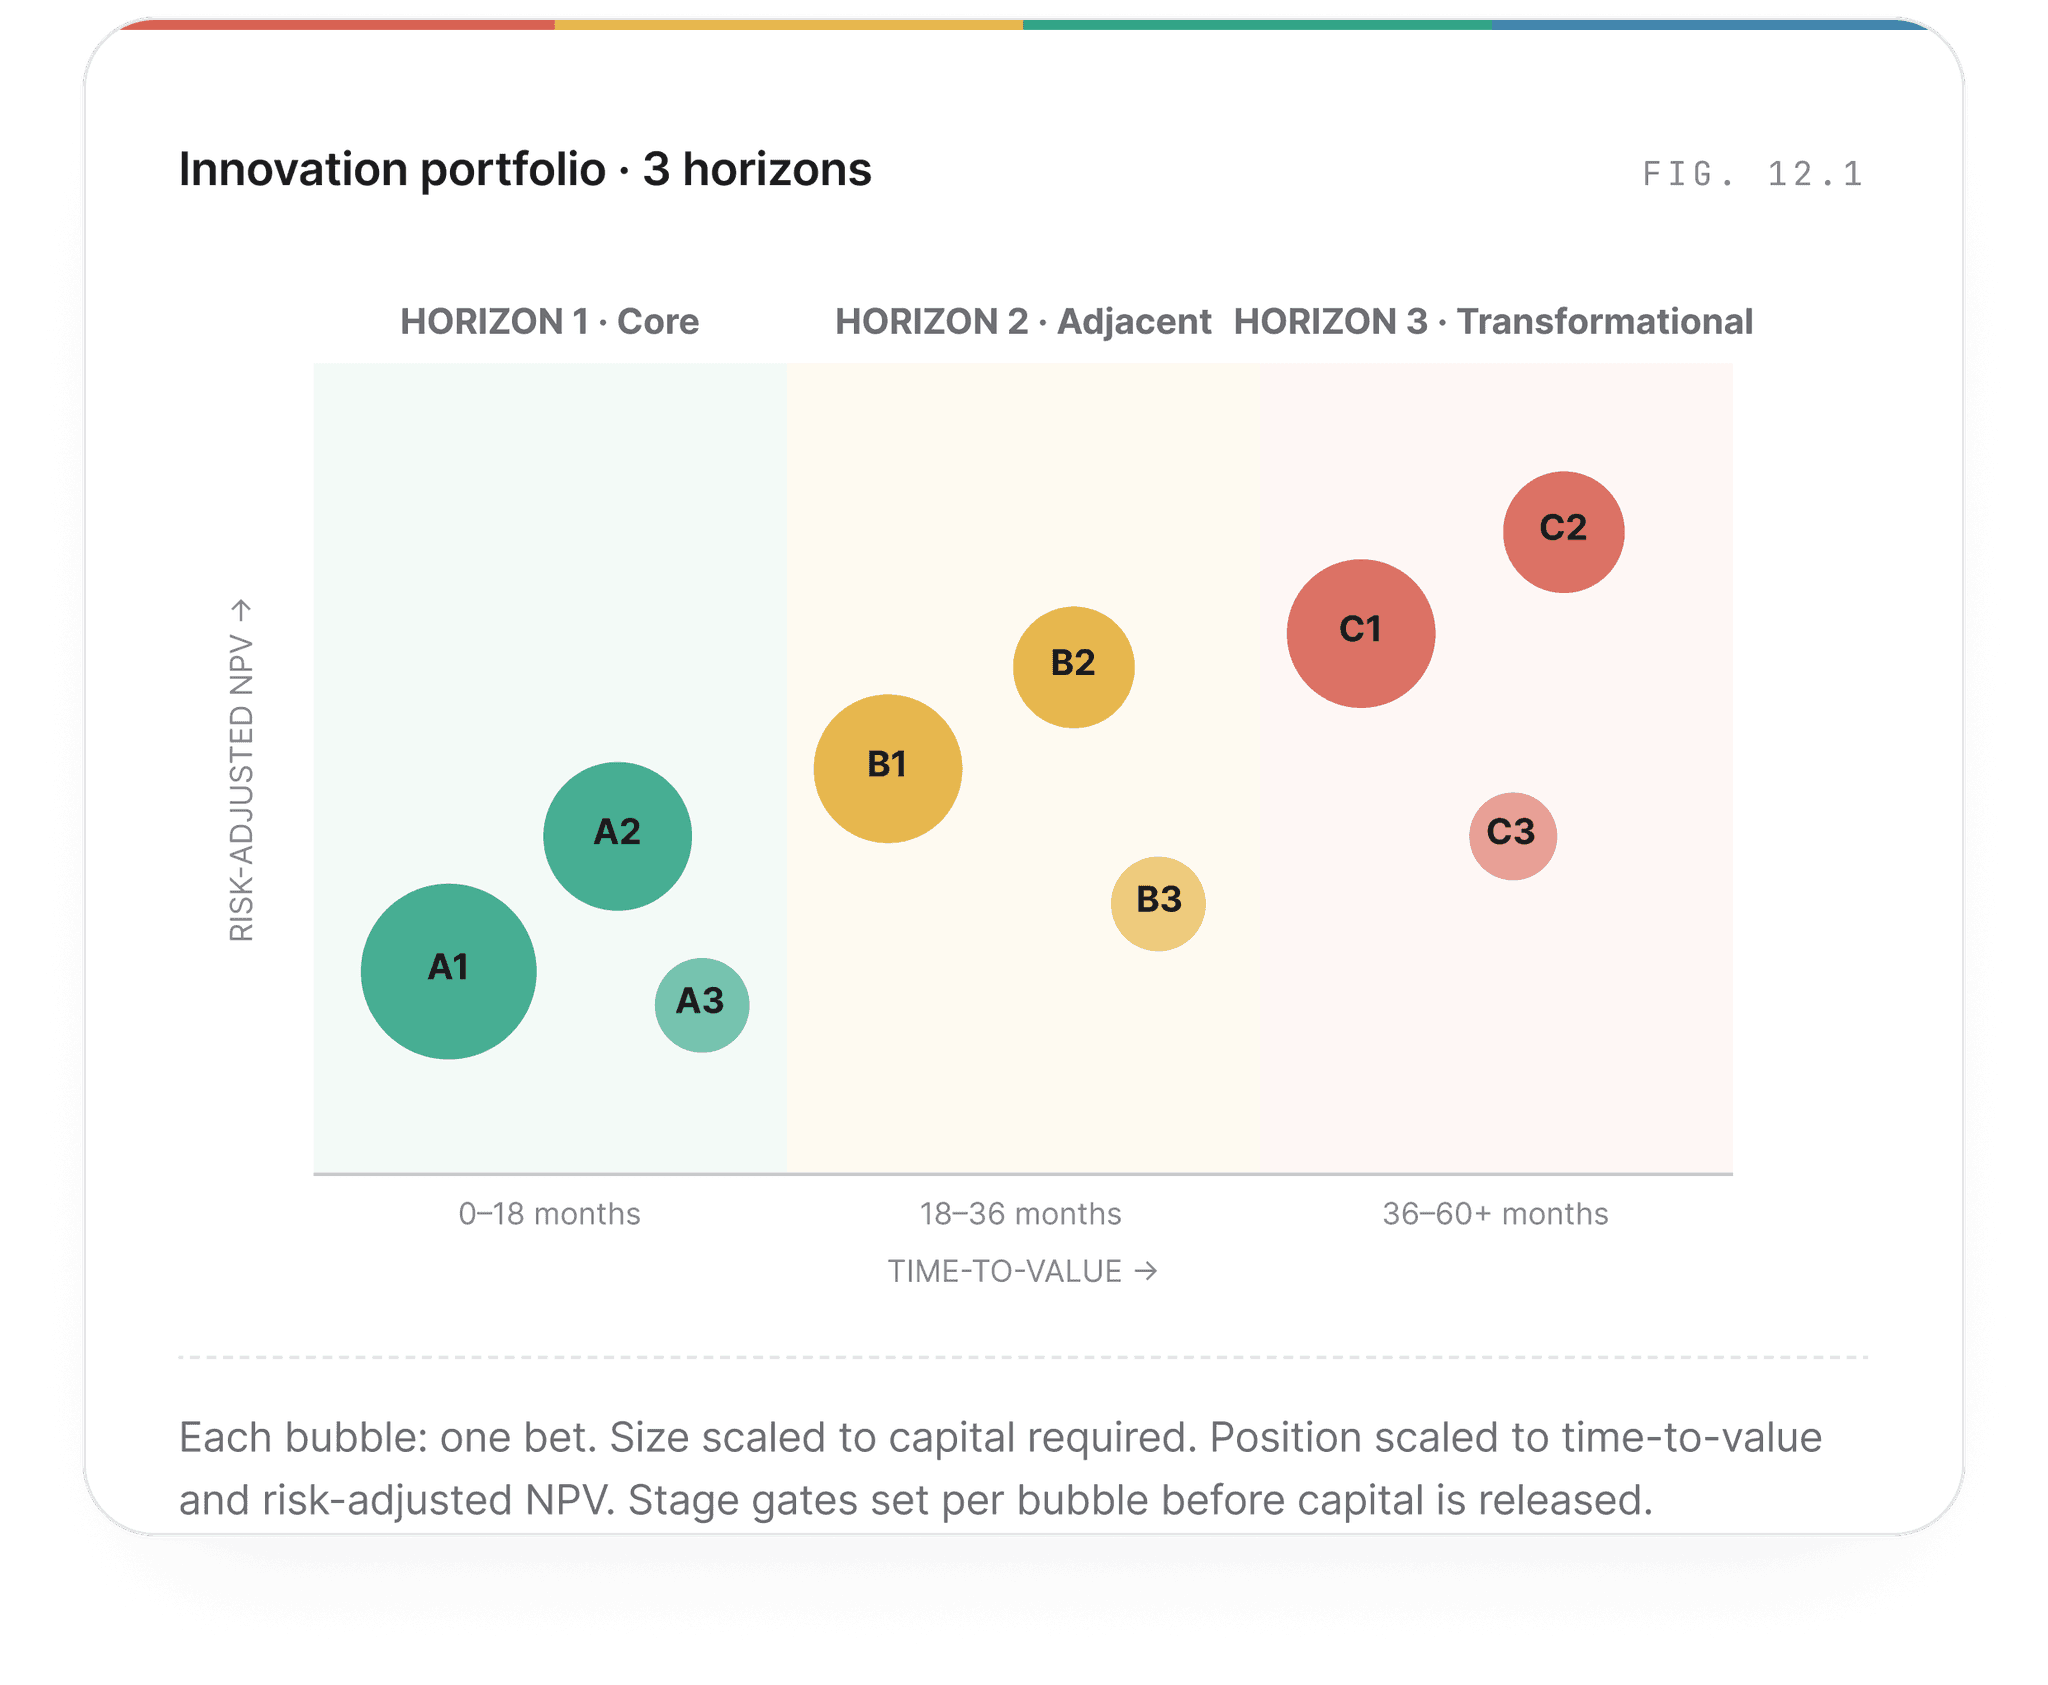
Horizon planning, R&D portfolio design, build-buy-partner decisioning, and venture-style stage gates the work that turns innovation from a slide deck into a returns-disciplined capital plan.
Innovation programmes fail in one of two ways. They run out of money on a bet that nobody could defend, or they refuse to bet at all and quietly let the category move past them. Both failures look the same in hindsight: a portfolio nobody managed.
We design and run innovation portfolios the way a thoughtful venture investor would. Horizon-one, horizon-two, horizon-three bets are sized and sequenced. Each bet has a stage-gate plan with go/no-go criteria written before the money goes out. Build, buy, and partner are all on the table from day one, evaluated on the same economics.
The work produces a three-year innovation plan with quarterly stage gates, a build-buy-partner matrix per bet, and a quarterly review the executive team runs themselves once the rhythm is established.
What you get
Three-horizon portfolio design with capital allocation by horizon
Bet-level investment memos, written to venture-committee standards
Build-buy-partner matrix with primary references for each path
Stage-gate plan with quarterly review cadence
Portfolio dashboard for the executive team and the board
3×
Capital efficiency lift typical after portfolio redesign
~30%
Of horizon-one bets reallocated within the first cycle
Typical engagement: Portfolio design 10–14 weeks · Quarterly review as standing engagement · Board-ready dashboard included
RUN LIKE A VENTURE COMMITTEE
The first call is a working session not a sales call
Tell us where you are stuck. Within forty-eight hours, a partner who has lived inside the question will be on a call with you, walking through what we would do, who we would put on it, and what the work would tell you. No proposal you cannot read in ten minutes.