Market Minds Advisory
Vegan Yogurt Market 2024-2034: Trends, Growth and Insights

Vegan Yogurt Market 2024-2034: Trends, Growth and Insights: Vegan Yogurt: Protein Deficits, Fermentation Chemistry and the Price Gap That Will Not Close

Plant substrates carry no lactose, so cultures need added sugar to ferment at all, which puts a sweetener declaration on the label of a product sold almost entirely on health positioning.

Lead Analyst

Lisa Gevelber

Published

August 2026

Make Smarter Decisions with Customized Research Insights

Request a free sample report and evaluate market opportunities, growth trends, and competitive dynamics relevant to your business needs.

2025 MARKET VALUE$4.2BMarket Size 2025
2036 FORECAST VALUE$11.7BBase Case , 2026 to 2036
CAGR 2026 TO 20369.8 %Bull 11.0% / Bear 8.6%
INCREMENTAL OPPORTUNITY$7.1BNet 10- year value creation
EXPANSION MULTIPLE2.55x2036 value over 2026 base
Strategic Levers
M&A Pipeline
Regional Outlook
Country Rankings
Competitive Intelligence
Segmental Deep-dive
Call-Us : 91 93563 13602

Executive Snapshot and Market Trajectory.

This is the one plant dairy category that kept growing after plant milk flattened, and the reason has nothing to do with taste preference. Plant milk carries coffee or cereal, so switching costs a consumer almost nothing sensory. Yogurt gets eaten alone, which means the base is the product.
That is why the original coconut format stalled. Coconut yogurt delivers roughly a third of the protein dairy does per serving, which turned an implied health purchase into a dessert with a health label on it. Oat and pea bases changed the category: oat gives creaminess without nut allergens and pea gives actual protein. Oat now grows at 14.7%, half again the market rate of 9.8%, and pea at 12.6% behind it.
Two problems will not go away. Plant substrates contain no lactose, so cultures need roughly 4.2 grams of added sugar per serving to ferment, which then appears on a label sold entirely on health. And the category still prices at a 62% premium to dairy yogurt per hundred grams, because coconut cream and almond paste simply cost more than milk from a subsidised dairy sector.
Market Definition
Fermented plant based yogurt and yogurt alternative products sold through retail and foodservice, covering coconut based, almond based, oat based, soy based, cashew and nut based, and pea and legume protein bases. Measured at retail selling value across spoonable, drinkable and multipack formats. Dairy yogurt, unfermented plant milk beverages, plant based desserts without live cultures, and dairy blends containing any milk are excluded.
Base Year Value
$4.2B in 2025 (MMA Primary Research Dataset, August 2026)
Forecast Period
2026 to 2036, eleven discrete annual values
CAGR
9.8% base case. Bull 11.0%. Bear 8.6%.
Fastest Growth Segment
Oat Based Yogurt: 14.7% CAGR
Fastest Growth Country
Germany: 15.4% CAGR
Fastest Growth Region
South Asia and Pacific: 12.0% CAGR
Largest Region
Western Europe: 26% of 2025 global value
Market Leaders
Danone, Chobani, General Mills, Lactalis, Oatly. Source: MMA Primary Research Dataset, July 2026.
Primary Survey
n=3,800 procurement and R&D decision-makers, Q4 2025, six countries
Methodology
Demand-side build-up, cross-validated against public data, 47 expert interviews

Vegan Yogurt Market Forecast Scenarios

vegan-yogurt-market-trends-growth-size-forecast-scenario-1787641374888
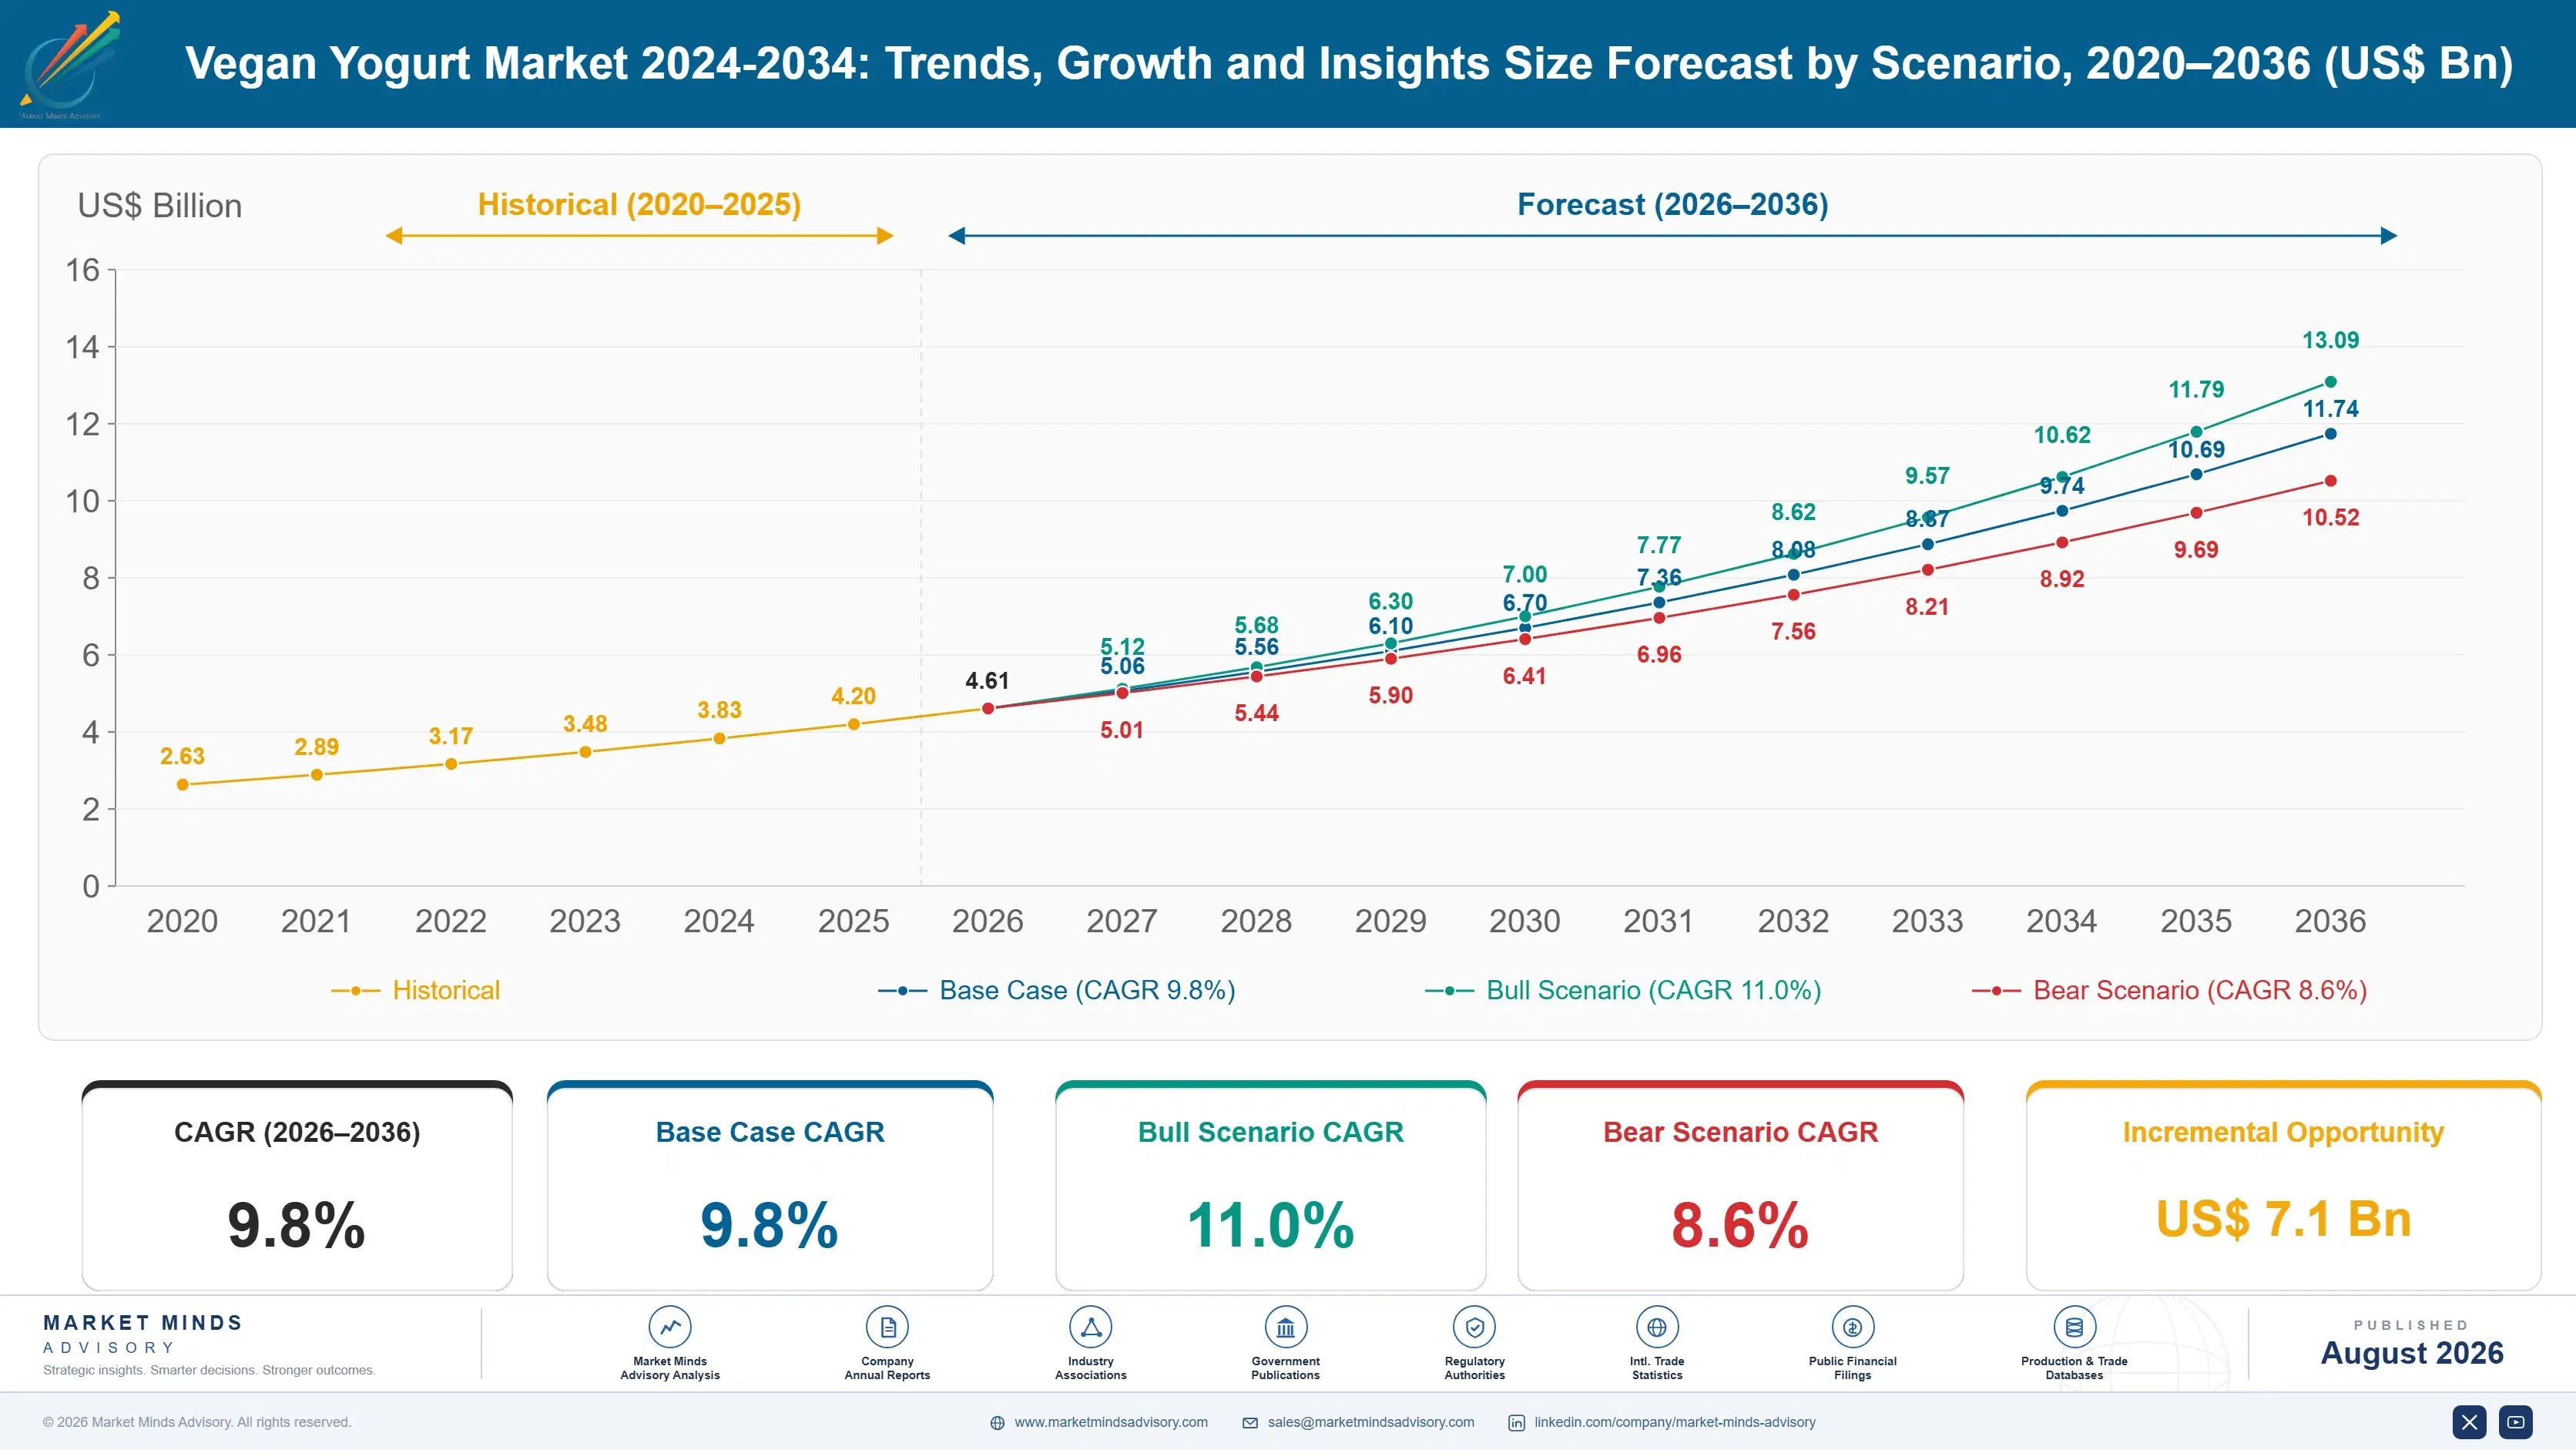
The five years to 2025 were a base substitution rather than a growth story. Coconut and almond formats that built the category lost share to oat and pea bases arriving with better texture and protein, while total volume grew throughout. Plant milk flattened and commentators wrongly assumed yogurt would follow. The 8.4% historical rate hides a complete reordering of what the category is made from.
The 9.8% base case rests on three mechanisms. Protein positioning continues moving volume toward pea and legume bases, since the health argument collapses when a serving carries less protein than a slice of bread. Culture strains developed specifically for plant substrates reduce the added sugar requirement and remove the label problem that undermines the same argument. And European household penetration keeps rising from around 17%, with Germany expanding fastest of anywhere.
The 11.0% bull case turns on culture technology reaching a genuine no added sugar fermented plant yogurt at scale, which would resolve the contradiction the category has carried since it started. The 8.6% bear case is the price gap: at a 62% premium over dairy, this is a discretionary purchase, and household budget pressure removes it long before it removes conventional yogurt.

Where the Base Ingredient Is the Product

Plant milk and plant yogurt look like the same category and behave nothing alike. Milk mostly carries something else, so a consumer switching bases barely notices what the base tastes like. Yogurt is eaten with a spoon, so the base is the entire sensory experience. That distinction explains why one flattened and the other kept growing.
TOP FIVE CONCENTRATION46%Combined retail volume held by the largest manufacturers
PROTEIN CONTENT GAP3.4xDairy protein content relative to typical coconut base
PRICE PREMIUM OVER DAIRY62%Retail uplift per hundred grams against conventional yogurt
ADDED SUGAR REQUIREMENT4.2gSugar added per serving to feed fermentation cultures
HOUSEHOLD PENETRATION RATE17%Share of households buying the category within a year
CHILLED SHELF LIFE28 daysTypical refrigerated life from production to expiry date
It also explains the base reordering. Coconut built this category and delivers roughly a third of the protein dairy provides, which turned a purchase people made for health reasons into a dessert. Oat arrived with genuine creaminess and no nut allergen problem, and pea protein arrived with a nutritional profile that survives a label comparison. Both grow faster than the market while coconut and almond decelerate.
The fermentation problem is less visible and harder. Yogurt cultures evolved to ferment lactose and plant substrates contain none, so manufacturers add roughly 4.2 grams of sugar per serving to feed them. That declaration sits on a pack sold almost entirely on health positioning, and consumers reading labels notice. Culture houses are developing strains for plant substrates specifically, which is a biotech capability most food companies buy rather than hold.
"The category spent a decade selling coconut yogurt to people who thought they were buying something healthy and were actually buying pudding. Pea protein is the first base that survives being read off the back of the pot."
Director, Dairy Alternatives and Consumer Foods Practice · MMA Food Service and Consumer Foods Practice · August 2026

Market Trends

Protein Content Decides Which Base Wins Shelf Space

Coconut yogurt delivers roughly a third of the protein dairy provides per serving, which is fine for a dessert and fatal for a product bought on health grounds. Consumers comparing nutrition panels have moved toward pea and legume bases that survive that comparison, and toward oat which at least delivers texture credibly. Pea and legume protein yogurt grows at 12.6% and oat at 14.7% against a market rate of 9.8%, while coconut and almond decelerate. Retailers have followed, reallocating facings toward bases that support a protein claim on front of pack.
Market Impact: Penetration stands at 17% today
Plant Specific Cultures Address the Added Sugar Problem

Yogurt cultures evolved to ferment lactose and plant substrates contain none, so roughly 4.2 grams of sugar per serving gets added purely to feed the fermentation. That declaration appears on a pack positioned on health, and consumers reading labels have noticed the contradiction. Culture houses are developing strains that ferment plant sugars and starches directly, reducing or removing the addition entirely. The capability sits with a small number of specialist suppliers rather than with the food manufacturers, which means the competitive advantage will arrive through a supply agreement rather than through internal development.
Market Impact: Excludes nuts from 12% of channels

Market Opportunities and Growth Drivers

European Household Penetration Keeps Climbing From a Low Base

Household penetration sits near 17% across developed markets, which means the overwhelming majority of households have never bought the category at all and repeat purchase is not yet the binding constraint. Germany grows at 15.4%, faster than any market covered, on the deepest plant based retail range in Europe and a consumer base that trials plant products more readily than anywhere else. British and Nordic penetration follows closely. The growth available from converting non buyers considerably exceeds anything available from persuading existing buyers to consume more frequently. Availability rather than willingness is the limit.
Market Impact: Premium sits 62% above dairy

Allergen Constraints Push Formulation Away From Nuts

Almond and cashew bases carry tree nut allergen declarations that exclude them from school channels, many workplace catering settings and households with an allergic member, which is a meaningful share of the addressable market in developed countries. Oat and pea bases carry no such restriction, and oat also avoids the soy allergen that limits the original plant yogurt base. That regulatory and practical constraint has done as much to move the category toward oat as any taste preference. Manufacturers running nut lines also face segregation costs that oat production avoids entirely.
Market Impact: Shelf life limited to 28 days

Market Restraints and Challenges

The Price Premium Over Dairy Will Not Close

Plant yogurt retails at roughly a 62% premium per hundred grams against conventional dairy yogurt, and the gap is unlikely to narrow because the inputs are genuinely more expensive. Coconut cream, almond paste and protein isolates cost more than milk from a heavily subsidised dairy sector, and no plausible scale improvement closes a gap of that size. The root cause is agricultural policy as much as processing. Manufacturers respond with smaller pack formats, multipack value positioning and premium framing that stops inviting the comparison, none of which changes the underlying arithmetic.
Market Impact: Protein gap runs 3.4 times

Short Chilled Shelf Life Constrains Distribution Economics

Live culture products carry a chilled shelf life around 28 days, and plant substrates frequently perform worse than dairy on texture stability across that window as starches retrograde and separation appears. The root cause is that plant proteins and starches lack the gel structure casein provides, so a pot that looks correct at production may not at day twenty. Commercially this raises wastage, limits distribution range and makes export difficult. Manufacturers respond with stabiliser systems and with high pressure processing, both of which add cost to a category already carrying a substantial premium.
Market Impact: Removes 4.2 grams added sugar
3 additional market trends, 4 additional growth drivers, and 2 additional restraints and challenges are covered in the full report. Contact sales@marketmindsadvisory.com to access the complete intelligence.

Segment CAGR and Growth Architecture

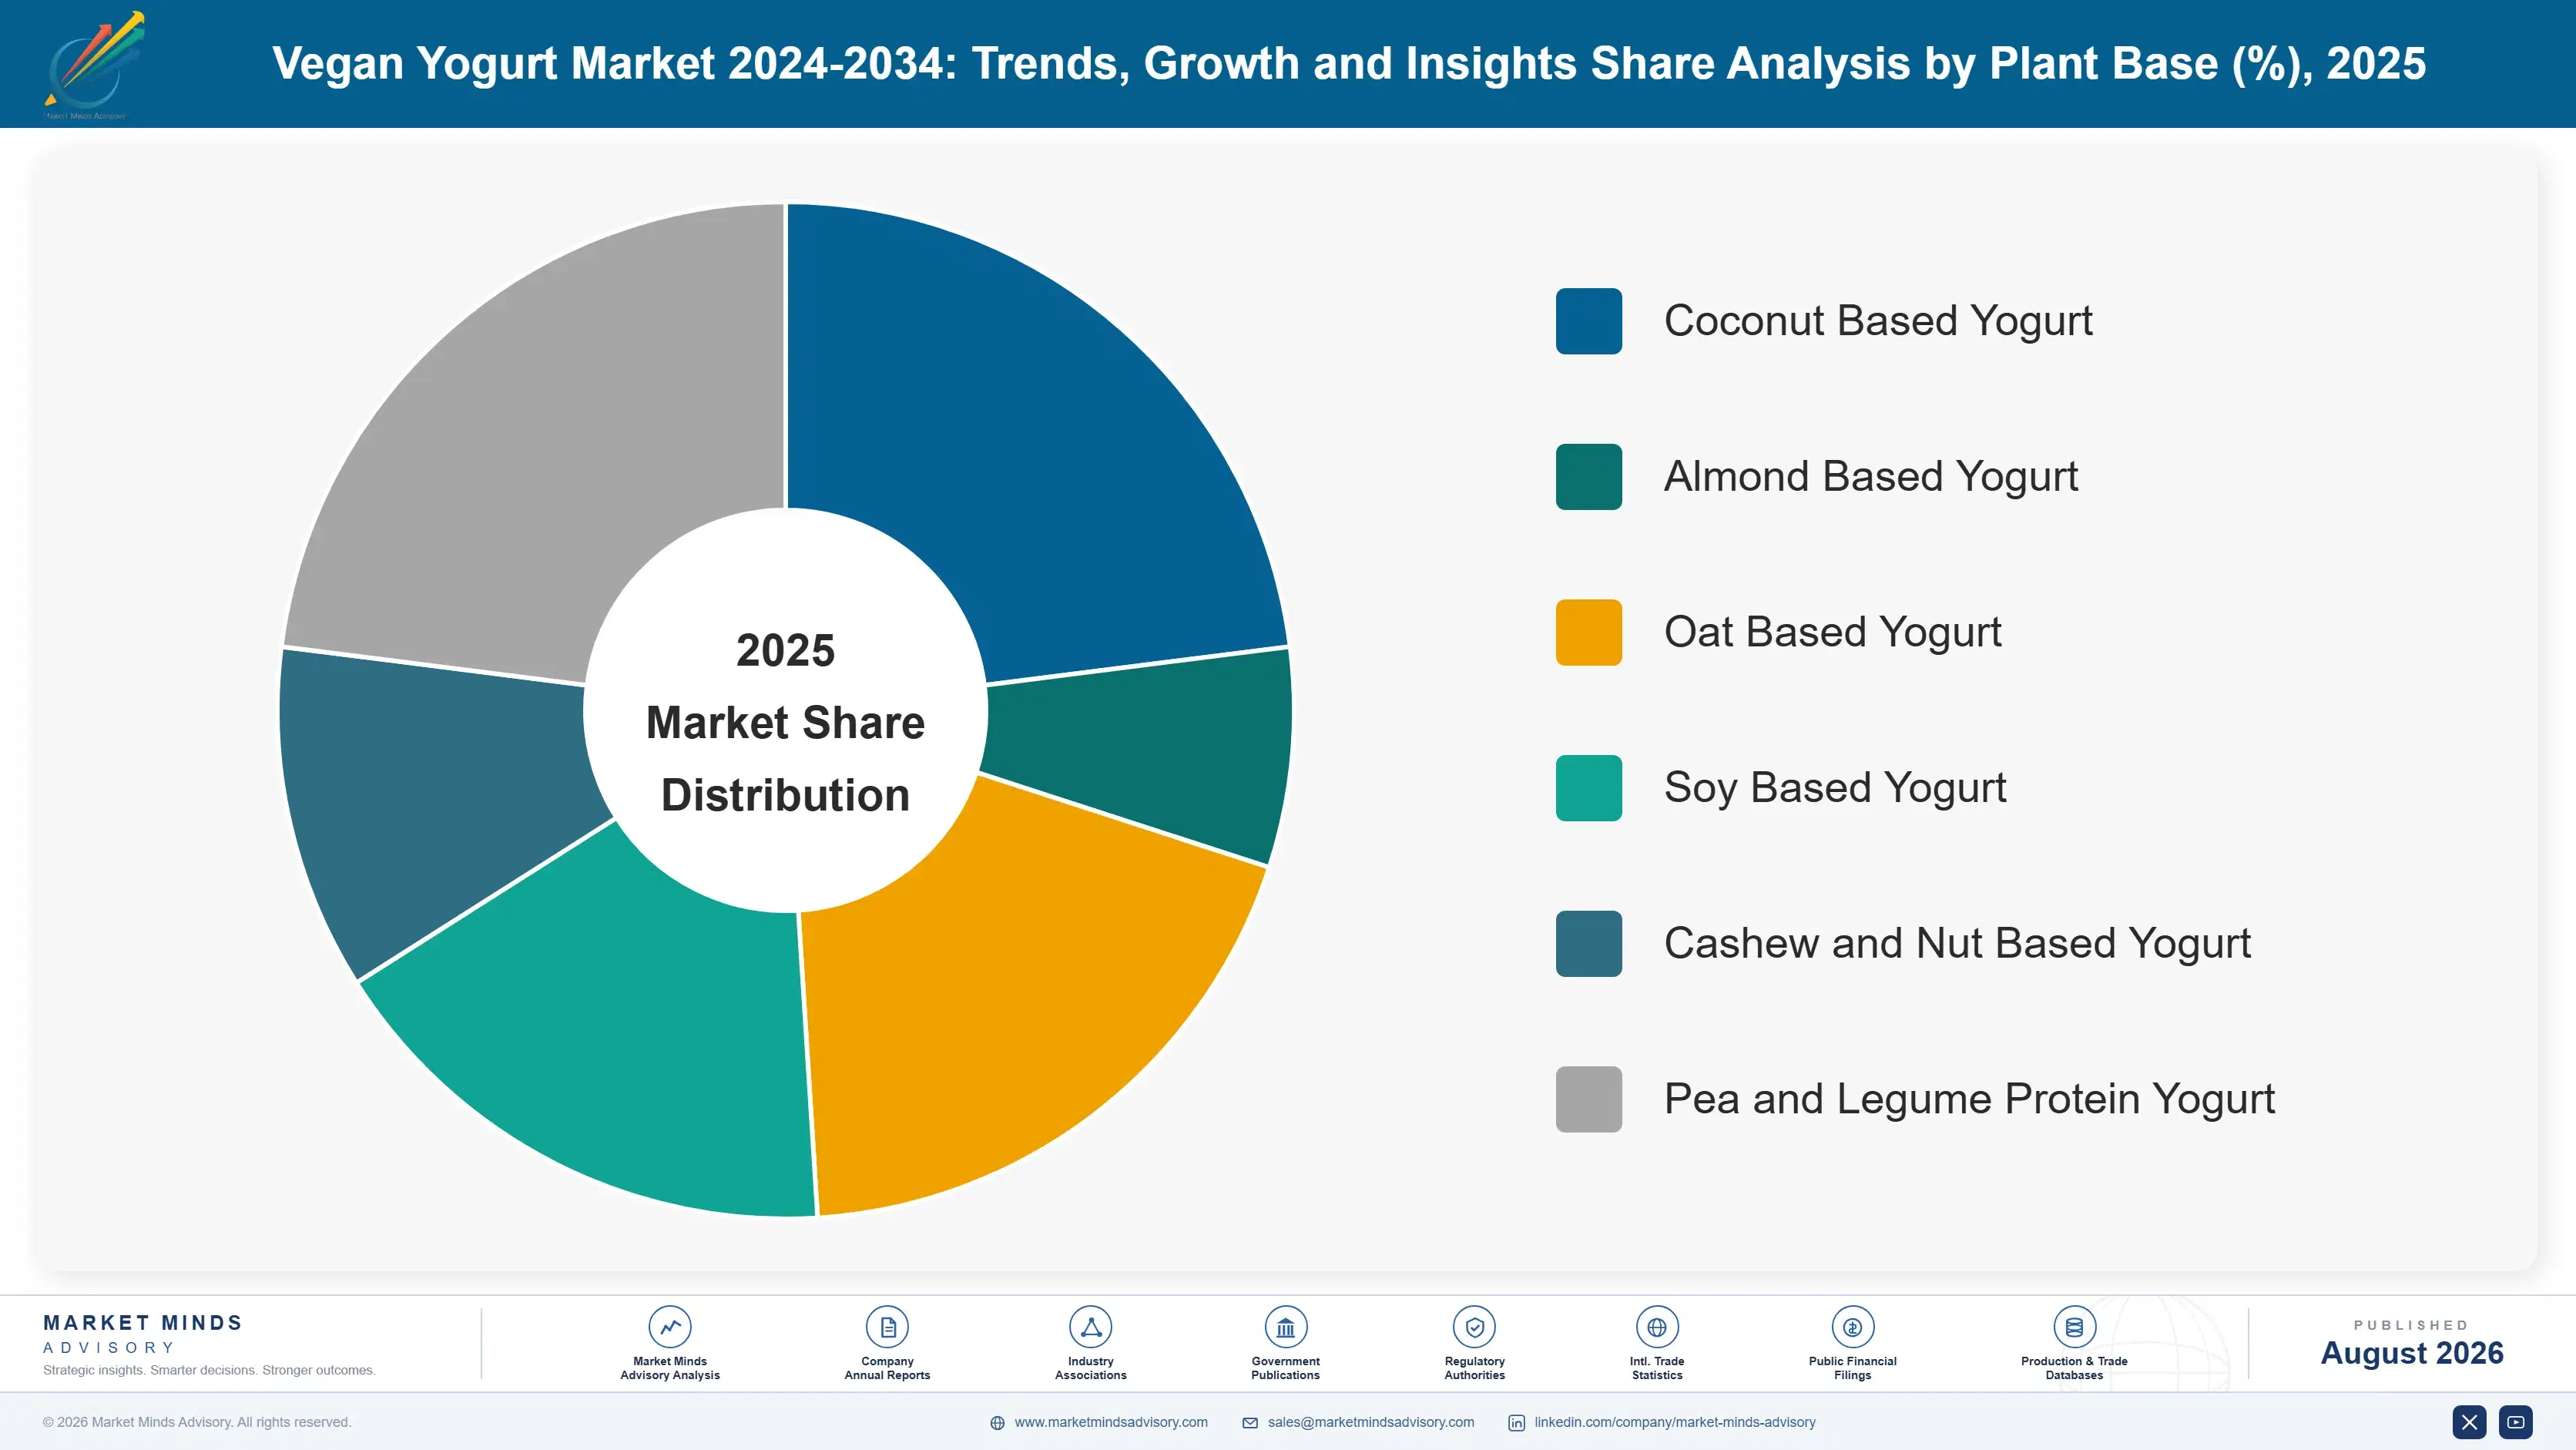
Segmentation follows plant base, since the base decides protein content, allergen status, texture and cost in a product eaten on its own with a spoon. Six bases cover the category, from the coconut that built it to the pea protein now taking share from it. Growth follows nutritional credibility rather than any flavour preference.
vegan-yogurt-market-trends-growth-market-share-analysis-1787641375465

Oat Based Yogurt

Fermented oat bases delivering creaminess through beta glucan and enzymatically treated starch rather than through fat, with no tree nut or soy allergen declaration required. At 14.7% this is the fastest growing base in the category, half again the market rate of 9.8%, and it wins on three counts at once. Texture is genuinely close to dairy, allergen status opens school and catering channels that nut bases cannot enter, and consumer familiarity from oat milk transfers directly. Protein content remains modest, which is the weakness competitors attack, and several manufacturers now fortify with pea protein to answer it. Oat also ferments more readily than nut bases, reducing the added sugar requirement somewhat.
CAGR 14.7%

Pea and Legume Protein Yogurt

Bases built on pea, fava and other legume protein isolates, delivering protein content that stands comparison with dairy on a nutrition panel. Growth of 12.6% is second fastest in the category, and the entire argument is nutritional rather than sensory. A consumer buying plant yogurt for health reasons and reading a coconut pot delivering roughly a third of dairy protein switches once, and rarely switches back. The difficulty is flavour: legume proteins carry a distinct note that requires masking, and the masking systems add both cost and ingredient list length. Manufacturers frequently blend pea with oat to combine protein content with acceptable texture. That blend is now the standard formulation approach among manufacturers taking share.
CAGR 12.6%
Full segment breakdown across 6 segments available in the complete report.

Regional Architecture and Country Demand Map

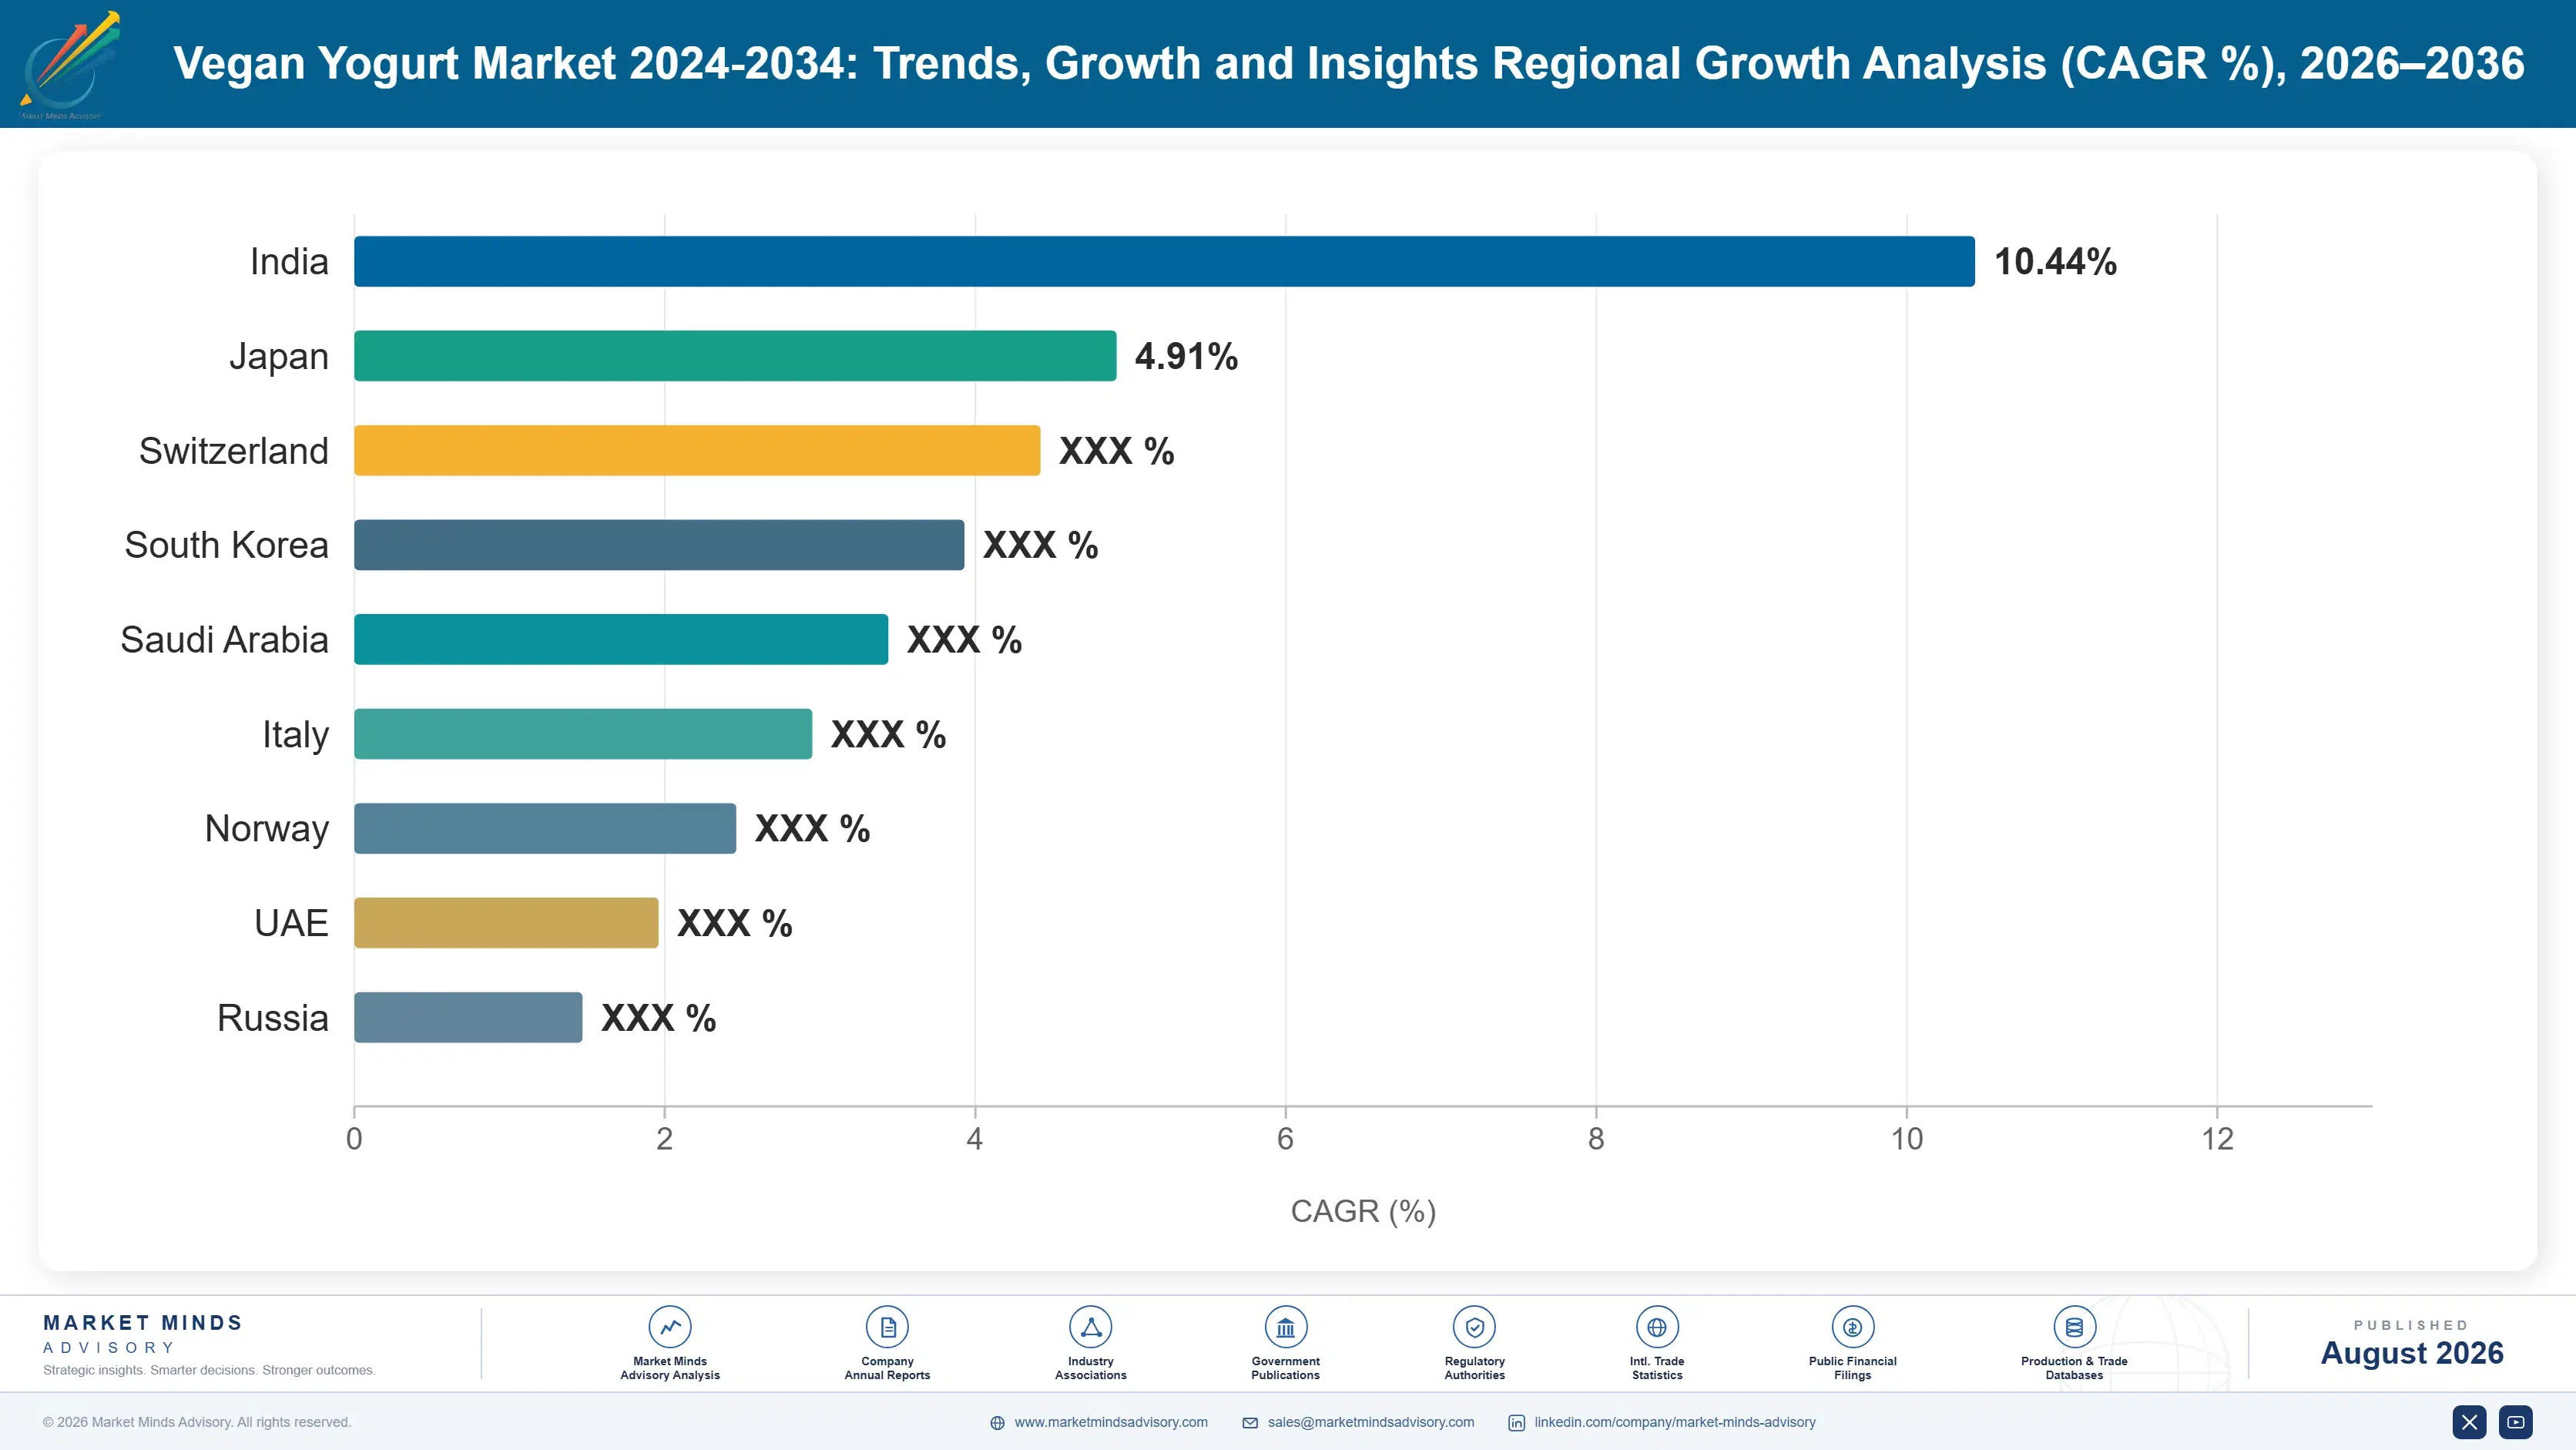
Western Europe holds the largest share at 26%, with the deepest retail ranges and the highest household penetration anywhere. North America follows on scale. Germany grows fastest of any market covered at 15.4%, on unusually high plant product trial rates. Retail range depth drives everything here.

Western Europe

Retail range depth rather than population gives this region its 26% share. German consumers trial plant based products more readily than any other developed market and German retailers carry ranges no other country matches, which is why Germany grows at 15.4%, faster than anywhere covered. British penetration is high and oat bases dominate, helped by an oat milk category that established consumer familiarity first. Nordic markets show the highest per capita consumption in the region. Southern European adoption is considerably slower, constrained by strong dairy traditions and by yogurt cultures embedded in local cuisine. Growth of 8.2% is the lowest of the seven regions, since penetration is already the highest and remaining upside is frequency.
Share: 26% | CAGR: 8.2% (2026 to 2036)

North America

Scale rather than penetration explains this 25% share. American retail carries broad plant yogurt ranges and the category has grown steadily, though household penetration sits below European levels and the price premium bites harder in a market where value messaging dominates dairy aisles. Coconut and almond bases built the American category and still hold more share here than in Europe, which is why the base reordering toward oat and pea has moved more slowly. Protein positioning resonates strongly with American consumers and pea bases are gaining accordingly. Canadian consumption follows similar patterns at smaller scale. Growth of 9.2% reflects steady conversion rather than any acceleration. Protein positioning resonates strongly in this market.
Share: 25% | CAGR: 9.2% (2026 to 2036)
Regional intelligence for 5 additional markets available in the complete report: East Asia, South Asia and Pacific, Latin America, Middle East and Africa, Eastern Europe. Contact sales@marketmindsadvisory.com.
vegan-yogurt-market-trends-growth-country-cagr-analysis-1787641376007

Where This Category Actually Earns

Nothing here is won on ethical positioning, because the buyer is comparing a nutrition panel and a shelf price against dairy sitting a metre away. Value accrues to whoever delivers protein that survives that comparison, whoever removes the added sugar declaration, and whoever converts the households that have never bought. Four routes carry weight, and three are formulation problems.

Lead With Protein That Survives the Panel

Coconut yogurt delivers roughly a third of the protein dairy provides, which is acceptable in a dessert and indefensible in a product bought for health reasons. Pea and legume bases grow at 12.6% and oat at 14.7% against a market rate of 9.8% because they survive being read off the back of the pot. Retailers have reallocated facings toward bases supporting a front of pack protein claim, which compounds the shift. Blending pea protein into oat bases delivers both nutrition and texture, and it is now the standard formulation approach among manufacturers taking share.
Market Impact: Closes the 3.4 times protein content gap directly

Secure Plant Specific Culture Strains Early

Plant substrates carry no lactose, so roughly 4.2 grams of sugar per serving gets added purely to feed the fermentation, and that declaration appears on packaging sold on health positioning. Culture houses developing strains that ferment plant sugars and starches directly will resolve the contradiction, and the capability sits with a handful of specialist suppliers rather than with food manufacturers. That means the advantage arrives through a supply agreement rather than through internal research, and exclusivity terms on those agreements will matter more than anything happening in a manufacturer's own laboratory.
Market Impact: Removes the 4.2 grams of added sugar entirely

Formulate Out of Tree Nut Allergen Constraints

Almond and cashew bases carry allergen declarations that exclude them from school channels, much workplace catering and households with an allergic member, which removes roughly 12% of the addressable distribution. Oat and pea carry no such restriction, and manufacturers running nut lines also carry segregation costs that oat production avoids entirely. That single constraint has moved as much volume toward oat as any taste preference has. Reformulating away from nuts opens channels and removes manufacturing complexity at the same time, which is an unusually clean trade. Manufacturing complexity falls at the same time.
Market Impact: Opens 12% of currently restricted distribution channels immediately

Convert Households That Have Never Bought Once

Household penetration sits near 17% in developed markets, which means more than four in five households have never purchased the category and the growth available from conversion far exceeds anything available from frequency. Germany grows at 15.4%, faster than any market covered, on the deepest retail range and the highest trial rates anywhere. Trial driving mechanics, single serve formats and sampling reach the non buyer where loyalty programmes reach only the converted. Manufacturers optimising for frequency among existing buyers are working the smaller of the two available opportunities. The larger opportunity sits outside the buyer base.
Market Impact: Targets the 83% who have never bought once

Who Controls the Margin Pool

Concentration is moderate and unusually mixed. The top five hold 46% of retail volume, the basis applied consistently here, and the list combines dairy majors that entered defensively with specialists built entirely around plant bases. Danone leads through brands acquired rather than developed, and the distance to the next tier reflects chilled distribution reach and retailer relationships rather than any formulation advantage.
Competition runs on three fronts. Dairy majors compete on chilled distribution, retailer negotiating weight and the ability to fund a category that dilutes their core margin. Plant specialists compete on base credibility and on formulation, moving faster because they have no dairy business to protect. Retailer own brands compete on price against a 62% premium, and they have grown faster than either group in several European markets.

Rankings will shift with culture technology rather than with marketing. A manufacturer securing exclusive access to strains fermenting plant substrates without added sugar would hold a genuine advantage for the length of the agreement. The other pressure point is own brand: a category priced this far above dairy invites a retailer to demonstrate that the premium is unnecessary, and several have started.
vegan-yogurt-market-trends-growth-company-positioning-matrix-1787641376581

Competitive Moat and Risk Dimensions

DANONE

Moat: Chilled Distribution Reach

Existing chilled logistics and retailer relationships across dairy give plant based products immediate national distribution that a specialist spends years building, which matters enormously for a product with a 28 day shelf life. The portfolio also spans multiple bases, so preference shifts between coconut, oat and pea move volume within the company.
DANONE

Risk: Core Category Cannibalisation

Every plant yogurt sale that replaces a dairy yogurt sale dilutes margin, since the plant product costs more to make and the dairy business carries decades of manufacturing scale behind it. That creates an internal reluctance specialists do not share, and it has repeatedly slowed investment decisions that a plant focused competitor takes without hesitation.
OATLY

Moat: Oat Base Credibility

Consumer association with oat as a plant base was built through a beverage category that reached mass familiarity first, and that recognition transfers directly to yogurt where oat is the fastest growing base at 14.7%. Enzymatic oat processing capability developed for beverages also applies to fermented formats, which shortens development considerably compared with starting from a nut or legume base.
OATLY

Risk: Protein Content Weakness

Oat delivers texture convincingly and protein poorly, which is precisely the comparison consumers are increasingly making on the back of the pot. Pea and legume bases grow at 12.6% on exactly that argument, and answering it requires fortifying oat with a protein the company does not process, which introduces a dependency and an ingredient list problem simultaneously.

Players Tracked

Prominent Players

Danone
Chobani
General Mills
Lactalis
Oatly

Other Key Players

Nestle
Valio
Arla Foods
Ehrmann
Muller Group
Bel Group
Califia Farms
Kite Hill
Forager Project
Cocojune
Coyo
Vitasoy International
Marusan-Ai
Yakult Honsha
Sodiaal

Recent Developments

FEBRUARY 2025

Culture supplier launches strains for plant substrate fermentation

A specialist culture house launched bacterial strains developed to ferment plant sugars and starches directly, reducing the added sugar required to drive fermentation in oat and legume bases. Manufacturers described the development as addressing the single most damaging line on a plant yogurt ingredient declaration.
Signal: The advantage in this category will arrive through a culture supply agreement rather than internal research
MAY 2025

European retailer expands own brand plant yogurt range sharply

A major European grocery retailer widened its own brand plant based yogurt range across oat and coconut bases, priced substantially below branded equivalents on the same shelf. Branded suppliers lost facings, and the pressure concentrated in a category already carrying a 62% premium over conventional dairy yogurt.
Signal: A premium that large simply invites a retailer to demonstrate publicly that the premium is unnecessary
SEPTEMBER 2025

Manufacturer reformulates coconut range with added pea protein

A plant yogurt manufacturer reformulated its coconut range with added pea protein isolate, raising protein content to a level that stands comparison with dairy on a nutrition panel. The company cited consumer research showing protein content had become the primary purchase criterion among category buyers.
Signal: Coconut alone can no longer carry a health positioning once the buyer actually reads the panel

What a Pot Actually Costs

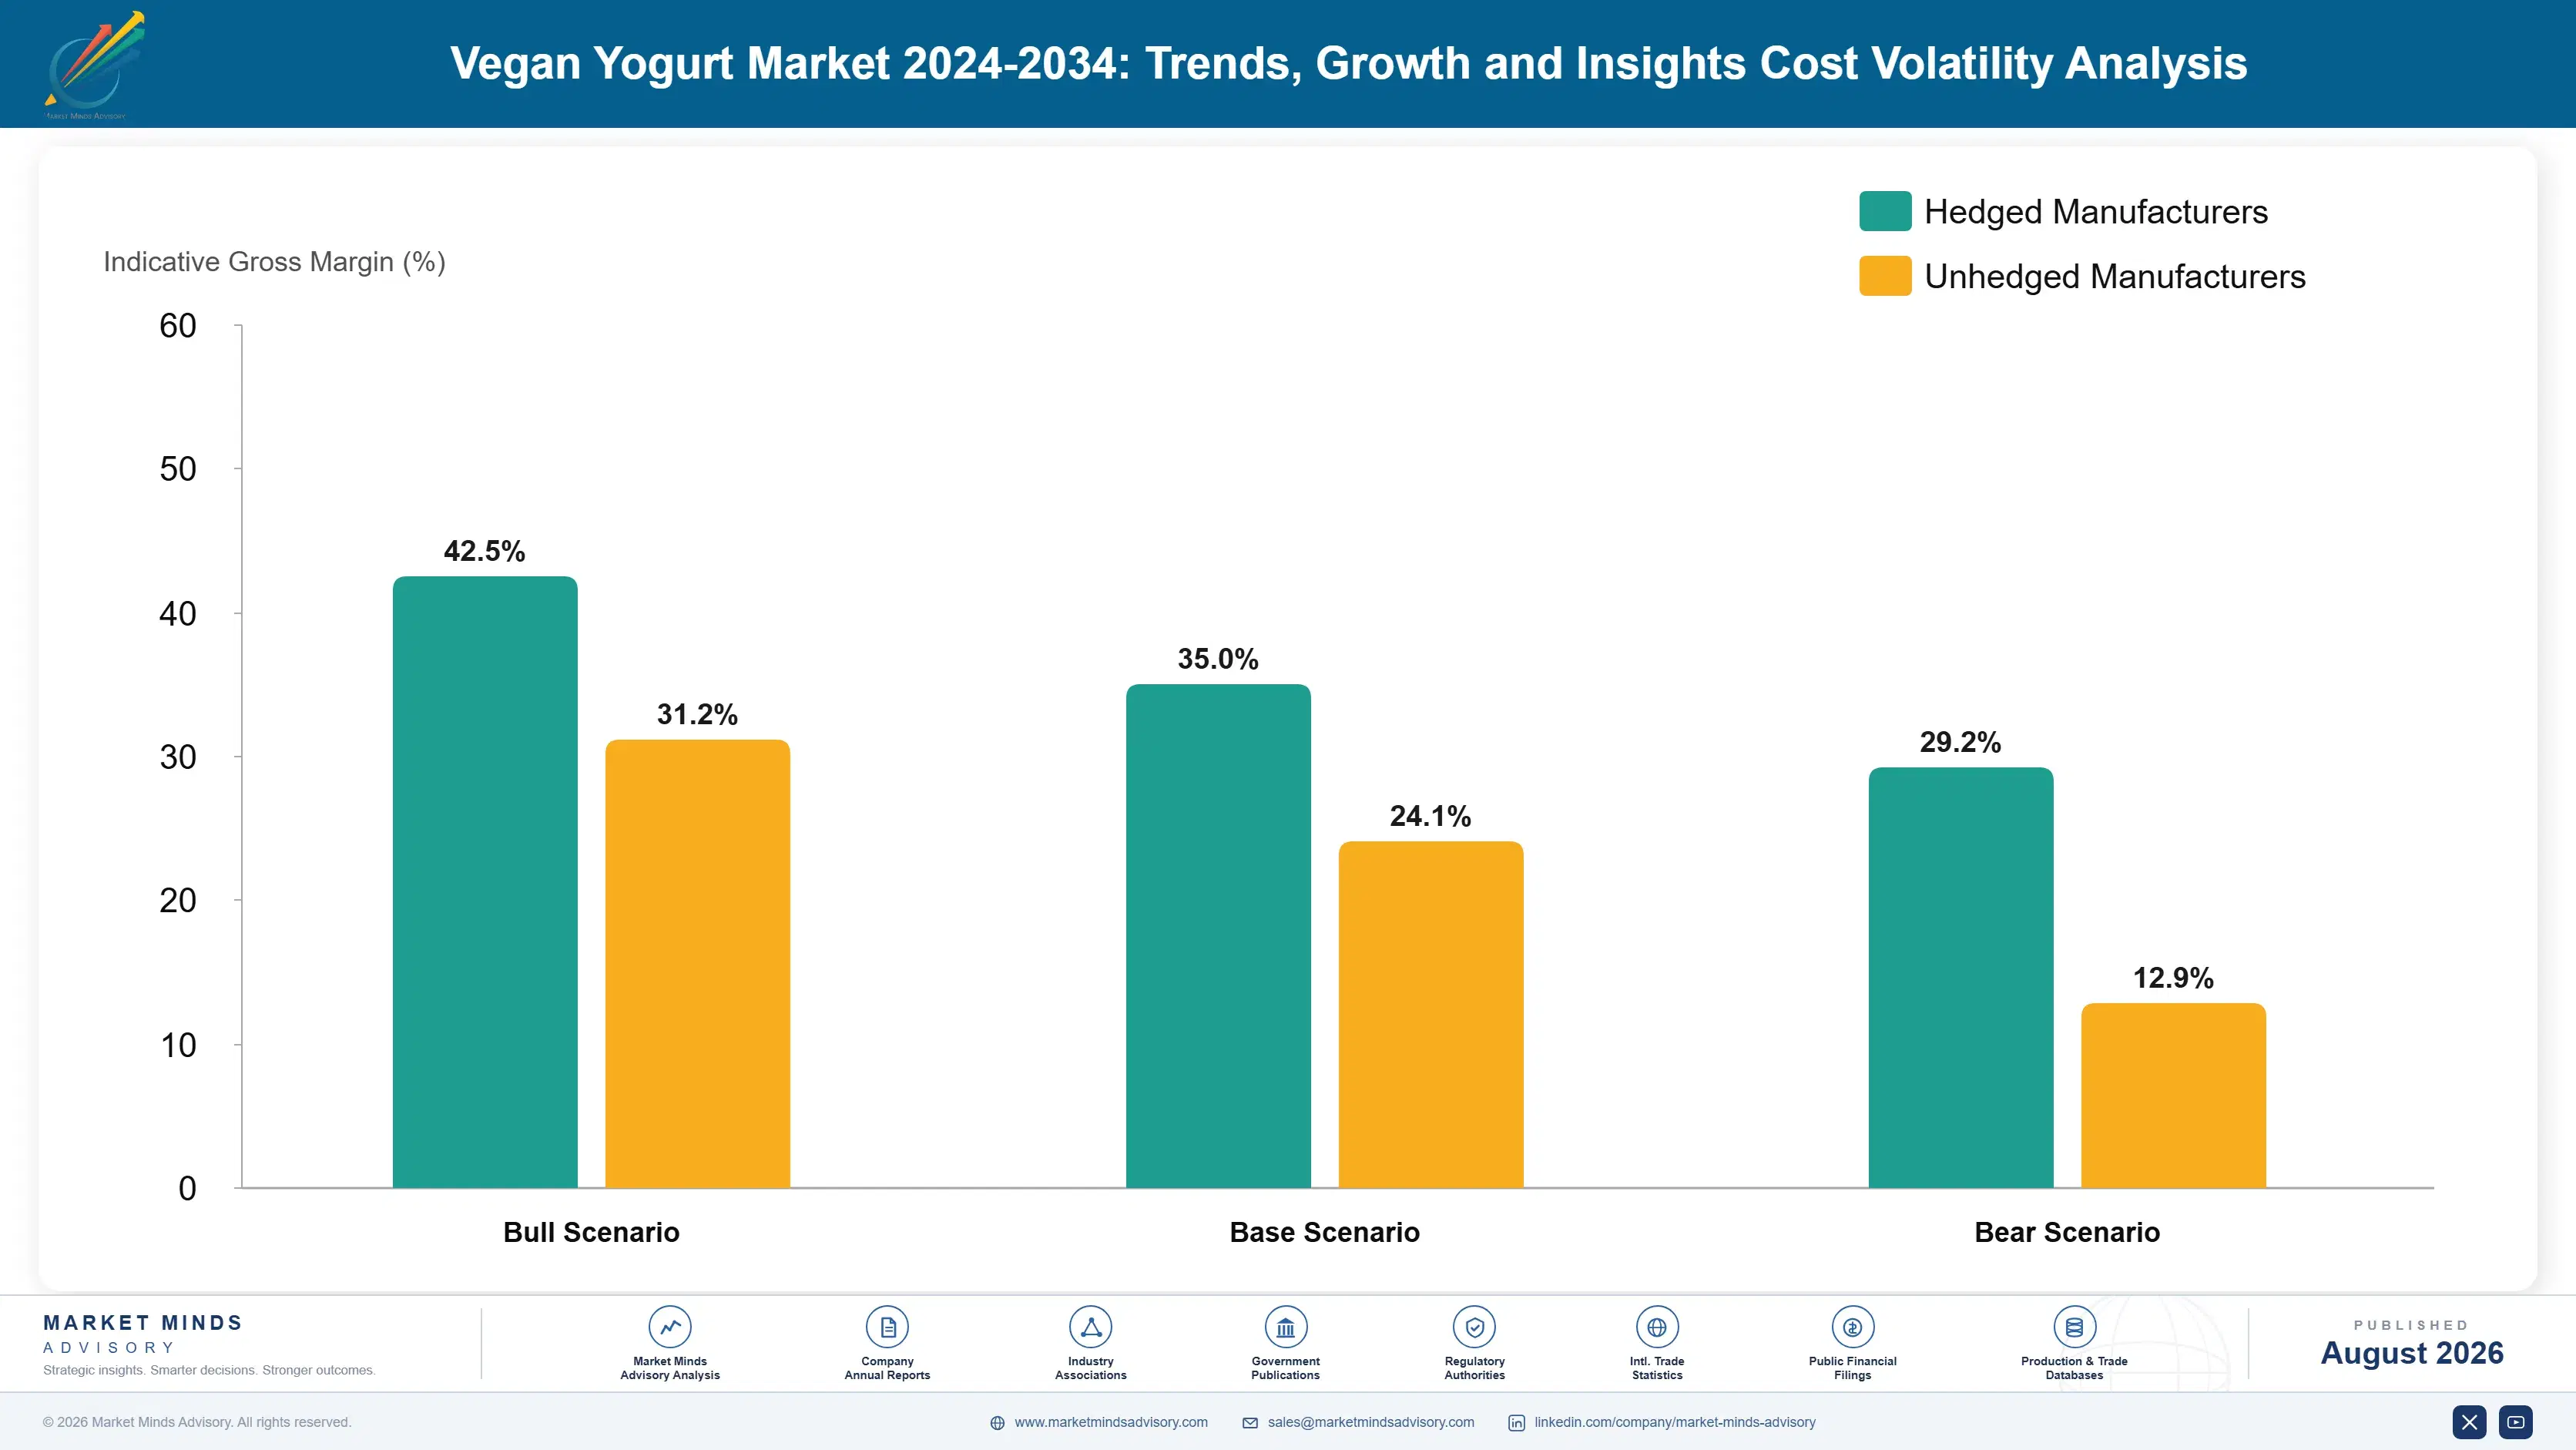
Base ingredient cost drives the dairy premium almost entirely. Coconut cream, almond paste, oat concentrate or protein isolate accounts for roughly 41% of cost of goods depending on base, against far lower input cost for subsidised dairy milk. Coconut comes from the Philippines, Indonesia and Sri Lanka, almonds overwhelmingly from California, oats from Northern Europe and Canada, and pea protein from Canadian, French and Chinese processors.
Almond and coconut pricing both moved sharply through this period, for entirely unrelated reasons. Californian almond output responded to water allocation restrictions, documented in USDA crop and price reporting, while coconut supply tightened on ageing plantations and typhoon damage in Philippine growing regions. Oat pricing stayed comparatively stable, which is one reason that base gained share. Energy costs through 2022 raised chilled distribution costs across every base equally.

Exposure divides by base rather than by manufacturer scale. A company weighted toward almond carries Californian water policy risk it cannot hedge, and one weighted toward coconut carries typhoon and plantation age risk in a small number of origins. Oat and pea draw on temperate crops grown across several continents, which is far more comfortable. Manufacturers running several bases shift emphasis, and increasingly do.
vegan-yogurt-market-trends-growth-cost-volatility-analysis-1787641376785

Shift base mix toward temperate crop sourcing

Oat and pea draw on crops grown across Northern Europe, Canada and China, which spreads weather and policy risk that tropical and Californian sourcing concentrates badly. The shift also happens to align with where consumer demand is moving, which makes it an unusually easy decision. Manufacturers running several bases can move emphasis without reformulating, provided the lines allow it.

Contract protein isolate on multi year volume terms

Pea protein isolate pricing falls sharply with committed volume rather than spot purchasing, and capacity built for a retail plant meat boom is now available to buyers willing to commit. Multi year agreements secure both price and allocation priority. The cost is committing volume against a base whose preference could move again, in a category that has already reordered once.

Extend shelf life through processing rather than stabilisers

High pressure processing extends chilled life beyond the usual 28 days without adding stabiliser declarations to a label already under scrutiny. Capital cost is significant and throughput lower than conventional filling. For manufacturers with export ambitions or wide distribution the arithmetic works, and it removes the wastage that short life causes at the far end of a distribution network.

Portfolio Architecture for Margin Defence

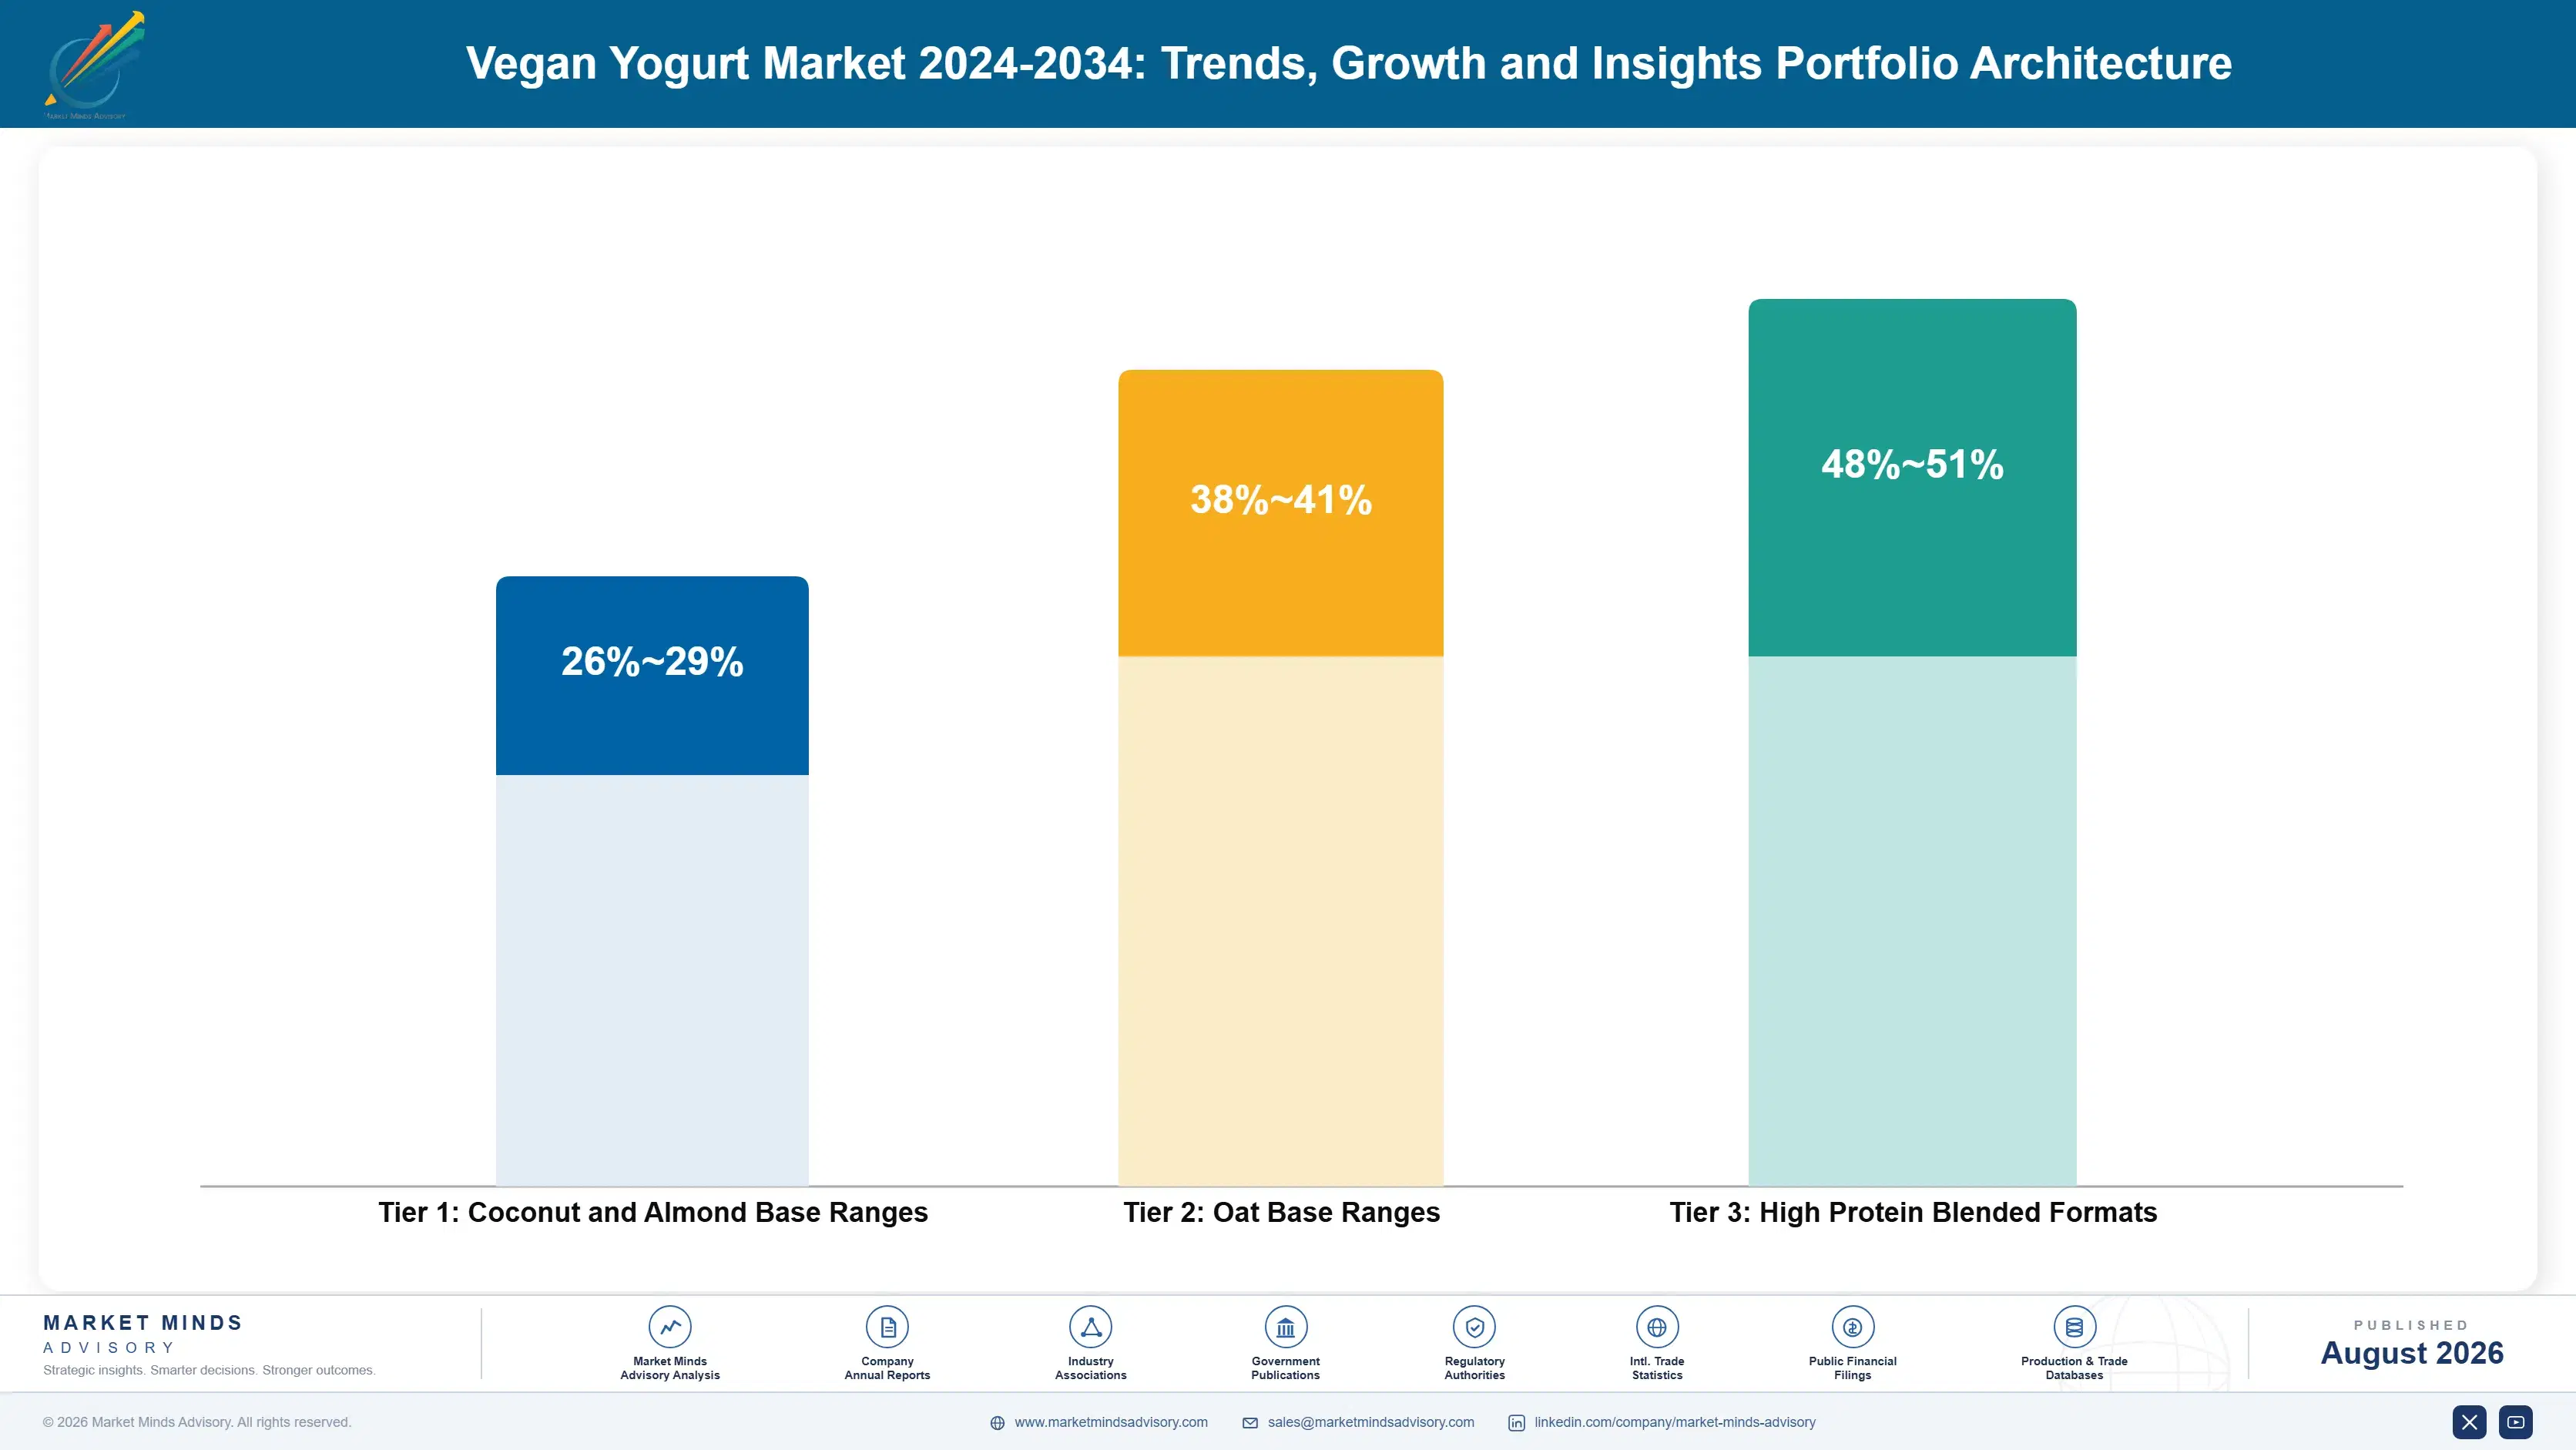
Margin architecture follows base cost and claim strength together. Coconut and almond bases carry the highest input cost and an increasingly weak nutritional claim, which is an uncomfortable combination. Oat sits in the middle on both counts and carries the strongest consumer familiarity. Pea and legume bases cost more in protein content and support the strongest claim, which allows pricing that recovers it and then some.
The tension is that the base consumers recognise is not the base that defends a premium. Coconut built the category and remains what many shoppers picture, while delivering roughly a third of dairy protein and inviting exactly the comparison that undermines the purchase. Pea protein wins the panel comparison and carries a flavour note requiring masking systems that lengthen an ingredient list already under scrutiny. Nothing available solves both problems cleanly.

High value pools concentrate in high protein blended formats and in single serve premium positioning, both of which sell on a nutritional claim rather than on ethical framing. Everything competing purely on plant based positioning faces retailer own brand demonstrating that a 62% premium is unnecessary. That pressure has arrived first in exactly the bases with the weakest nutritional argument behind them.

Coconut and Almond Base Ranges

The bases that built the category, carrying high input cost, tropical or Californian sourcing risk and an increasingly weak protein claim. Retailer own brand pressure has arrived here first and shows no sign of easing.
Gross Margin: 26-29%

Oat Base Ranges

Oat formats delivering credible texture without nut or soy allergen declarations, supported by consumer familiarity transferred from the beverage category. Margin holds on temperate sourcing stability and on channel access nut bases cannot reach.
Gross Margin: 38-41%

High Protein Blended Formats

Pea and legume protein bases, frequently blended with oat, supporting a nutrition claim that survives direct comparison with dairy. Margin is the best available because the claim justifies pricing rather than merely explaining it.
Gross Margin: 48-51%
vegan-yogurt-market-trends-growth-portfolio-architecture-1787641377300

High-value Sub-segments and Strategic Watch-out

Oat Based Yogurt

The fastest growing base at 14.7%, winning simultaneously on texture, allergen status and consumer familiarity carried over from oat beverages. Protein content remains the weakness, which is why blending with pea protein has become the standard formulation response among manufacturers taking share. Blending answers it directly.
Gross Margin: 38-41%

Pea and Legume Protein Yogurt

Second fastest at 12.6% and the only base whose nutrition panel stands direct comparison with dairy yogurt. Flavour masking is the technical difficulty, adding both cost and ingredient list length to a category where consumers increasingly read the declaration carefully. Cost follows the masking system.
Gross Margin: 48-51%

Coconut Based Yogurt

Growing at 8.2% and losing share steadily, since it delivers roughly a third of dairy protein while carrying the highest input cost in the category. It built this market and remains what many shoppers picture, which is now working against it rather than for it.
Gross Margin: 26-29%

Soy Based Yogurt

Growing at only 4.2% in Western markets while remaining entirely ordinary across East Asia, where fermented soy carries no novelty and needs no explanation. Allergen declarations and lingering consumer wariness limit it elsewhere, despite protein content that would answer the category's main criticism. Nothing looks likely to change that.
Gross Margin: 30-33%

How Households Enter and Stay

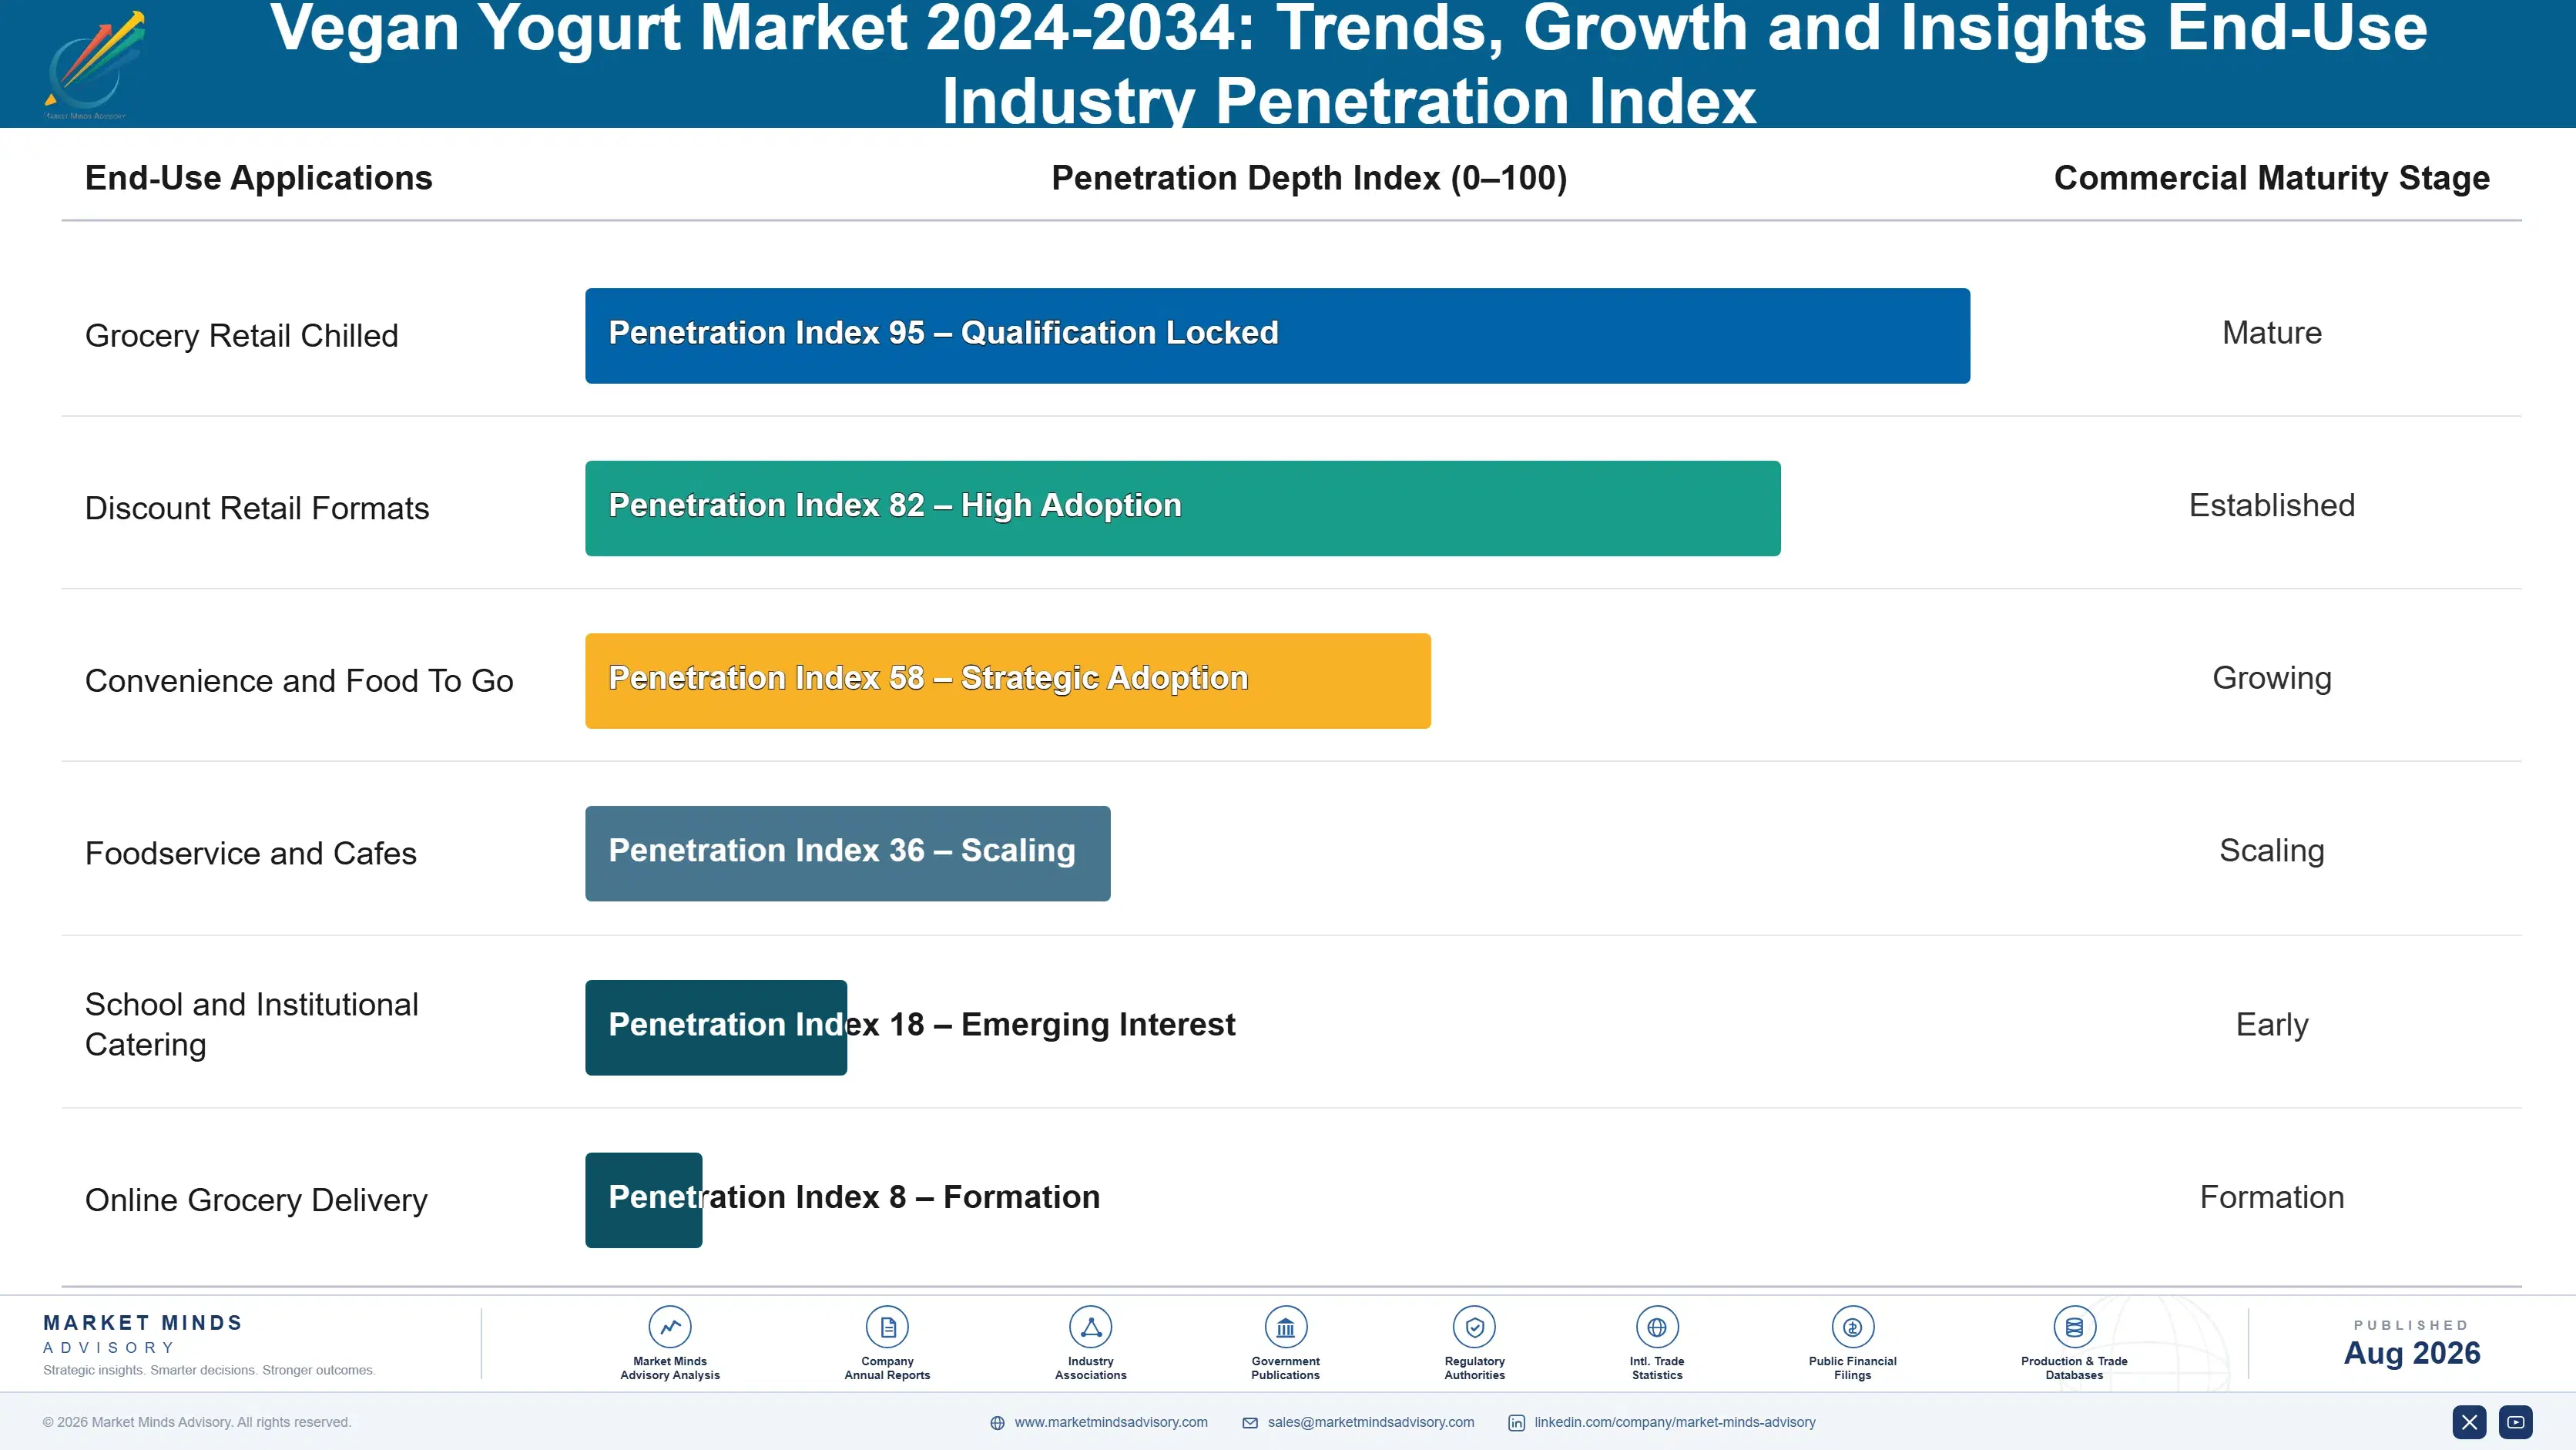
Penetration rather than frequency defines this category at its current stage. Household penetration sits near 17% in developed markets, so more than four in five households have never bought a pot, and the growth available from converting them exceeds anything available from persuading current buyers to eat more. That makes trial mechanics and sampling worth more than loyalty programmes aimed at the converted.
Stickiness varies by why the household entered. Buyers with a diagnosed dairy intolerance or allergy are the stickiest by a wide margin, because the alternative is not eating yogurt at all, and they consume with dairy category frequency. Ethically motivated buyers are stickier than average and small in number. Health motivated buyers are loosest, since a coconut pot delivering a third of dairy protein loses them permanently.

The decision has moved to the back of the pack. Purchases were once driven by front of pack plant based framing and a sustainability association that required no verification from anybody. Buyers now compare protein content, added sugar and ingredient list length against the dairy yogurt sitting a metre away on the same chilled shelf. That shift punishes the formulations this category was built on.
vegan-yogurt-market-trends-growth-end-use-penetration-index-1787641377804

Where This Category Rewards Effort

These are among the four positions where our research anticipates prominent divergence between winners and laggards over the coming forecast period. Each is grounded in the demand model, the regulatory perimeter, and the announced capacity pipeline.
01 / PROTEIN CLAIM PRIORITY

The panel comparison decides repeat purchase now

Coconut yogurt delivers roughly a third of the protein dairy provides per serving, which is acceptable in a dessert and indefensible in a product bought for health reasons by a consumer reading the back of the pot. Pea and legume bases grow at 12.6% and oat at 14.7% against a market rate of 9.8% because they survive that comparison, and retailers have reallocated facings accordingly. Blending pea protein into oat bases is now the standard response among every manufacturer actually taking share in this category.
02 / FERMENTATION CHEMISTRY ACCESS

Added sugar is a supply agreement, not research

Plant substrates contain no lactose, so roughly 4.2 grams of sugar per serving gets added purely to feed the cultures, and that declaration sits on packaging sold almost entirely on health positioning. Culture houses developing strains that ferment plant sugars and starches directly hold the answer, and the capability sits with a handful of specialist suppliers rather than with any food manufacturer. Exclusivity terms on those supply agreements will matter more than anything happening inside a manufacturer's own laboratory over the next five years.
03 / PENETRATION OVER FREQUENCY

Four in five households have never bought once

Household penetration sits near 17% across developed markets, which means the overwhelming majority have never purchased the category at all and repeat rate is not yet the binding constraint on growth. Germany grows at 15.4%, faster than any market covered, and German retail range expansion demonstrated clearly that availability rather than consumer willingness had been the real limit. Trial mechanics, single serve formats and sampling all reach non buyers, while loyalty programmes work the considerably smaller opportunity among people who already converted.
04 / BASE SOURCING RESILIENCE

Temperate crops beat tropical and Californian exposure

A portfolio weighted toward almond carries Californian water allocation risk that no manufacturer can hedge, and one weighted toward coconut carries typhoon and plantation age exposure concentrated in very few origins. Oat and pea draw on crops grown across Northern Europe, Canada and China, which spreads that risk considerably and happens to align with where consumer preference is already moving. That makes base mix an unusually rare decision that improves both supply resilience and commercial position at exactly the same time.

Engagement Snapshot From the Field

A live engagement with an industry participant carrying material or product regulatory and market exposure ahead of a defining policy shift, showing how our research translates into a defensible multi-year portfolio strategy.
MARKET MINDS ADVISORY · CLIENT ENGAGEMENT SUMMARY
Vegan Yogurt 2024-2034: Trends, Growth and Insights Producer Strategic Portfolio Review and Transition Roadmap 2026·Investment Scenario on Vegan Yogurt 2024-2034: Trends, Growth and Insights Exposure Evaluation 2025-26
CLIENT PROFILE
A plant based dairy manufacturer producing coconut and almond based yogurt for retail across six European markets, with roughly 74% of volume in coconut. Annual revenue was approximately 168 million dollars (client-reported, unverified by MMA). No oat or legume protein capability existed in the production estate, and retailer own brand ranges had recently expanded in three of the six markets served.
STRATEGIC CHALLENGE
Volume had grown while share fell for six consecutive quarters, as oat and high protein formats took the growth the company had assumed was its own. Management wanted to know whether to reformulate, invest in new base capability, or defend coconut on brand strength. The commercial team believed the issue was marketing and the technical team disagreed.
MMA APPROACH
MMA modelled purchase decisions against nutrition panel content, price and base type using structured choice research among category buyers and lapsed buyers. Capital requirements for oat and legume base capability were costed against reformulation of existing lines. Forty-seven expert interviews with retail category buyers, formulation specialists and culture suppliers established what actually drives listing decisions and what technology is genuinely available.
KEY FINDINGS
  1. Protein content ranked first in purchase criteria among 68% of category buyers, well ahead of plant based positioning which ranked first for only 14% of them.
  2. Lapsed buyers in 29 of the 47 interviews described reading the nutrition panel and concluding the product was a dessert rather than the health purchase they intended.
  3. Adding pea protein isolate to existing coconut lines required no capital investment and raised protein content enough to change the panel comparison materially.
  4. Culture strains fermenting plant substrates without any added sugar were available under supply agreement, with exclusivity terms negotiable for committed annual volume.
CLIENT PROFILE
A plant based dairy manufacturer producing coconut and almond based yogurt for retail across six European markets, with roughly 74% of volume in coconut. Annual revenue was approximately 168 million dollars (client-reported, unverified by MMA). No oat or legume protein capability existed in the production estate, and retailer own brand ranges had recently expanded in three of the six markets served.
STRATEGIC CHALLENGE
Volume had grown while share fell for six consecutive quarters, as oat and high protein formats took the growth the company had assumed was its own. Management wanted to know whether to reformulate, invest in new base capability, or defend coconut on brand strength. The commercial team believed the issue was marketing and the technical team disagreed.
MMA APPROACH
MMA modelled purchase decisions against nutrition panel content, price and base type using structured choice research among category buyers and lapsed buyers. Capital requirements for oat and legume base capability were costed against reformulation of existing lines. Forty-seven expert interviews with retail category buyers, formulation specialists and culture suppliers established what actually drives listing decisions and what technology is genuinely available.
KEY FINDINGS
  1. Protein content ranked first in purchase criteria among 68% of category buyers, well ahead of plant based positioning which ranked first for only 14% of them.
  2. Lapsed buyers in 29 of the 47 interviews described reading the nutrition panel and concluding the product was a dessert rather than the health purchase they intended.
  3. Adding pea protein isolate to existing coconut lines required no capital investment and raised protein content enough to change the panel comparison materially.
  4. Culture strains fermenting plant substrates without any added sugar were available under supply agreement, with exclusivity terms negotiable for committed annual volume.
RECOMMENDED STRATEGY
Phase 1: Phase one: fortify existing coconut lines with pea protein isolate immediately, since it needs no capital and 68% of buyers rank protein first. Phase 2: Phase two: negotiate exclusive access to plant substrate culture strains, removing the added sugar declaration that undermines every health claim made. Phase 3: Phase three: invest in oat base capability over three years, since oat grows at 14.7% and carries no allergen restriction on distribution.
OUTCOME
The client fortified its coconut range within two quarters and secured a two year exclusive on plant substrate cultures the following year. Share stabilised across four of the six markets, and the reformulated range carried a protein claim on front of pack that own brand competitors could not match (client-reported, unverified by MMA).

Frequently Asked Questions

Foundational context covering the market sizes, CAGR, scope, country, region and competition that inform every finding below. This section is provided to cover basics and most often pre-purchase conversations, answered from the MMA Primary Research Dataset.

What is the current size of the Vegan Yogurt Market?

The market was valued at 4.2 billion dollars in 2025, covering fermented plant based yogurt across coconut, almond, oat, soy, cashew and legume bases. It reaches an estimated 4.61 billion dollars during 2026.

How large will the Vegan Yogurt Market be by 2036?

MMA forecasts 11.74 billion dollars by 2036, an increase of 7.13 billion dollars over the 2026 base. That represents an expansion multiple of 2.55 times across the forecast period.

What is the CAGR for the Vegan Yogurt Market 2026 to 2036?

The base case compound annual growth rate is 9.8%, with a bull case of 11.0% and a bear case of 8.6%. Culture technology and the dairy price gap separate those scenarios.

Which segment is growing fastest?

Oat based yogurt grows at 14.7%, half again the market rate of 9.8%, on texture, allergen status and consumer familiarity. Pea and legume protein bases follow at 12.6%.

Who are the major companies in the Vegan Yogurt Market?

Danone, Chobani, General Mills, Lactalis and Oatly lead on retail volume across chilled distribution networks in every major market. Together they account for 46% of the market.

Which country is growing fastest?

Germany grows fastest at 15.4%, on the deepest plant based retail range in Europe and consumer trial rates higher than any other developed market records.

Report Segmentation Architecture

The full report scope spans multiple orthogonal segmentation dimensions, with cross-tabulated demand data provided for each dimension pair. Coverage extends further to regional breakdowns, trend trajectories, and the competitive detail needed to support segment-level decision-making.

By Plant Base

  • Coconut Based Yogurt
  • Almond Based Yogurt
  • Oat Based Yogurt
  • Soy Based Yogurt
  • Cashew and Nut Based Yogurt
  • Pea and Legume Protein Yogurt

By End-Use Industry

  • Grocery Retail Chilled
  • Discount Retail Formats
  • Convenience and Food To Go
  • Foodservice and Cafes
  • School and Institutional Catering
  • Online Grocery Delivery

By Commercial Dimension

  • Branded Retail Ranges
  • Retailer Own Brand Supply
  • Contract Manufacturing
  • Single Serve Formats
  • Multipack Value Positioning
  • Export and Distributor Channels

By Region

  • North America
  • Western Europe
  • East Asia
  • South Asia and Pacific
  • Latin America
  • Middle East and Africa
  • Eastern Europe

Scope, Methodology, and Coverage

Every figure in this report is reproducible from documented input assumptions. The scope below maps the historical period, the forecast horizon, the segmentation dimensions, and the countries covered, alongside the underlying primary and qualitative methodology.
Historical Period
2020 to 2025
Forecast Period
2026 to 2036
Base Year
2025 (USD billions; MMA Primary Research Dataset, August 2026)
Market Definition
Fermented plant based yogurt and yogurt alternative products containing live cultures, sold through retail and foodservice worldwide, covering coconut based, almond based, oat based, soy based, cashew and nut based, and pea and legume protein bases across spoonable, drinkable and multipack formats. Measured at retail selling value. Dairy yogurt, unfermented plant milk beverages, plant based desserts without live cultures, dairy blends containing any milk, and plant based cheese and cream products are excluded from scope.
Quantitative Units
USD billions (current prices); tonnes sold; USD per hundred grams by plant base and format
Segmentation Dimensions
Plant base; end-use industry; commercial dimension; region
Regions Covered
North America, Western Europe, East Asia, South Asia and Pacific, Latin America, Middle East and Africa, Eastern Europe
Countries Covered
Germany, United Kingdom, Netherlands, Sweden, France, Spain, Italy, United States, Canada, China, Japan, South Korea, India, Australia, Thailand, Brazil, Chile, Israel, South Africa, Poland
Key Companies Profiled
Danone, Chobani, General Mills, Lactalis, Oatly, Nestle, Valio, Arla Foods, Ehrmann, Muller Group, Bel Group, Califia Farms, Kite Hill, Forager Project, Cocojune, Coyo, Vitasoy International, Marusan-Ai, Yakult Honsha, Sodiaal
Quantitative Methodology
Primary survey, n=3,800 respondents, Q4 2025, six countries; demand-side model with trade association cross-validation
Qualitative Methodology
47 expert interviews, Q4 2025; applied to validate demand model assumptions, identify emerging dynamics, and assess competitive positioning
Report Format
PDF and XLSX data workbook (Word format preview document)
Publisher
Market Minds Advisory
Report Code
MMA-2026-AGR-203
Published
August 2026
Contact
sales@marketmindsadvisory.com | www.marketmindsadvisory.com

Purchase the full Vegan Yogurt Market 2024-2034: Trends, Growth and Insights Report (2026 to 2036).

The full report treats vegan yogurt as a category where the base ingredient is the product, since yogurt is eaten alone and the substitution is obvious with every mouthful, which is why it kept growing after plant milk flattened. It sizes all six plant bases independently through 2036, models purchase decisions against nutrition panel content and shelf price, and maps culture technology availability for fermenting plant substrates without added sugar. Regional chapters cover all seven regions, with existing fermented plant traditions assessed separately from Western substitution demand. Competitive profiling covers 20 participants on one consistent retail volume basis.
Six plant bases sized independently through 2036
Purchase decisions modelled against nutrition panel and price
Culture technology availability mapped for plant substrate fermentation
Allergen channel restrictions quantified by base and market
Retailer own brand pressure assessed by base and region
Twenty participants profiled on one consistent volume basis

Built For The People Who Decide

From boardroom strategy to bench-side execution, this report is read cover-to-cover by leaders shaping the next decade of their industry, turning demand scenarios, market dynamics and valuation benchmarks into decisions.
CXOs/ Presidents/ VPs/ Managers
M&A and Corporate Development
Strategy Teams and R&D Heads
Procurement and Product Directors
Regulatory and Compliance Leaders
Investor Relations and Equity Analysts