Market Minds Advisory
Vegan Fast Food Market 2024-2034: Trends, Growth and Insights

Vegan Fast Food Market 2024-2034: Trends, Growth and Insights: Vegan Fast Food: Flexitarian Demand, Kitchen Throughput Limits and the Delisting Nobody Forecasts

Roughly 87% of plant based fast food is bought by people who eat meat, which means the item is competing against the chicken sandwich beside it rather than against any other vegan option.

Lead Analyst

Lisa Gevelber

Published

August 2026

Make Smarter Decisions with Customized Research Insights

Request a free sample report and evaluate market opportunities, growth trends, and competitive dynamics relevant to your business needs.

2025 MARKET VALUE$18.4BMarket Size 2025
2036 FORECAST VALUE$45.6BBase Case , 2026 to 2036
CAGR 2026 TO 20368.6 %Bull 9.8% / Bear 7.4%
INCREMENTAL OPPORTUNITY$25.6BNet 10- year value creation
EXPANSION MULTIPLE2.28x2036 value over 2026 base
Strategic Levers
M&A Pipeline
Regional Outlook
Country Rankings
Competitive Intelligence
Segmental Deep-dive
Call-Us : 91 93563 13602

Executive Snapshot and Market Trajectory.

This category was built on a customer who barely exists in the numbers. Vegans are a low single digit percentage of most Western populations, and no chain adds menu complexity for two percent of traffic. What made it work was the meat eater buying occasionally.
Roughly 87% of plant based fast food purchases are made by people who also eat meat, and that changes the competitive question entirely. The item is not competing against other vegan options; it is competing against the chicken sandwich on the same menu, at an 18% price premium, and it loses that comparison more often than the industry admits. Plant based chicken analogues grow fastest at 12.9%, half again the market rate of 8.6%.
The reason chicken analogues lead is not taste but throughput. Every added item costs a quick service kitchen speed, and a product needing a separate fryer or griddle zone taxes every order rather than just its own. Chicken analogues cook in the existing chicken process. Roughly 31% of plant based launches are delisted within two years, and slow line times explain more of that than poor sales do.
Market Definition
Fully plant based menu items sold through quick service and fast casual restaurant operators, covering plant based burgers and sandwiches, plant based chicken analogues, plant based pizza and Italian formats, plant based bowls, wraps and salads, dairy free desserts and beverages, and plant based breakfast items. Measured at foodservice sales value. Retail packaged plant based products, vegetarian items containing dairy or egg, and full service restaurant menus are excluded.
Base Year Value
$18.4B in 2025 (MMA Primary Research Dataset, August 2026)
Forecast Period
2026 to 2036, eleven discrete annual values
CAGR
8.6% base case. Bull 9.8%. Bear 7.4%.
Fastest Growth Segment
Plant-Based Chicken Analogues: 12.9% CAGR
Fastest Growth Country
India: 17.4% CAGR
Fastest Growth Region
South Asia and Pacific: 10.8% CAGR
Largest Region
Western Europe: 28% of 2025 global value
Market Leaders
McDonald's, Yum Brands, Restaurant Brands International, Domino's Pizza, Subway. Source: MMA Primary Research Dataset, July 2026.
Primary Survey
n=3,800 procurement and R&D decision-makers, Q4 2025, six countries
Methodology
Demand-side build-up, cross-validated against public data, 47 expert interviews

Vegan Fast Food Market Forecast Scenarios

vegan-fast-food-market-trends-growth-size-forecast-scenario-1787641351735
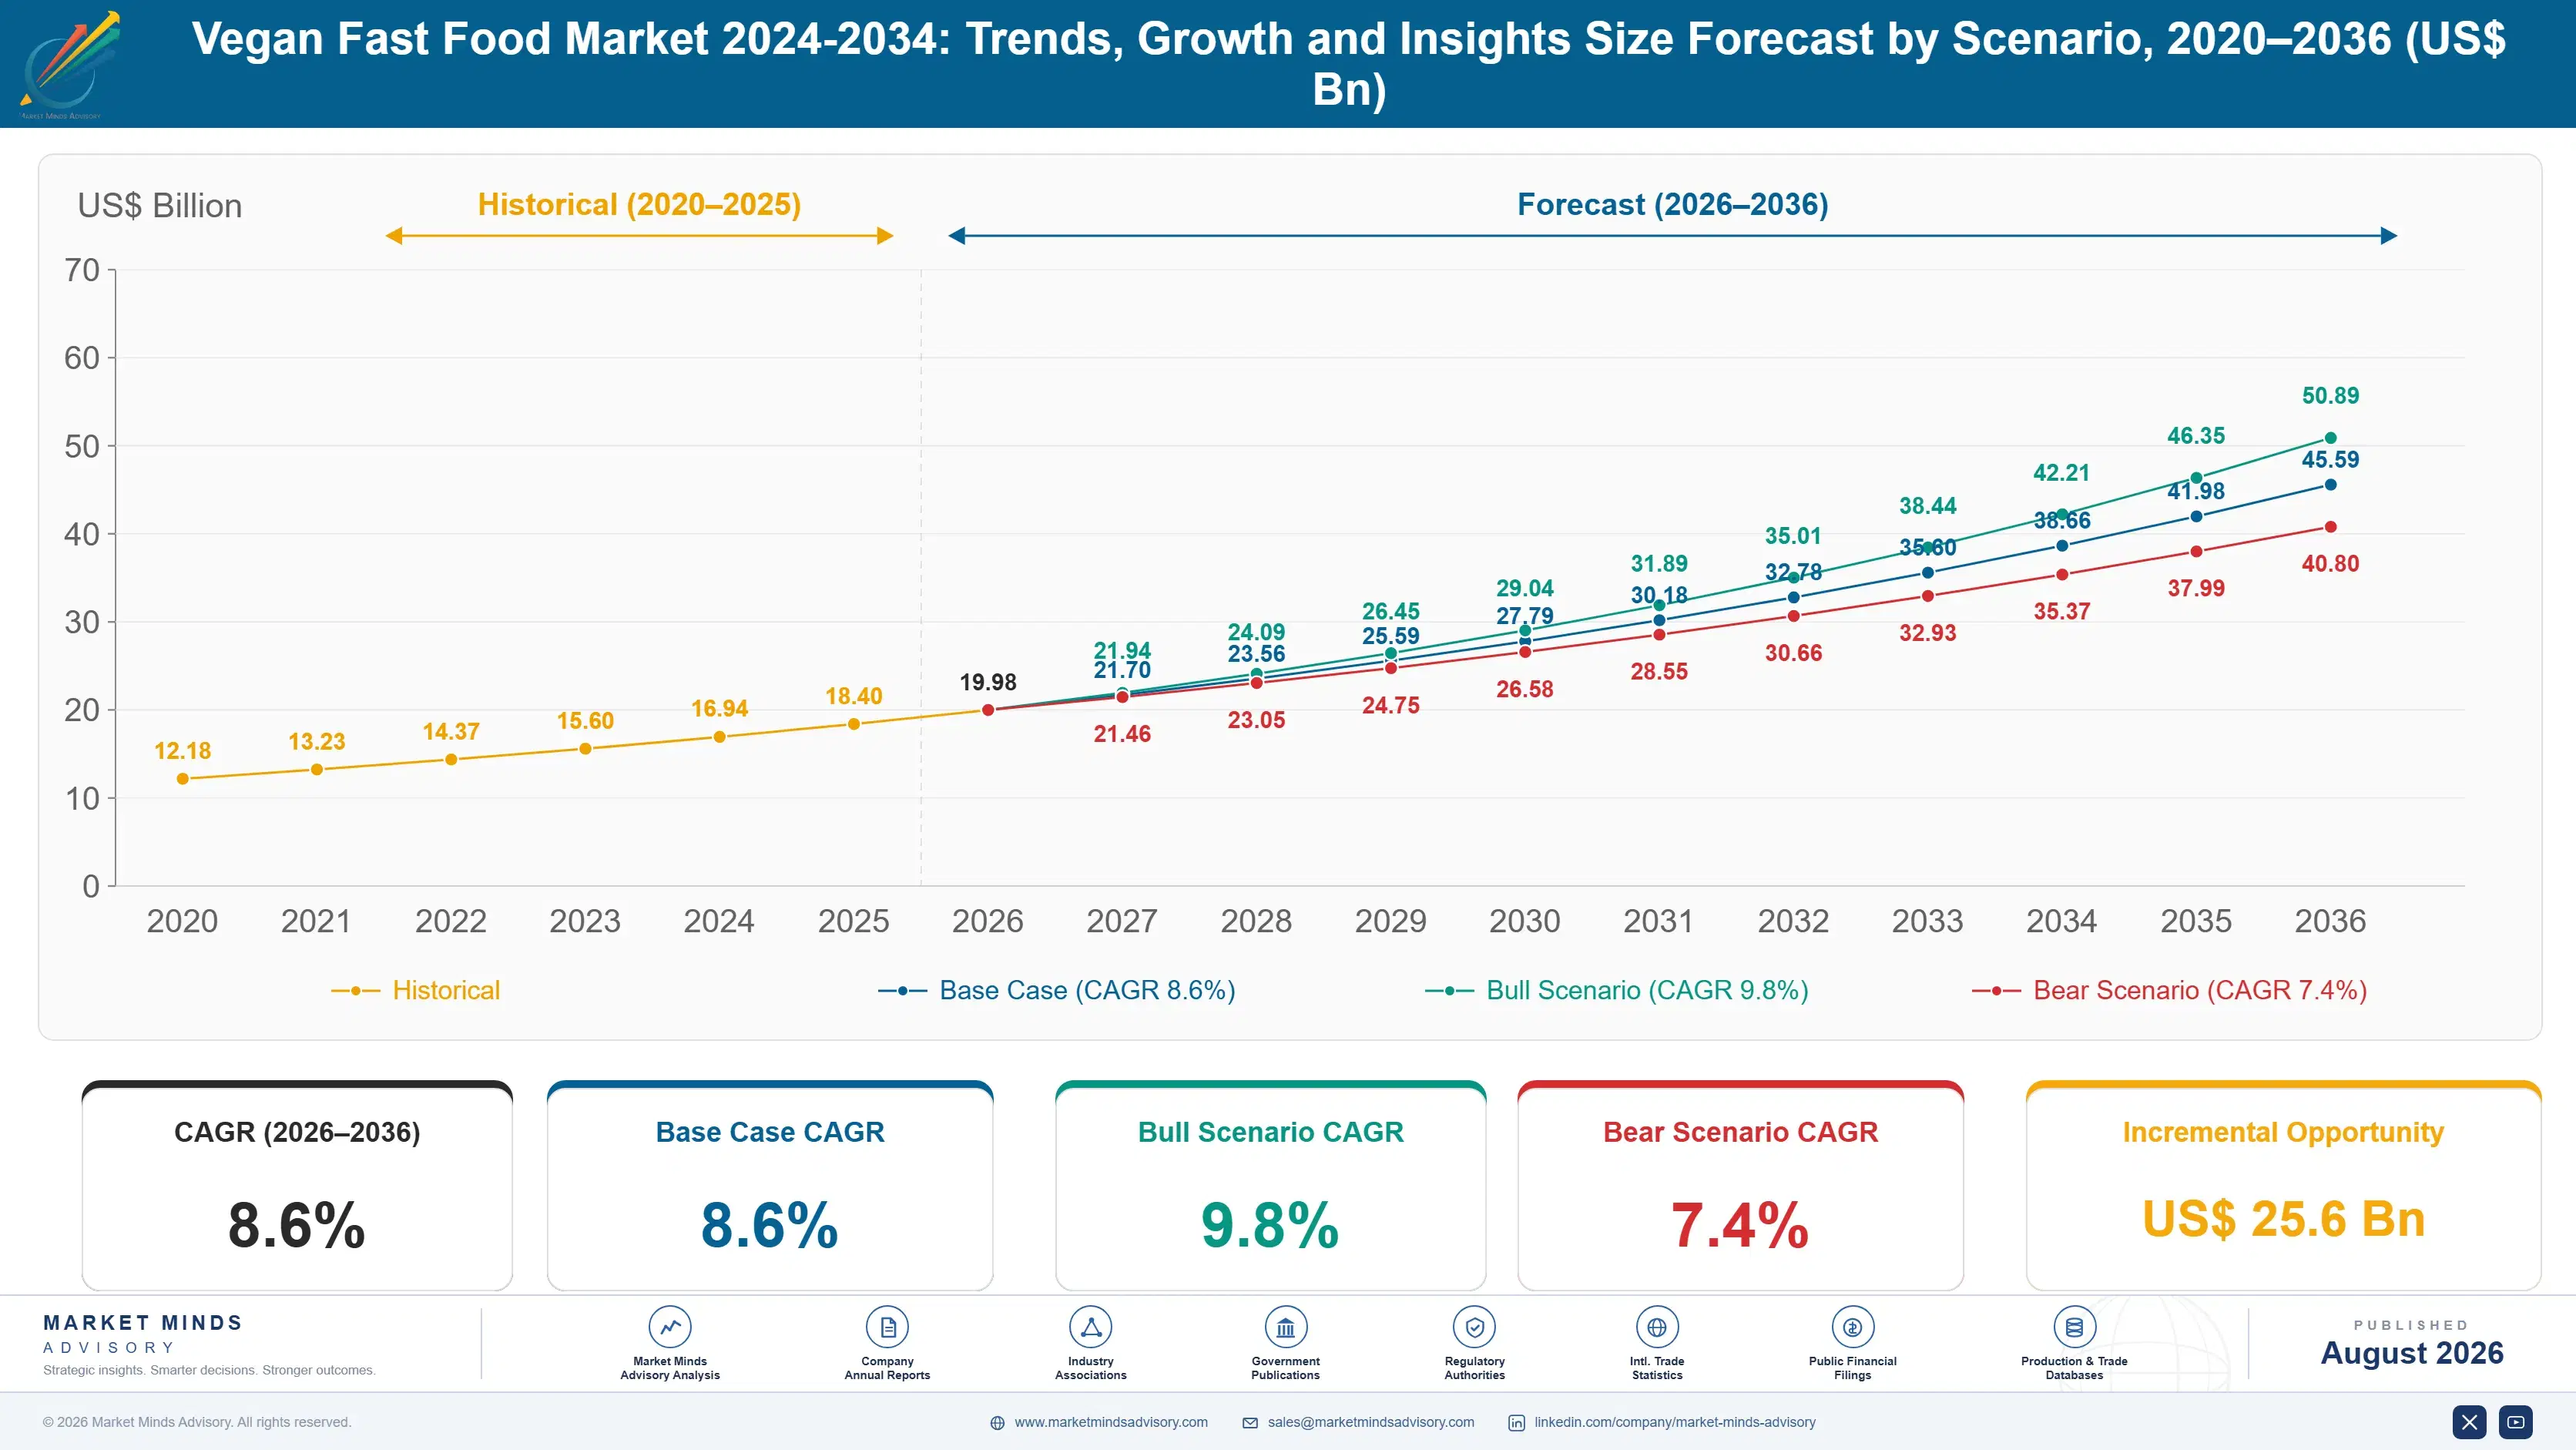
The five years to 2025 separated foodservice from retail in a way nobody predicted. Retail plant based meat declined sharply after 2021 as shoppers read long ingredient labels, while quick service volumes held because nobody reads a panel at a counter. Menu penetration kept rising even as supermarket sales fell. The 7.4% historical rate covers two categories moving in opposite directions.
The 8.6% base case rests on three mechanisms. Chicken analogues that cook in existing kitchen processes remove the throughput objection that kills most plant based menu items, which is what converts trial into wide chain adoption. Dairy free beverage and dessert options continue expanding in coffee and dessert formats where substitution is straightforward and margins improve. And Asian markets with large existing vegetarian populations are converting quick service menus, with India expanding fastest of anywhere covered.
The 9.8% bull case turns on price parity with meat equivalents, since the 18% premium is the single most cited reason flexitarian customers do not repeat. The 7.4% bear case is menu simplification: quick service chains under labour pressure cut items to protect speed, and plant based lines with 29% repeat purchase are usually near the top of the list.

The Category That Sells to Meat Eaters

The customer this category was designed for is not the customer buying from it. Vegans are a small single digit percentage of most Western populations and roughly 87% of plant based fast food is bought by people who eat meat. The item competes on the menu it sits on, against a chicken sandwich costing 18% less.
TOP FIVE CONCENTRATION22%Combined plant based menu sales held by largest operators
FLEXITARIAN PURCHASE SHARE87%Plant based items bought by people who eat meat
MENU PENETRATION RATE64%Quick service outlets carrying any fully plant based item
PRICE PREMIUM VERSUS MEAT18%Typical uplift over the comparable meat menu item
REPEAT PURCHASE RATE29%Customers ordering a plant based item again within quarter
MENU ITEM DELISTING RATE31%Plant based launches removed within two years of introduction
Retail and foodservice separated sharply after 2021. Supermarket plant based meat declined as shoppers examined long ingredient lists and ultra processed criticism reached the mainstream, while quick service volumes held. Standing at a counter nobody reads an ingredient panel, and the item is simply a menu line among others. That distinction has been worth a great deal to operators and nothing to manufacturers supplying both channels.
Kitchen throughput is the constraint that actually decides menu survival. A quick service kitchen measures items per hour, and a product needing a separate fryer or dedicated griddle zone taxes every order in the queue rather than only its own. That is why roughly 31% of launches are delisted within two years, frequently while selling acceptably, and why chicken analogues that cook in existing processes lead the growth.
"Operators will tell you a plant based item was removed because it did not sell. Ask about drive through times in the same period and a different answer usually emerges, which is a considerably harder problem for a manufacturer to solve."
Director, Foodservice and Consumer Foods Practice · MMA Food Service and Consumer Foods Practice · August 2026

Market Trends

Kitchen Throughput Decides Which Items Survive Menus

Quick service operations are measured in items per hour and drive through seconds, and a plant based product needing a separate fryer, a dedicated griddle zone or a distinct holding cabinet slows every order in the queue rather than only its own. Roughly 31% of launches are delisted within two years, often while selling acceptably, and operational drag explains more of that than demand. Chicken analogues that cook in the existing chicken process grow at 12.9% against a market rate of 8.6% for exactly this reason. Manufacturers optimising for taste panels rather than kitchen workflow keep losing listings.
Market Impact: Protects traffic across 64% of outlets
Retail Decline and Foodservice Growth Have Fully Diverged

Supermarket plant based meat sales fell sharply after 2021 as shoppers examined long ingredient lists and ultra processed criticism moved into mainstream coverage, yet quick service volumes held and menu penetration continued climbing to around 64% of outlets. The difference is that a retail shopper turns the pack over and a fast food customer does not. Manufacturers supplying both channels have watched one collapse while the other grew, which has complicated capacity planning and pricing considerably. Foodservice contracts also carry volume commitments that retail listings never did, which matters more than the growth rate alone.
Market Impact: India grows at 17.4% annually

Market Opportunities and Growth Drivers

Group Ordering Carries the Plant Based Item Along

The single most reliable purchase occasion in this category is a group where one person does not eat meat and the others do, since the whole group then chooses somewhere with a plant based option. Operators call this the veto vote and it is worth far more traffic than the plant based item itself generates. A chain without any plant based line loses the entire group rather than one order, which is why menu penetration reached around 64% of outlets while repeat purchase stayed near 29%. The item is defending traffic rather than creating it.
Market Impact: Premium runs 18% above meat

Large Vegetarian Populations Convert Quick Service Menus

India grows at 17.4%, faster than any other country covered, because a substantial share of the population already avoids meat and quick service expansion is reaching them for the first time. Converting an existing vegetarian item to fully plant based requires removing dairy rather than replacing meat, which is a smaller reformulation than Western operators face and often improves shelf life. Southeast Asian markets with Buddhist vegetarian traditions follow similar patterns. The addressable population in these markets is measured in hundreds of millions rather than in single digit percentages. Reformulation there is genuinely easier.
Market Impact: Threatens 64% of current listings

Market Restraints and Challenges

Price Premium Blocks Repeat Purchase From Flexitarians

A plant based item typically carries an 18% premium over the comparable meat product on the same menu, and repeat purchase sits near 29% against far higher rates for established meat lines. The root cause is ingredient cost and volume: protein isolates and specialist binders cost more than mechanically recovered chicken, and nobody is producing them at the scale that would close the gap. Commercially this caps the category well below where trial rates suggest it should sit. Operators respond with value meal bundling and promotional pricing, which works while it runs and stops working immediately afterwards.
Market Impact: Delisting removes 31% of launches

Ultra Processed Criticism Reaches Menu Boards Eventually

The ingredient list criticism that collapsed retail plant based meat has not yet reached quick service in the same way, because a counter customer does not read a pack. That protection is temporary rather than permanent, since menu transparency requirements are expanding and several operators already publish full ingredient information online. The root cause is formulation: matching meat texture requires methylcellulose, protein isolates and flavour systems that read badly in a list. Manufacturers are responding with shorter ingredient decks built on whole food bases, which cost more and perform less convincingly.
Market Impact: Menu penetration reaches 64% of outlets
3 additional market trends, 4 additional growth drivers, and 2 additional restraints and challenges are covered in the full report. Contact sales@marketmindsadvisory.com to access the complete intelligence.

Segment CAGR and Growth Architecture

Segmentation follows menu category, since category determines which kitchen process the item uses and therefore whether an operator can carry it without losing speed. Six categories cover the field, from burgers built for a griddle to beverages requiring nothing more than a different carton. Growth sits where existing kitchen processes already handle the product.
vegan-fast-food-market-trends-growth-market-share-analysis-1787641352288

Plant-Based Chicken Analogues

Breaded and unbreaded plant protein formats built to cook in the same fryer and holding equipment that quick service chicken already uses. At 12.9% this is the fastest growing category in the market, half again the market rate of 8.6%, and operational compatibility rather than flavour explains the lead. A product that drops into an existing basket costs no throughput, needs no new equipment and adds no station to a kitchen already running at capacity. Chicken is also the easiest meat to imitate convincingly, since texture expectations are lower than for whole muscle beef and sauce carries much of the flavour. Delisting rates in this category run well below the market average.
CAGR 12.9%

Dairy-Free Desserts and Beverages

Plant milk beverages, dairy free frozen desserts and shakes served through equipment that requires only a substitution rather than a new process. Growth of 10.8% is second fastest in the market, and margins frequently improve rather than worsen, since operators charge a supplement for plant milk that exceeds the ingredient cost difference. Adoption in coffee formats has been near universal and largely uncontroversial, which is unusual in this category. The main operational question is dedicated line cleaning for allergen management rather than throughput, and most beverage equipment handles it without meaningful delay. Consumer resistance here is lower than anywhere else in the category. Operators treat it as a substitution rather than as a plant based listing at all.
CAGR 10.8%
Full segment breakdown across 6 segments available in the complete report.

Regional Architecture and Country Demand Map

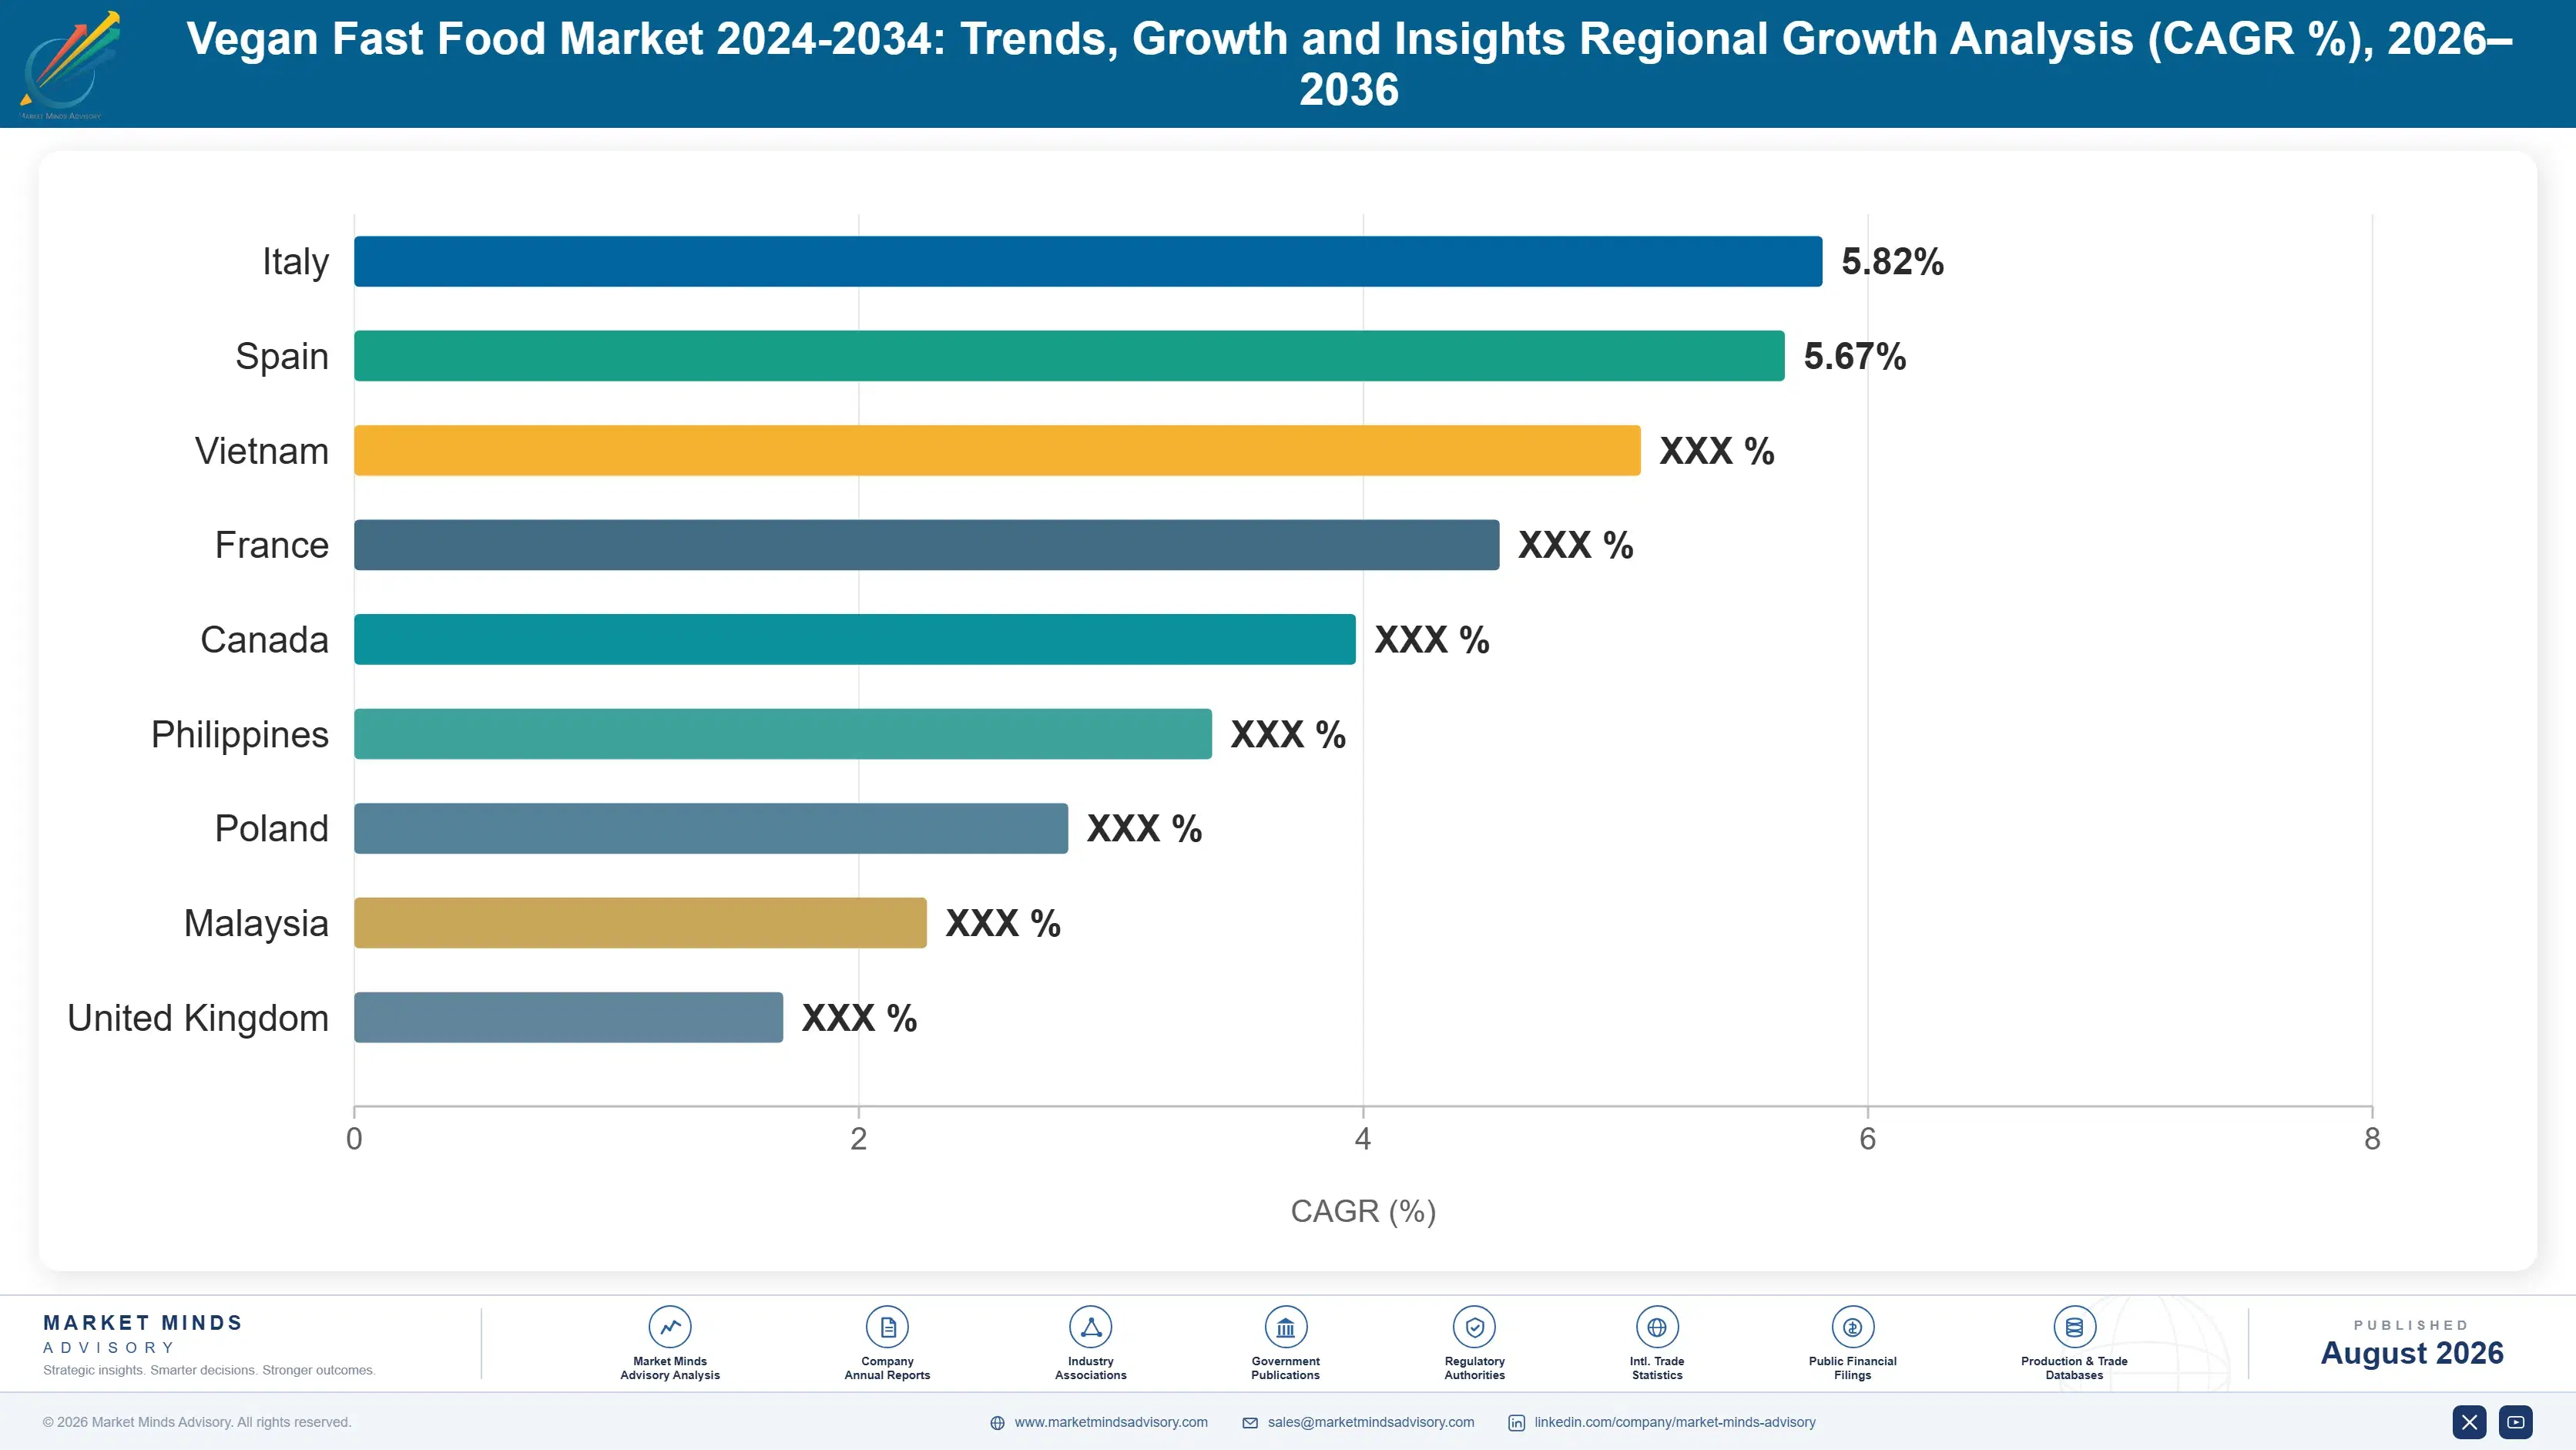
Western Europe holds the largest share at 28%, with the deepest menu penetration and the most developed plant based quick service offering anywhere. North America follows on scale rather than penetration. India grows fastest of any country covered at 17.4%. Repeat purchase remains the category weakness everywhere.

Western Europe

Menu penetration rather than population gives this region its 28% share. British quick service chains carry the most developed plant based ranges anywhere, with dedicated vegan menus at several major operators and bakery chains building entire product lines around them. German consumers record the highest plant based product trial rates in the region and German operators have responded with permanent rather than promotional listings. Dutch and Scandinavian markets follow closely with strong flexitarian populations. Southern European adoption is considerably slower, constrained by culinary traditions where plant based substitution reads as compromise. Growth of 7.0% is the lowest of the seven regions, since penetration is already high and the remaining upside is repeat purchase rather than availability.
Share: 28% | CAGR: 7.0% (2026 to 2036)

North America

Scale rather than penetration explains this 26% share. American quick service volume is enormous and even modest plant based menu representation produces substantial absolute sales, but adoption has been uneven and delisting rates run above the global average. Several major chains launched plant based lines with considerable publicity and withdrew them within two years, usually citing sales while operators privately discussed drive through times. The 18% price premium bites harder in a market where value messaging dominates quick service competition. Canadian adoption has been steadier, with permanent listings at several chains. Growth of 8.0% reflects a market that trials heavily and repeats less than operators hoped it would. Value messaging dominates this market completely.
Share: 26% | CAGR: 8.0% (2026 to 2036)
Regional intelligence for 5 additional markets available in the complete report: East Asia, South Asia and Pacific, Latin America, Middle East and Africa, Eastern Europe. Contact sales@marketmindsadvisory.com.
vegan-fast-food-market-trends-growth-country-cagr-analysis-1787641352836

Where Menu Position Is Actually Won

Nothing here is won on a taste panel, because the customer is a meat eater comparing the item to the chicken sandwich beside it. Value accrues to whoever fits an existing kitchen process, whoever closes the price gap, and whoever reaches populations already eating this way. Four routes carry weight, and three of them are operational rather than culinary.

Build for the Fryer That Is Already There

A quick service kitchen measures items per hour, and any product needing a separate fryer, griddle zone or holding cabinet slows every order rather than only its own. That operational drag explains most of the 31% of plant based launches delisted within two years, frequently while selling acceptably. Chicken analogues that drop into existing baskets grow at 12.9% against a market rate of 8.6% for precisely this reason. Manufacturers optimising formulations for taste panels while ignoring kitchen workflow keep winning trials and losing listings, which is an expensive way to learn the lesson.
Market Impact: Avoids the 31% two year delisting rate entirely

Close the Price Gap Before Improving the Product

The 18% premium over a comparable meat item is the most cited reason flexitarian customers do not repeat, and repeat purchase near 29% is the number that decides whether a listing survives a menu review. Protein isolates and specialist binders cost more than mechanically recovered chicken, and nobody is producing them at a scale that closes the gap. Volume commitments through foodservice contracts are the practical route, since they justify dedicated capacity that retail listings never did. Price parity would do more for this category than any reformulation currently in development.
Market Impact: Removes the 18% price premium blocking repeat purchase

Sell the Veto Vote, Not the Vegan Customer

Vegans are a small single digit percentage of most Western populations, and roughly 87% of plant based fast food is bought by people who eat meat. The reliable occasion is a group choosing where to eat when one member does not eat meat, and a chain without any plant based option loses the whole group rather than one order. That is why menu penetration reached around 64% of outlets while repeat purchase stayed near 29%. Operators selling the item as traffic defence rather than as a growth product make better menu decisions and keep listings longer.
Market Impact: Defends group traffic across 64% of all outlets

Follow Existing Vegetarian Populations Into Quick Service

India grows at 17.4%, faster than any country covered, because hundreds of millions of people already avoid meat and quick service expansion is reaching them for the first time. Converting an existing vegetarian item to fully plant based means removing dairy rather than replacing meat, which is a smaller reformulation and frequently improves shelf life in hot climates. Southeast Asian Buddhist vegetarian traditions support the same logic across Thailand, Vietnam and Taiwan. The addressable population in these markets is measured in hundreds of millions rather than in percentage points of a Western country.
Market Impact: Captures the 17.4% Indian national market growth rate

Who Controls the Margin Pool

This market is unusually fragmented for one with such visible participants. The top five account for 22% of plant based menu sales across operator networks, the basis applied consistently here, and no operator dominates, because plant based lines sit inside much larger menus competing on different grounds. McDonald's leads on absolute volume through scale rather than through any plant based commitment.
Competition runs on three fronts. Global chains compete on whether a plant based line survives a menu review, which is an internal contest against throughput and against other items rather than against another brand. Dedicated plant based operators compete for a small committed customer base and on urban location quality. Ingredient manufacturers compete for chain listings on cost, kitchen compatibility and volume security, which is where the real commercial battle happens.

Rankings will shift with reformulation rather than with marketing. A protein format that matches meat pricing and drops into existing equipment would change adoption faster than any campaign, and several manufacturers are working toward exactly that. The other pressure point is ingredient transparency: the criticism that collapsed retail plant based meat has not reached menu boards yet, and operators publishing full ingredient information are testing whether it will.
vegan-fast-food-market-trends-growth-company-positioning-matrix-1787641353360

Competitive Moat and Risk Dimensions

MCDONALD'S

Moat: Global Supply Chain Scale

Volume commitments across thousands of outlets allow ingredient pricing and dedicated manufacturing capacity that no smaller operator can secure, which is the only realistic route to closing the price gap against meat equivalents. Kitchen standardisation across the network also means an item validated for throughput in one market deploys everywhere without further operational testing.
MCDONALD'S

Risk: Menu Simplification Pressure

Labour cost pressure and drive through speed targets push continuously toward fewer menu items, and a plant based line with repeat purchase near 29% sits high on any simplification list. The company has launched and withdrawn plant based products in several markets already, which makes committing manufacturing capacity difficult for suppliers on either side.
GREGGS

Moat: Bakery Process Compatibility

Plant based products built around bakery processes rather than around grilling or frying avoid the throughput penalty that removes items from quick service menus, since a pastry line runs identically whatever the filling is. That has allowed permanent listings and a genuine product range where competitors have cycled through launches and withdrawals repeatedly.
GREGGS

Risk: Single Market Concentration

The position rests almost entirely on one national market with high plant based penetration and correspondingly limited remaining upside, since Western Europe grows at 7.0%, the slowest of the seven regions. Expansion into markets with different bakery traditions and lower flexitarian populations has proved considerably harder than the domestic success suggests.

Players Tracked

Prominent Players

McDonald's
Yum Brands
Restaurant Brands International
Domino's Pizza
Subway

Other Key Players

Starbucks
Chipotle Mexican Grill
Greggs
Pret A Manger
Nando's
Papa John's
Wendy's
Shake Shack
Sweetgreen
Neat Burger
Odd Burger Corporation
Plant Power Fast Food
Veggie Grill
LEON Restaurants
Jollibee Foods

Recent Developments

FEBRUARY 2025

Global chain withdraws plant based burger from several markets

A large international quick service operator removed a plant based burger from menus across several markets, citing sales performance below expectations after a multi year trial period. Franchisees there had raised concerns about preparation time and dedicated equipment throughout the trial, which the announcement did not address.
Signal: Withdrawal announcements always cite sales performance while the franchisee complaints almost invariably concern kitchen throughput instead
MAY 2025

Ingredient manufacturer launches fryer compatible chicken analogue

A plant protein manufacturer launched a breaded chicken analogue formulated to cook in standard quick service fryer baskets at existing temperatures and timings, removing the need for dedicated equipment. Chain interest concentrated on operational validation rather than on sensory testing, which several manufacturers described as a change of emphasis.
Signal: Chains are now evaluating plant based products as operations problems rather than as culinary ones entirely
SEPTEMBER 2025

Indian quick service chain expands fully plant based menu nationally

An Indian quick service operator expanded a fully plant based menu across its national network, converting existing vegetarian items by removing dairy rather than by substituting meat analogues. The reformulation improved ambient shelf life in warm conditions, which the company cited as an operational benefit alongside the market positioning.
Signal: Removing dairy is a far smaller reformulation than replacing meat and reaches a far larger population

What a Plant Based Item Costs

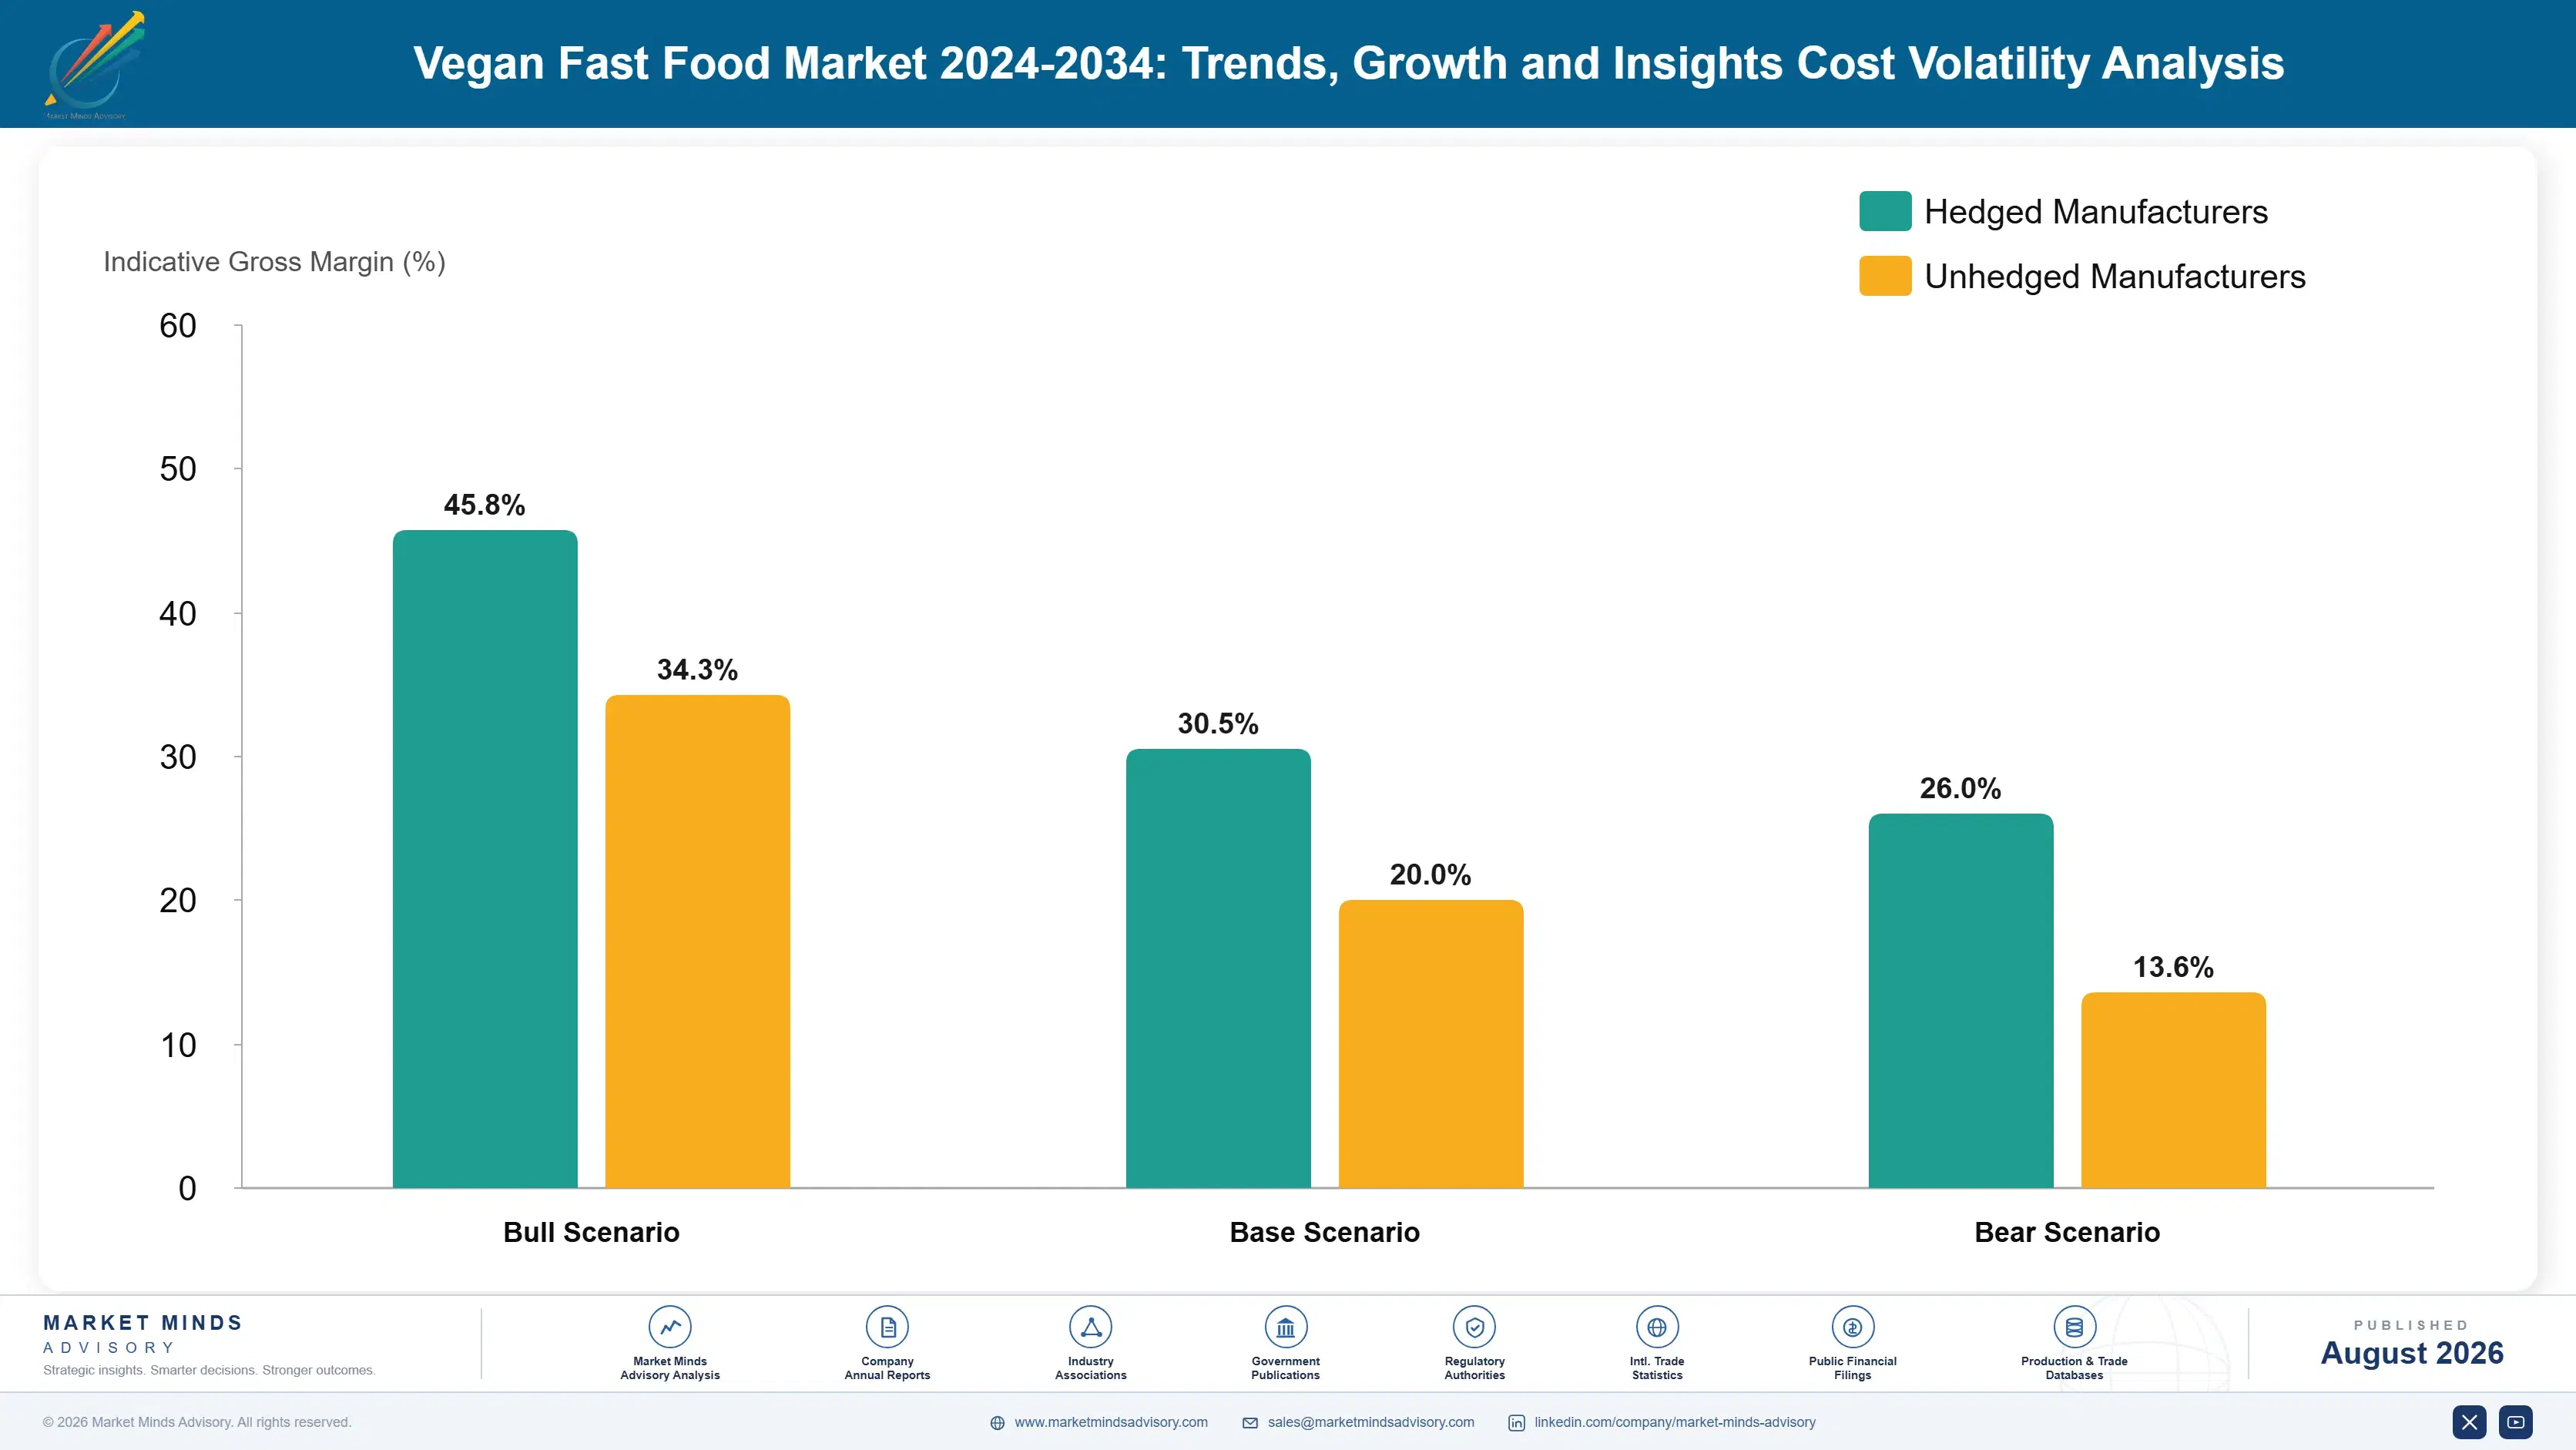
Protein ingredient cost dominates the gap against meat equivalents. Soy and pea protein isolates, methylcellulose binders and flavour systems account for roughly 46% of food cost on a plant based patty, against considerably lower protein input cost for mechanically recovered chicken. Pea protein isolate comes principally from Canadian, French and Chinese processors, and expanded capacity has not closed the gap keeping the menu premium near 18%.
Pea and soy protein pricing moved considerably through the period as retail demand collapsed and foodservice held. Processors that built capacity for a retail boom found themselves with volume and no home for it, which pushed spot pricing down while contracted foodservice pricing held. USDA reporting documented the underlying crop and processing movements. Energy costs through 2022 raised extraction and drying costs, since protein isolation is energy intensive throughout.

Exposure divides by contract structure rather than by scale. An operator buying on annual contracts absorbed none of the spot movement and captured none of the decline. Manufacturers holding retail scale capacity carried fixed cost against a smaller market, and several exited. Smaller chains buying through distributors pay well above committed volume pricing, which widens the menu premium exactly where it hurts.
vegan-fast-food-market-trends-growth-cost-volatility-analysis-1787641353574

Contract volume to justify dedicated protein capacity

Protein isolate pricing falls sharply with dedicated capacity rather than with spot purchasing, and foodservice volume commitments are the only thing that justifies building it. Retail listings never provided that certainty, which is why the capacity built for retail is now stranded. Chains committing multi year volumes secure pricing that closes part of the premium against meat.

Reformulate toward whole food protein bases

Shorter ingredient decks built on beans, mushrooms and grains cost less in isolate content and read considerably better on a published ingredient list. The trade is texture, since matching meat mouthfeel is precisely what the isolates and binders deliver. Where sauce and seasoning carry the eating experience, the compromise is far less noticeable. Cost falls with isolate content too.

Standardise formats across regional menu variants

Operators frequently run different plant based formats in different markets for historical reasons, which fragments purchasing volume across suppliers and forfeits the scale that closes the price gap. Consolidating onto fewer base formats with regional seasoning differences preserves local relevance while concentrating protein purchasing. The obstacle is usually internal ownership of regional menus rather than any consumer requirement.

Portfolio Architecture for Margin Defence

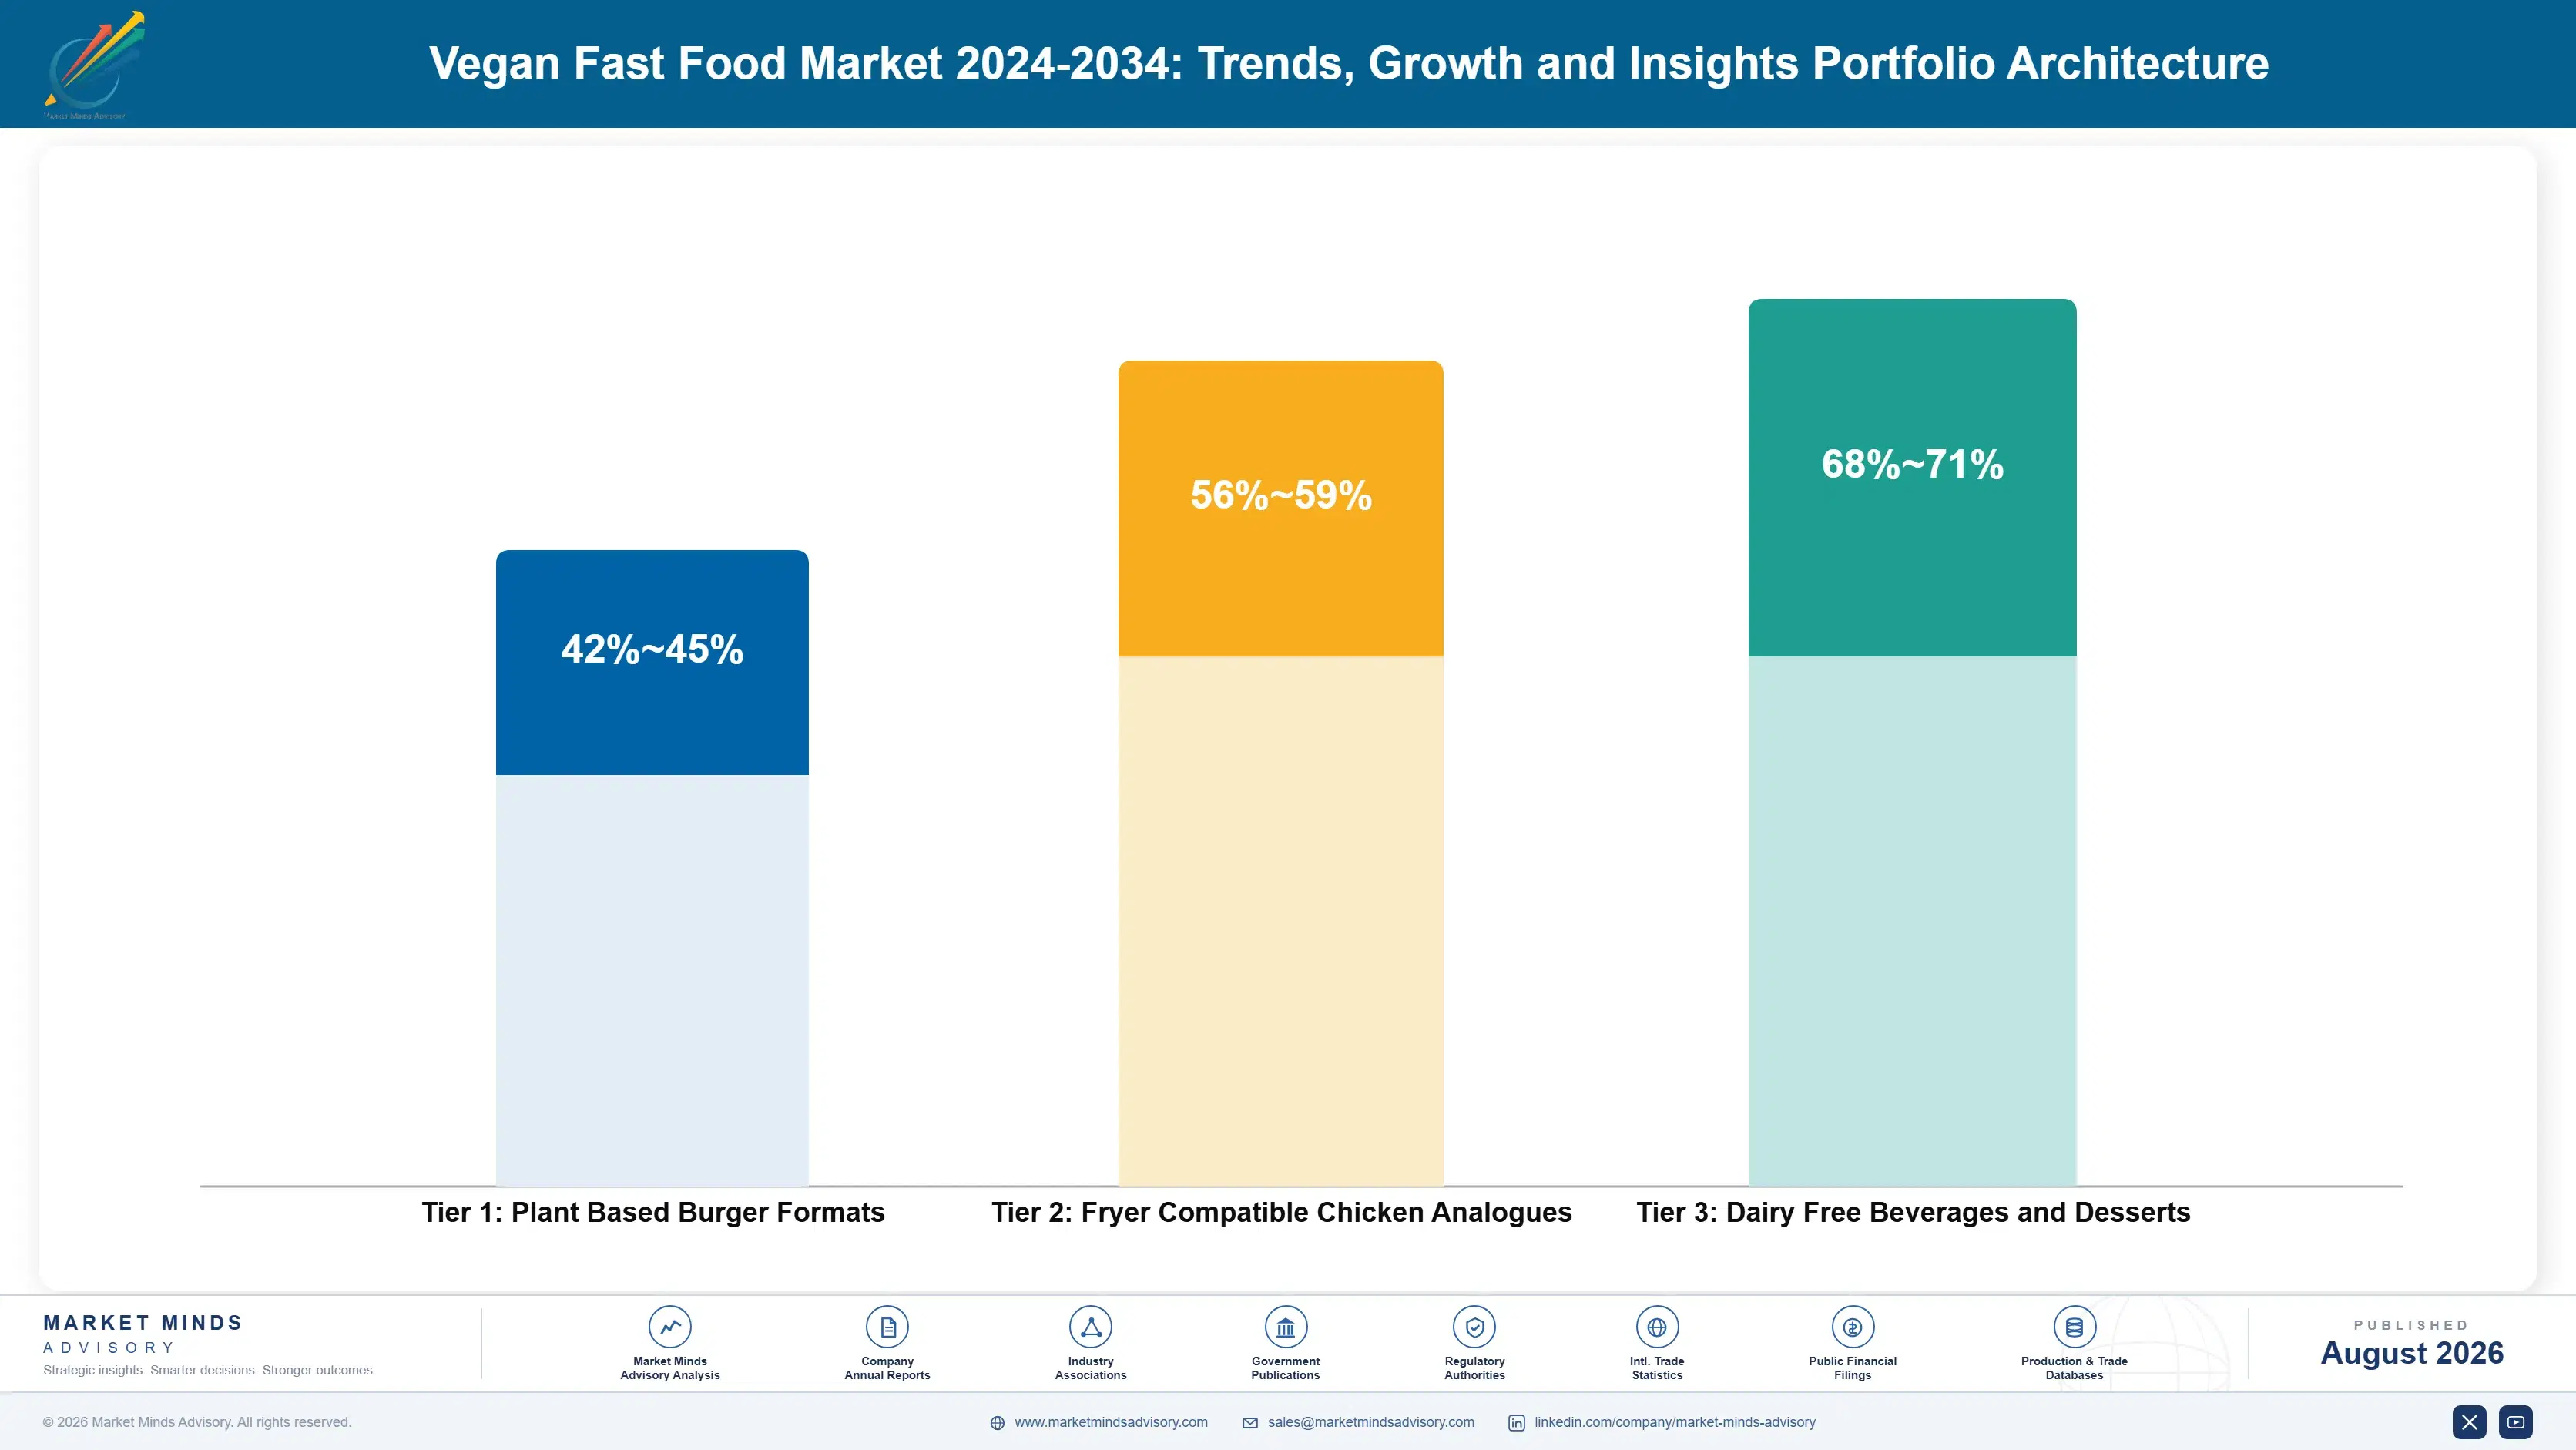
Margin architecture here follows how much a plant based item disturbs the kitchen. Dairy free beverages earn best, since operators charge a supplement for plant milk exceeding the ingredient cost difference and the equipment needs only a substitution. Chicken analogues earn well because they run in existing processes and command the 18% premium. Burger formats earn least, carrying the highest ingredient cost and frequently a dedicated cooking requirement as well.
The tension is between the item customers recognise and the item kitchens tolerate. Plant based burgers were the category's public face and generated the trial that built awareness, and they are also the format most likely to be delisted. Chicken analogues and beverages generate less publicity and considerably better economics. Operators marketing burgers while quietly building the business on beverages are being sensible rather than inconsistent.

High value pools concentrate in dairy free beverage substitution and in chicken analogues that require no equipment change, both of which earn a premium without taxing throughput. Everything requiring a dedicated cooking process carries a hidden cost that never appears in the item margin and decides its survival anyway. Manufacturers that price against the item alone are missing the number operators actually use.

Plant Based Burger Formats

Patty formats carrying the highest ingredient cost in the category and frequently a dedicated cooking requirement alongside it. They generated the trial that built awareness and are also the most likely items to be removed at a menu review.
Gross Margin: 42-45%

Fryer Compatible Chicken Analogues

Breaded and unbreaded formats running in existing quick service fryer equipment, commanding the menu premium without costing any throughput. Delisting rates in this format run well below the category average for entirely operational reasons.
Gross Margin: 56-59%

Dairy Free Beverages and Desserts

Plant milk substitution and dairy free frozen formats where operators charge a supplement exceeding the ingredient cost difference. Margin is the best in the category and consumer resistance is lower than anywhere else in it.
Gross Margin: 68-71%
vegan-fast-food-market-trends-growth-portfolio-architecture-1787641354082

High-value Sub-segments and Strategic Watch-out

Plant-Based Chicken Analogues

The fastest growing category at 12.9% and the one with the lowest delisting rate, because it costs a kitchen nothing to carry. Chicken is also easier to imitate convincingly than whole muscle beef, since sauce and breading carry much of the eating experience. Delisting risk is lowest here.
Gross Margin: 56-59%

Dairy-Free Desserts and Beverages

Second fastest at 10.8% and the best margin in the category, since operators charge a plant milk supplement exceeding the actual cost difference. Adoption in coffee formats has been close to universal and generated almost none of the resistance protein substitution attracts. Habit forms where substitution is invisible.
Gross Margin: 68-71%

Plant-Based Bowls, Wraps and Salads

Growing at 9.4% on formats where plant based construction is natural rather than substitutional, requiring no analogue product and no dedicated equipment. Fast casual operators lead here and the format travels well into markets with existing vegetarian traditions. No analogue product is required, which removes the ingredient cost problem.
Gross Margin: 52-55%

Plant-Based Burgers and Sandwiches

Growing at only 6.2% and carrying the highest delisting risk in the category despite generating most of its public visibility. The 18% price premium bites hardest here, since the comparison to the meat burger beside it is direct and unavoidable for every customer. Visibility and vulnerability sit together.
Gross Margin: 42-45%

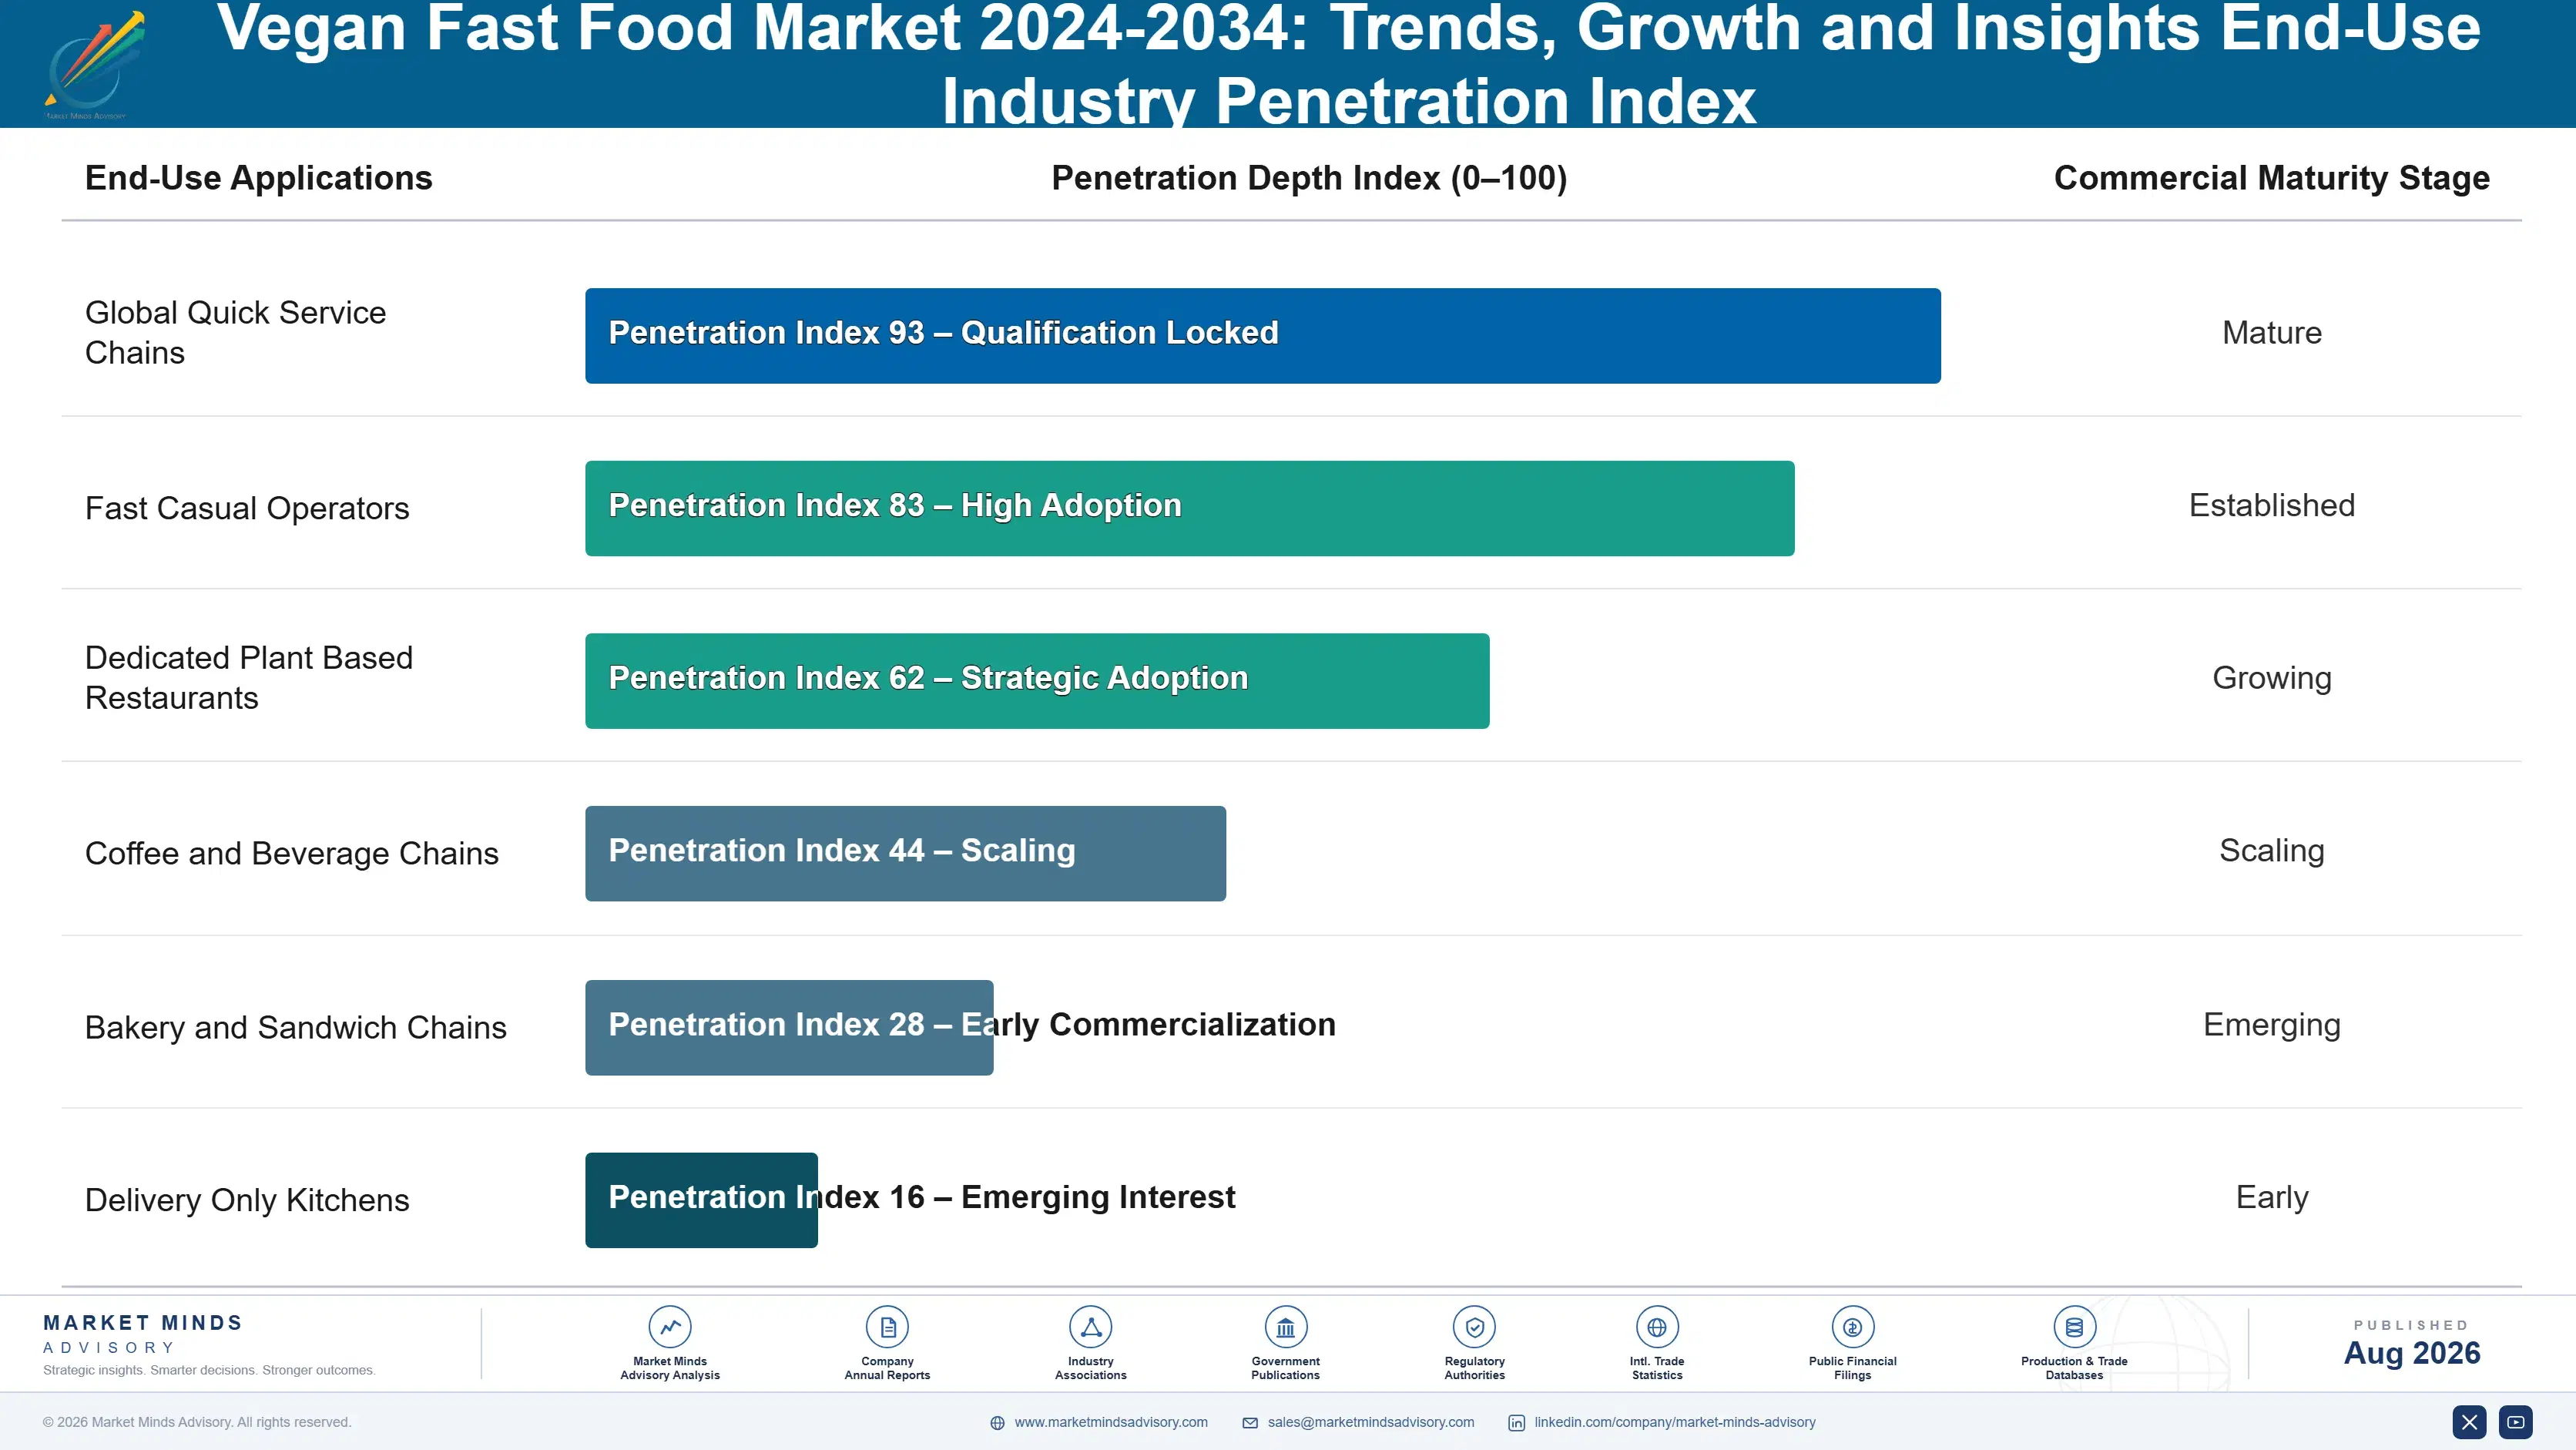
How This Demand Actually Repeats

Repeat behaviour is the weakness this category has never solved. Roughly 29% of customers who order a plant based item order one again within a quarter, well below rates for established meat lines, and trial rates were never the problem. Recurring demand comes from the small committed vegan population and from group occasions, which is traffic defence rather than growth.
Stickiness varies enormously by format. Dairy free beverage customers are the stickiest by a wide margin, because a plant milk coffee becomes a daily habit rather than an occasional choice and the substitution is invisible in the finished drink. Protein analogue customers are the loosest, comparing directly against a cheaper meat item every visit. Dedicated plant based operators hold their customers well but serve a small population.

The decision has moved from the marketing department to operations. Plant based listings were once championed by brand teams building a sustainability position, with the menu decision following the announcement. They now run through operations, where throughput per hour and drive through times decide, and roughly 31% of launches do not survive that review within two years. Manufacturers still presenting to marketing teams are pitching to a function that lost the argument.
vegan-fast-food-market-trends-growth-end-use-penetration-index-1787641354582

Where This Category Actually Works

These are among the four positions where our research anticipates prominent divergence between winners and laggards over the coming forecast period. Each is grounded in the demand model, the regulatory perimeter, and the announced capacity pipeline.
01 / KITCHEN PROCESS COMPATIBILITY

Fit the existing fryer or lose the listing

Roughly 31% of plant based launches are delisted within two years, frequently while selling acceptably, and operational drag explains far more of that than demand ever does. A product needing a dedicated fryer, griddle zone or holding cabinet taxes every order in a kitchen measured in items per hour rather than only its own. Chicken analogues that drop into existing baskets grow at 12.9% against a market rate of 8.6%, and manufacturers optimising for taste panels rather than for workflow keep winning trials and losing menus.
02 / FLEXITARIAN PRICE SENSITIVITY

The customer is comparing against the chicken sandwich

Roughly 87% of plant based fast food is bought by people who eat meat, so the item competes against the meat product on the same menu at an 18% premium rather than against any other plant based option. Repeat purchase near 29% is the direct consequence, and it is the number that decides whether a listing survives a menu review. Price parity would do more for this category than any reformulation currently in development, and volume commitments are the only realistic route to reaching it.
03 / TRAFFIC DEFENCE FRAMING

Sell the group booking, not the vegan customer

Vegans are a small single digit percentage of most Western populations and no chain adds menu complexity for that alone, yet menu penetration has reached roughly 64% of outlets. The reason is the group occasion where one member does not eat meat and the whole party chooses somewhere with an option, so a chain without one loses the group rather than the order. Operators who frame the item as traffic defence rather than as a growth product make better menu decisions and keep listings considerably longer.
04 / VEGETARIAN POPULATION PRIORITY

Remove dairy where meat was never there

India grows at 17.4%, faster than any country covered, because hundreds of millions of people already avoid meat and quick service expansion is reaching them for the first time in tier two and tier three cities. Converting an existing vegetarian item to fully plant based means removing dairy rather than replacing meat, which is a far smaller reformulation and frequently improves ambient shelf life in warm conditions. The addressable population there is measured in hundreds of millions rather than in percentage points of a Western country.

Engagement Snapshot From the Field

A live engagement with an industry participant carrying material or product regulatory and market exposure ahead of a defining policy shift, showing how our research translates into a defensible multi-year portfolio strategy.
MARKET MINDS ADVISORY · CLIENT ENGAGEMENT SUMMARY
Vegan Fast Food 2024-2034: Trends, Growth and Insights Producer Strategic Portfolio Review and Transition Roadmap 2026·Investment Scenario on Vegan Fast Food 2024-2034: Trends, Growth and Insights Exposure Evaluation 2025-26
CLIENT PROFILE
An international quick service operator running roughly 3,100 outlets across nine countries, with plant based items listed in six of them under varying formats. Annual system sales were approximately 4.2 billion dollars (client-reported, unverified by MMA), with plant based items contributing under 4%. Two previous plant based launches had been withdrawn and franchisee sentiment toward the category was poor.
STRATEGIC CHALLENGE
The board was considering a third plant based launch and franchisees were resisting on operational grounds that head office regarded as excuses. Management wanted to know whether the category was worth pursuing at all, and if so in what format. Nobody had measured what the previous listings actually cost in kitchen throughput or in queue time.
MMA APPROACH
MMA measured preparation time, station occupancy and order queue impact for each previous plant based format against the standard menu across a sample of outlets. Menu contribution was modelled including throughput cost rather than item margin alone. Forty-seven expert interviews with franchisees, kitchen managers and customers who had tried and not repeated established what actually drove both delisting and non repeat.
KEY FINDINGS
  1. The withdrawn burger format added 47 seconds to average order time in outlets carrying it, which cost more in lost throughput than the item contributed in margin.
  2. Franchisees in 38 of the 47 interviews cited preparation complexity rather than sales as their objection, contradicting the reason given in both previous withdrawal announcements.
  3. Customers who tried and did not repeat named price against the meat equivalent in 61% of cases, well ahead of taste which appeared in only 22%.
  4. Group occasions accounted for roughly 71% of plant based orders, confirming that the item defends party traffic rather than generating individual demand.
CLIENT PROFILE
An international quick service operator running roughly 3,100 outlets across nine countries, with plant based items listed in six of them under varying formats. Annual system sales were approximately 4.2 billion dollars (client-reported, unverified by MMA), with plant based items contributing under 4%. Two previous plant based launches had been withdrawn and franchisee sentiment toward the category was poor.
STRATEGIC CHALLENGE
The board was considering a third plant based launch and franchisees were resisting on operational grounds that head office regarded as excuses. Management wanted to know whether the category was worth pursuing at all, and if so in what format. Nobody had measured what the previous listings actually cost in kitchen throughput or in queue time.
MMA APPROACH
MMA measured preparation time, station occupancy and order queue impact for each previous plant based format against the standard menu across a sample of outlets. Menu contribution was modelled including throughput cost rather than item margin alone. Forty-seven expert interviews with franchisees, kitchen managers and customers who had tried and not repeated established what actually drove both delisting and non repeat.
KEY FINDINGS
  1. The withdrawn burger format added 47 seconds to average order time in outlets carrying it, which cost more in lost throughput than the item contributed in margin.
  2. Franchisees in 38 of the 47 interviews cited preparation complexity rather than sales as their objection, contradicting the reason given in both previous withdrawal announcements.
  3. Customers who tried and did not repeat named price against the meat equivalent in 61% of cases, well ahead of taste which appeared in only 22%.
  4. Group occasions accounted for roughly 71% of plant based orders, confirming that the item defends party traffic rather than generating individual demand.
RECOMMENDED STRATEGY
Phase 1: Phase one: launch only formats that run in existing fryer equipment, since the withdrawn burger cost 47 seconds per order in throughput. Phase 2: Phase two: price at parity with the meat equivalent using committed volume, since 61% of non repeat customers named price rather than taste. Phase 3: Phase three: brief franchisees on group traffic defence, since 71% of plant based orders arrive within a party rather than alone.
OUTCOME
The client launched a fryer compatible chicken analogue at price parity across four markets and retained the listing beyond the point where both previous formats had been withdrawn. Order times were unchanged, franchisee resistance largely disappeared, and plant based contribution rose from under 4% to 7% of system sales (client-reported, unverified by MMA).

Frequently Asked Questions

Foundational context covering the market sizes, CAGR, scope, country, region and competition that inform every finding below. This section is provided to cover basics and most often pre-purchase conversations, answered from the MMA Primary Research Dataset.

What is the current size of the Vegan Fast Food Market?

The market was valued at 18.4 billion dollars in 2025, covering fully plant based menu items sold through quick service and fast casual operators. It reaches an estimated 19.98 billion dollars during 2026.

How large will the Vegan Fast Food Market be by 2036?

MMA forecasts 45.59 billion dollars by 2036, an increase of 25.61 billion dollars over the 2026 base. That represents an expansion multiple of 2.28 times across the forecast period.

What is the CAGR for the Vegan Fast Food Market 2026 to 2036?

The base case compound annual growth rate is 8.6%, with a bull case of 9.8% and a bear case of 7.4%. Price parity and menu simplification pressure separate those scenarios.

Which segment is growing fastest?

Plant based chicken analogues grow at 12.9%, half again the market rate of 8.6%, because they cook in existing fryer equipment. Dairy free desserts and beverages follow at 10.8%.

Who are the major companies in the Vegan Fast Food Market?

McDonald's, Yum Brands, Restaurant Brands International, Domino's Pizza and Subway lead on plant based menu sales across their operator networks. Together they account for 22% of the market.

Which country is growing fastest?

India grows fastest at 17.4%, because hundreds of millions already avoid meat and quick service expansion into smaller cities is reaching that population for the first time.

Report Segmentation Architecture

The full report scope spans multiple orthogonal segmentation dimensions, with cross-tabulated demand data provided for each dimension pair. Coverage extends further to regional breakdowns, trend trajectories, and the competitive detail needed to support segment-level decision-making.

By Menu Category

  • Plant-Based Burgers and Sandwiches
  • Plant-Based Chicken Analogues
  • Plant-Based Pizza and Italian Formats
  • Plant-Based Bowls, Wraps and Salads
  • Dairy-Free Desserts and Beverages
  • Plant-Based Breakfast Items

By End-Use Industry

  • Global Quick Service Chains
  • Fast Casual Operators
  • Dedicated Plant Based Restaurants
  • Coffee and Beverage Chains
  • Bakery and Sandwich Chains
  • Delivery Only Kitchens

By Commercial Dimension

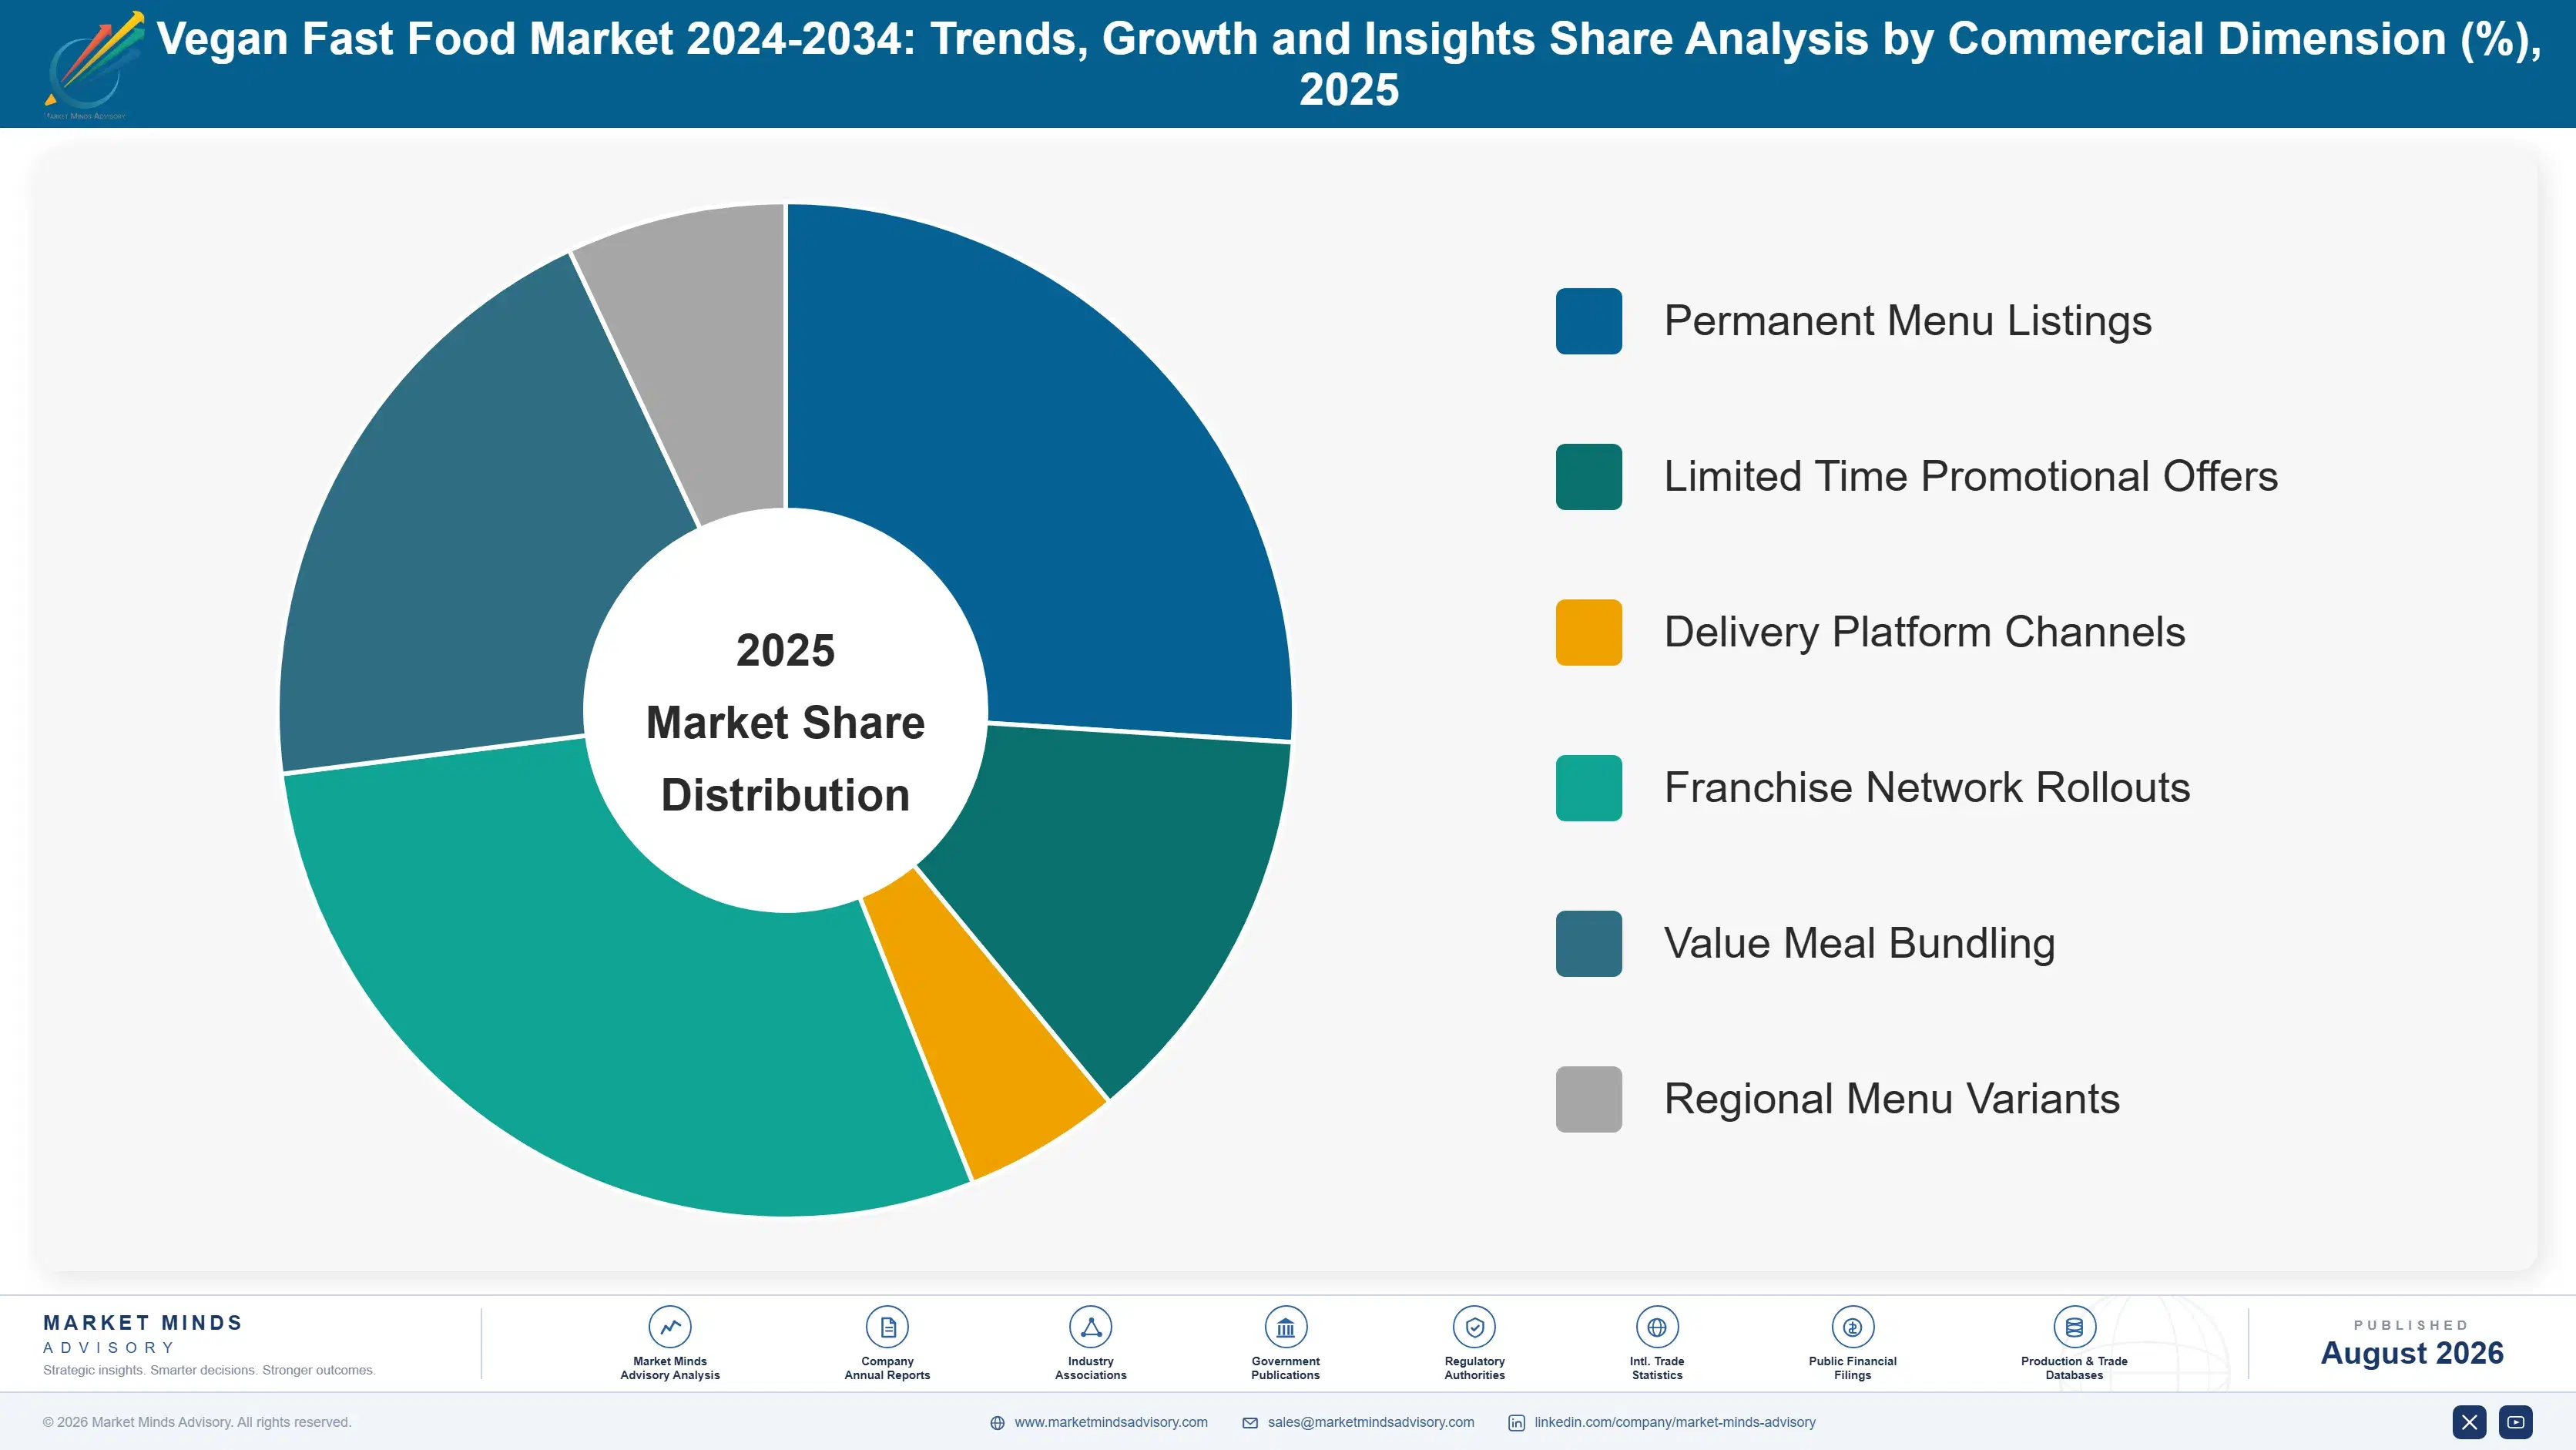
  • Permanent Menu Listings
  • Limited Time Promotional Offers
  • Delivery Platform Channels
  • Franchise Network Rollouts
  • Value Meal Bundling
  • Regional Menu Variants

By Region

  • North America
  • Western Europe
  • East Asia
  • South Asia and Pacific
  • Latin America
  • Middle East and Africa
  • Eastern Europe

Scope, Methodology, and Coverage

Every figure in this report is reproducible from documented input assumptions. The scope below maps the historical period, the forecast horizon, the segmentation dimensions, and the countries covered, alongside the underlying primary and qualitative methodology.
Historical Period
2020 to 2025
Forecast Period
2026 to 2036
Base Year
2025 (USD billions; MMA Primary Research Dataset, August 2026)
Market Definition
Fully plant based menu items sold through quick service and fast casual restaurant operators worldwide, covering plant based burgers and sandwiches, plant based chicken analogues, plant based pizza and Italian formats, plant based bowls, wraps and salads, dairy free desserts and beverages, and plant based breakfast items. Measured at foodservice sales value across dine in, takeaway and delivery. Retail packaged plant based products, vegetarian items containing dairy or egg, full service restaurant menus and institutional catering are excluded from scope.
Quantitative Units
USD billions (current prices); items sold; USD per item by menu category and region
Segmentation Dimensions
Menu category; end-use industry; commercial dimension; region
Regions Covered
North America, Western Europe, East Asia, South Asia and Pacific, Latin America, Middle East and Africa, Eastern Europe
Countries Covered
United States, Canada, United Kingdom, Germany, Netherlands, Sweden, France, Spain, China, Japan, South Korea, Taiwan, India, Thailand, Vietnam, Australia, Brazil, Chile, Israel, Poland
Key Companies Profiled
McDonald's, Yum Brands, Restaurant Brands International, Domino's Pizza, Subway, Starbucks, Chipotle Mexican Grill, Greggs, Pret A Manger, Nando's, Papa John's, Wendy's, Shake Shack, Sweetgreen, Neat Burger, Odd Burger Corporation, Plant Power Fast Food, Veggie Grill, LEON Restaurants, Jollibee Foods
Quantitative Methodology
Primary survey, n=3,800 respondents, Q4 2025, six countries; demand-side model with trade association cross-validation
Qualitative Methodology
47 expert interviews, Q4 2025; applied to validate demand model assumptions, identify emerging dynamics, and assess competitive positioning
Report Format
PDF and XLSX data workbook (Word format preview document)
Publisher
Market Minds Advisory
Report Code
MMA-2026-AGR-202
Published
August 2026
Contact
sales@marketmindsadvisory.com | www.marketmindsadvisory.com

Purchase the full Vegan Fast Food Market 2024-2034: Trends, Growth and Insights Report (2026 to 2036).

The full report treats vegan fast food as a category sold almost entirely to meat eaters, which explains why the item competes against the chicken sandwich beside it rather than against any other plant based option. It sizes all six menu categories independently through 2036, models menu contribution including kitchen throughput cost rather than item margin alone, and quantifies delisting risk by format and by preparation requirement. Regional chapters cover all seven regions, with existing vegetarian populations assessed separately from flexitarian conversion. Competitive profiling covers 20 participants on one consistent plant based menu sales basis.
Six menu categories sized independently through 2036
Menu contribution modelled including kitchen throughput cost
Delisting risk quantified by format and preparation requirement
Existing vegetarian populations assessed separately from flexitarian conversion
Repeat purchase drivers measured through structured customer research
Twenty participants profiled on one consistent sales basis

Built For The People Who Decide

From boardroom strategy to bench-side execution, this report is read cover-to-cover by leaders shaping the next decade of their industry, turning demand scenarios, market dynamics and valuation benchmarks into decisions.
CXOs/ Presidents/ VPs/ Managers
M&A and Corporate Development
Strategy Teams and R&D Heads
Procurement and Product Directors
Regulatory and Compliance Leaders
Investor Relations and Equity Analysts