Market Minds Advisory
Ultra-High-Performance Tire Market

Ultra-High-Performance Tire Market: Ultra-High-Performance Tire: The Wheel Chose It, Not the Driver

Rim diameters grew for styling and brake packaging, and above nineteen inches nothing but a low profile high speed fitment exists, so ordinary family vehicles now wear tyres their owners never asked for.

Lead Analyst

David Horsley

Published

August 2026

Make Smarter Decisions with Customized Research Insights

Request a free sample report and evaluate market opportunities, growth trends, and competitive dynamics relevant to your business needs.

2025 MARKET VALUE$42.0BMarket Size 2025
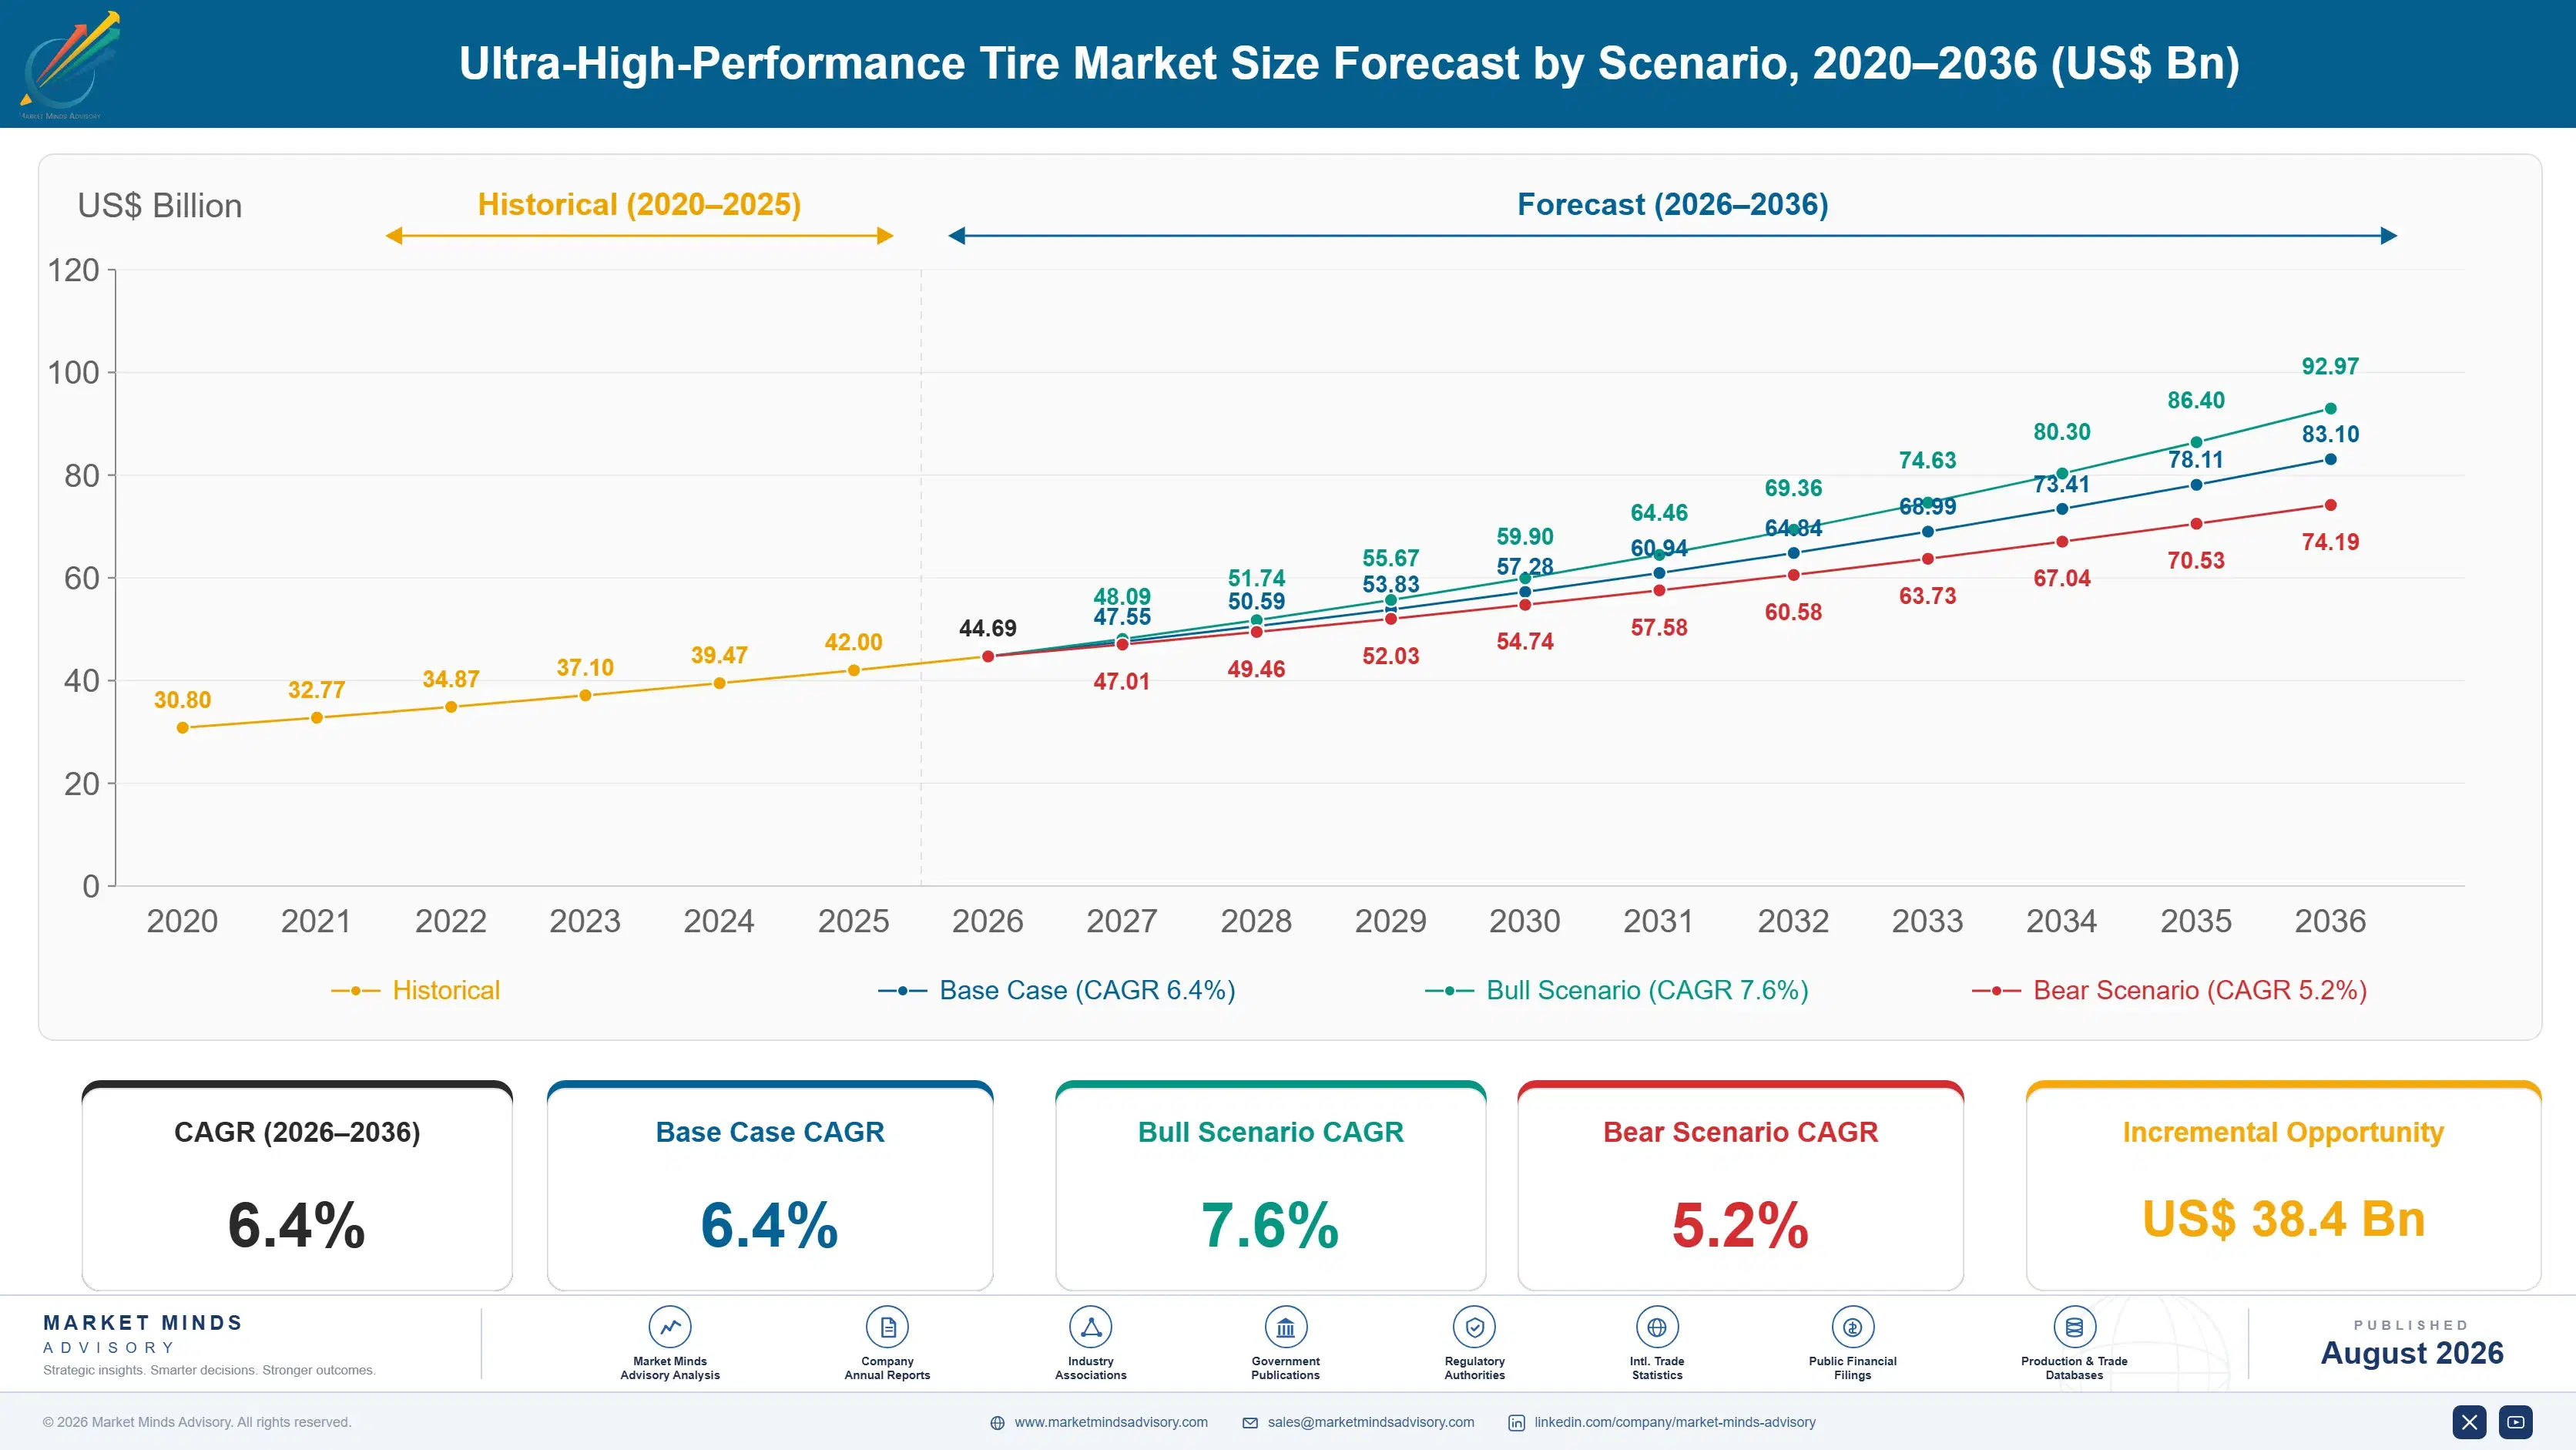
2036 FORECAST VALUE$83.1BBase Case , 2026 to 2036
CAGR 2026 TO 20366.4 %Bull 7.6% / Bear 5.2%
INCREMENTAL OPPORTUNITY$38.4BNet 10- year value creation
EXPANSION MULTIPLE1.86x2036 value over 2026 base
Strategic Levers
M&A Pipeline
Regional Outlook
Country Rankings
Competitive Intelligence
Segmental Deep-dive
Call-Us : 91 93563 13602

Executive Snapshot and Market Trajectory.

This category grew because wheels got bigger, not because drivers got faster. Above roughly 19 inches of rim diameter no standard touring fitment exists at all, and vehicle designers went there for brake package clearance and styling rather than for handling. Nobody consulted the driver about any of it.
The consequence lands at the first replacement. Around 71% of owners never approach the speed rating they are carrying, and they discover it costs about 2.4 times a standard tyre and delivers roughly 38% less tread life. They cannot buy their way out either, because the wheel they own has no standard alternative to fit. So they trade down inside the category rather than out of it. Thin sidewalls carry their own damage bill too.
Electric vehicle specific fitments grow at 9.6%, half again the market rate of 6.4%, because heavier vehicles delivering instant torque need higher load capacity, lower rolling resistance and lower noise at once. Those three requirements pull against each other, and against tread life, which is already the property owners complain about most. Budget brands have grown faster than the premium names as a result.
Market Definition
Passenger tyres rated V and above, typically fitted to rims of seventeen inches and larger with low aspect ratio construction, covering summer UHP tyres, all-season UHP tyres, electric vehicle specific UHP tyres, run-flat and self-supporting UHP, UHP winter and performance winter, and self-sealing and noise-reducing UHP. Measured at manufacturer selling value across original equipment and replacement. Excludes standard touring and economy tyres, commercial vehicle tyres, motorsport tyres, and tyre raw materials.
Base Year Value
$42.0B in 2025 (MMA Primary Research Dataset, August 2026)
Forecast Period
2026 to 2036, eleven discrete annual values
CAGR
6.4% base case. Bull 7.6%. Bear 5.2%.
Fastest Growth Segment
Electric Vehicle Specific UHP Tyres: 9.6% CAGR
Fastest Growth Country
China: 11.4% CAGR
Fastest Growth Region
South Asia and Pacific: 8.4% CAGR
Largest Region
East Asia: 30% of 2025 global value
Market Leaders
Michelin, Bridgestone, Continental, Goodyear, Pirelli. Source: MMA Primary Research Dataset, July 2026.
Primary Survey
n=3,800 procurement and R&D decision-makers, Q4 2025, six countries
Methodology
Demand-side build-up, cross-validated against public data, 47 expert interviews

Ultra-High-Performance Tire Market Forecast Scenarios

ultra-high-performance-tire-market-trends-size-forecast-scenario-1787640968281
Growth ran near 5.4% between 2020 and 2025 and rim diameter inflation did most of the work. Sport utility vehicles moved onto nineteen and twenty inch wheels as standard equipment, which converted ordinary family fitments into ultra-high-performance sizes by geometry rather than by any decision about handling. Electric vehicle launches accelerated the same shift, since heavier platforms needed larger brakes and larger wheels to house them.
Base case 6.4% rests on three mechanisms. Electric vehicle specific fitments grow at 9.6% as mass, torque and noise requirements force purpose designed constructions. Self-sealing and noise-reducing constructions grow at 8.8% because cabin noise became audible once engines stopped masking it. And China grows fastest of any country at 11.4% on electric vehicle adoption, rim size inflation and domestic premium capability all advancing at once. None depends on vehicle sales rising.
The bull case at 7.6% assumes electric vehicle share rising faster than expected across major markets, since those platforms carry larger wheels and wear tread more quickly than the combustion vehicles they replace. The bear case at 5.2% is replacement buyers trading down aggressively toward budget brands within the category, which holds unit volume while removing a great deal of value from it.

Performance Nobody Ordered

The growth in this category has almost nothing to do with performance driving. Designers moved to larger rims for brake clearance, for showroom proportions and, on electric platforms, to house heavier hardware. Above roughly 19 inches no standard touring construction exists, so the tyre becomes ultra-high-performance by geometry rather than by anybody choosing it for how the car handles.
TOP FIVE CONCENTRATION58%Established makers hold most original equipment fitment positions
RIM DIAMETER THRESHOLD19 inchesWheel size above which standard fitments become entirely unavailable
REPLACEMENT PRICE MULTIPLE2.4xCost against an equivalent standard touring tyre replacement
TREAD LIFE SHORTFALL38%Distance lost against a standard fitment on identical vehicles
CAPABILITY NEVER USED71%Drivers who never approach the speed rating they bought
SIDEWALL IMPACT CLAIMS14%Wheel damage incidents attributed to low profile sidewall construction
Around 71% of owners never approach the speed rating fitted to their vehicle, and most learn what it means only at the first replacement. The tyre costs roughly 2.4 times an equivalent standard fitment and delivers around 38% less tread life, which is an unwelcome discovery on a family vehicle bought for entirely practical reasons. The owner cannot revert either, since the wheel they already own has no standard sized alternative available for it.
That combination produces trading down inside the category rather than out of it, which is why budget and mid-tier UHP brands have grown faster than the premium names that hold original equipment fitment. It also produces a durability complaint nobody can fully answer, since roughly 14% of wheel damage claims are attributed to sidewall geometry the owner never selected.
"Nobody walked into a showroom asking for a two hundred and forty kilometre per hour tyre on a school run vehicle. They asked for the wheels that looked right, and this arrived attached to them without anybody mentioning what replacing it would cost."
Director, Automotive Components and Aftermarket Practice · MMA Automotive and Mobility Practice · August 2026

Market Trends

Rim diameter inflation converting ordinary fitments into performance sizes

Vehicle designers moved to nineteen and twenty inch wheels for brake clearance, showroom proportions and electric platform packaging, and above roughly 19 inches no standard touring construction is offered at all. That converts family vehicle fitments into ultra-high-performance sizes without any decision being made about handling. Around 71% of the resulting owners never approach the speed rating they carry, and none of them chose it in the first place. The discovery arrives at first replacement, when a tyre costing about 2.4 times a standard fitment appears on a quotation. Nobody warned them.
Market Impact: China growing fastest at 11.4%
Electric platforms forcing purpose designed constructions

Electric vehicles carry more mass, deliver torque instantly and generate no engine noise to mask tread pattern sound, which demands higher load capacity, lower rolling resistance and quieter running from the same tyre simultaneously. Those requirements pull against each other and against tread life. Purpose designed electric fitments grow at 9.6% because adapting a combustion tyre satisfies none of the three well enough for a vehicle manufacturer to accept it. Vehicle manufacturers accordingly approve purpose designed constructions and lock the supplier in for the platform production life. Adaptation satisfies nobody.
Market Impact: Noise reducing growing 8.8% annually

Market Opportunities and Growth Drivers

Electric adoption and wheel inflation advancing together

China grows fastest of any country at 11.4% because electric vehicle adoption, rim diameter inflation and domestic premium tyre capability are all advancing simultaneously in the same market. Each alone would lift the category and together they compound considerably. Suppliers organised around established premium geographies are covering vehicle parcs where wheel sizes settled some years ago and electric penetration is advancing far more slowly. Registration data carries wheel specification and predicts this demand precisely, and remarkably few commercial teams use it for planning. Wheel size beats vehicle class as a predictor everywhere.
Market Impact: Replacement costs 2.4 times standard

Cabin noise becoming audible once engines went quiet

Tread pattern noise was always present and always masked by an internal combustion engine sitting in front of it. Electric drivetrains removed that masking entirely, which turned an unnoticed characteristic into a complaint reaching vehicle manufacturers directly. Self-sealing and noise-reducing constructions using internal foam grow at 8.8% on that basis, and they command a premium that pure handling performance has never quite managed to justify. Foam construction complicates repair, which retailers dislike, though buyers rarely consider that at the point of purchase. Handling never justified a premium this reliably. Buyers notice it.
Market Impact: Around 14% of damage claims

Market Restraints and Challenges

Replacement cost driving trading down within the category

A replacement costs roughly 2.4 times a standard fitment and lasts around 38% less far, which arrives as an unwelcome surprise to owners who never selected the specification. They cannot leave the category because the rim has no standard alternative, so they trade down to budget brands instead. The root cause is an original equipment decision the owner was never consulted on. Value communication and wear warranties are the practical responses available. Budget and mid-tier brands have grown faster than premium names as a direct consequence of that trap. Warranties help somewhat.
Market Impact: No standard fitment above 19 inches

Low profile construction transmitting impacts to the rim

Thin sidewalls have little material available to absorb a pothole strike, so the energy reaches the wheel instead and roughly 14% of wheel damage claims are attributed to that geometry. The root cause is aspect ratio driven by styling rather than any engineering requirement. Commercially it produces durability complaints manufacturers cannot fully answer. Reinforced sidewall constructions and rim protector designs are the mitigations actually being deployed. Road surface quality varies enough between markets that the complaint is far more prominent in some than in others. Styling drove the aspect ratio, not engineering.
Market Impact: Electric fitments growing at 9.6%
4 additional market trends, 3 additional growth drivers, and 2 additional restraints and challenges are covered in the full report. Contact sales@marketmindsadvisory.com to access the complete intelligence.

Segment CAGR and Growth Architecture

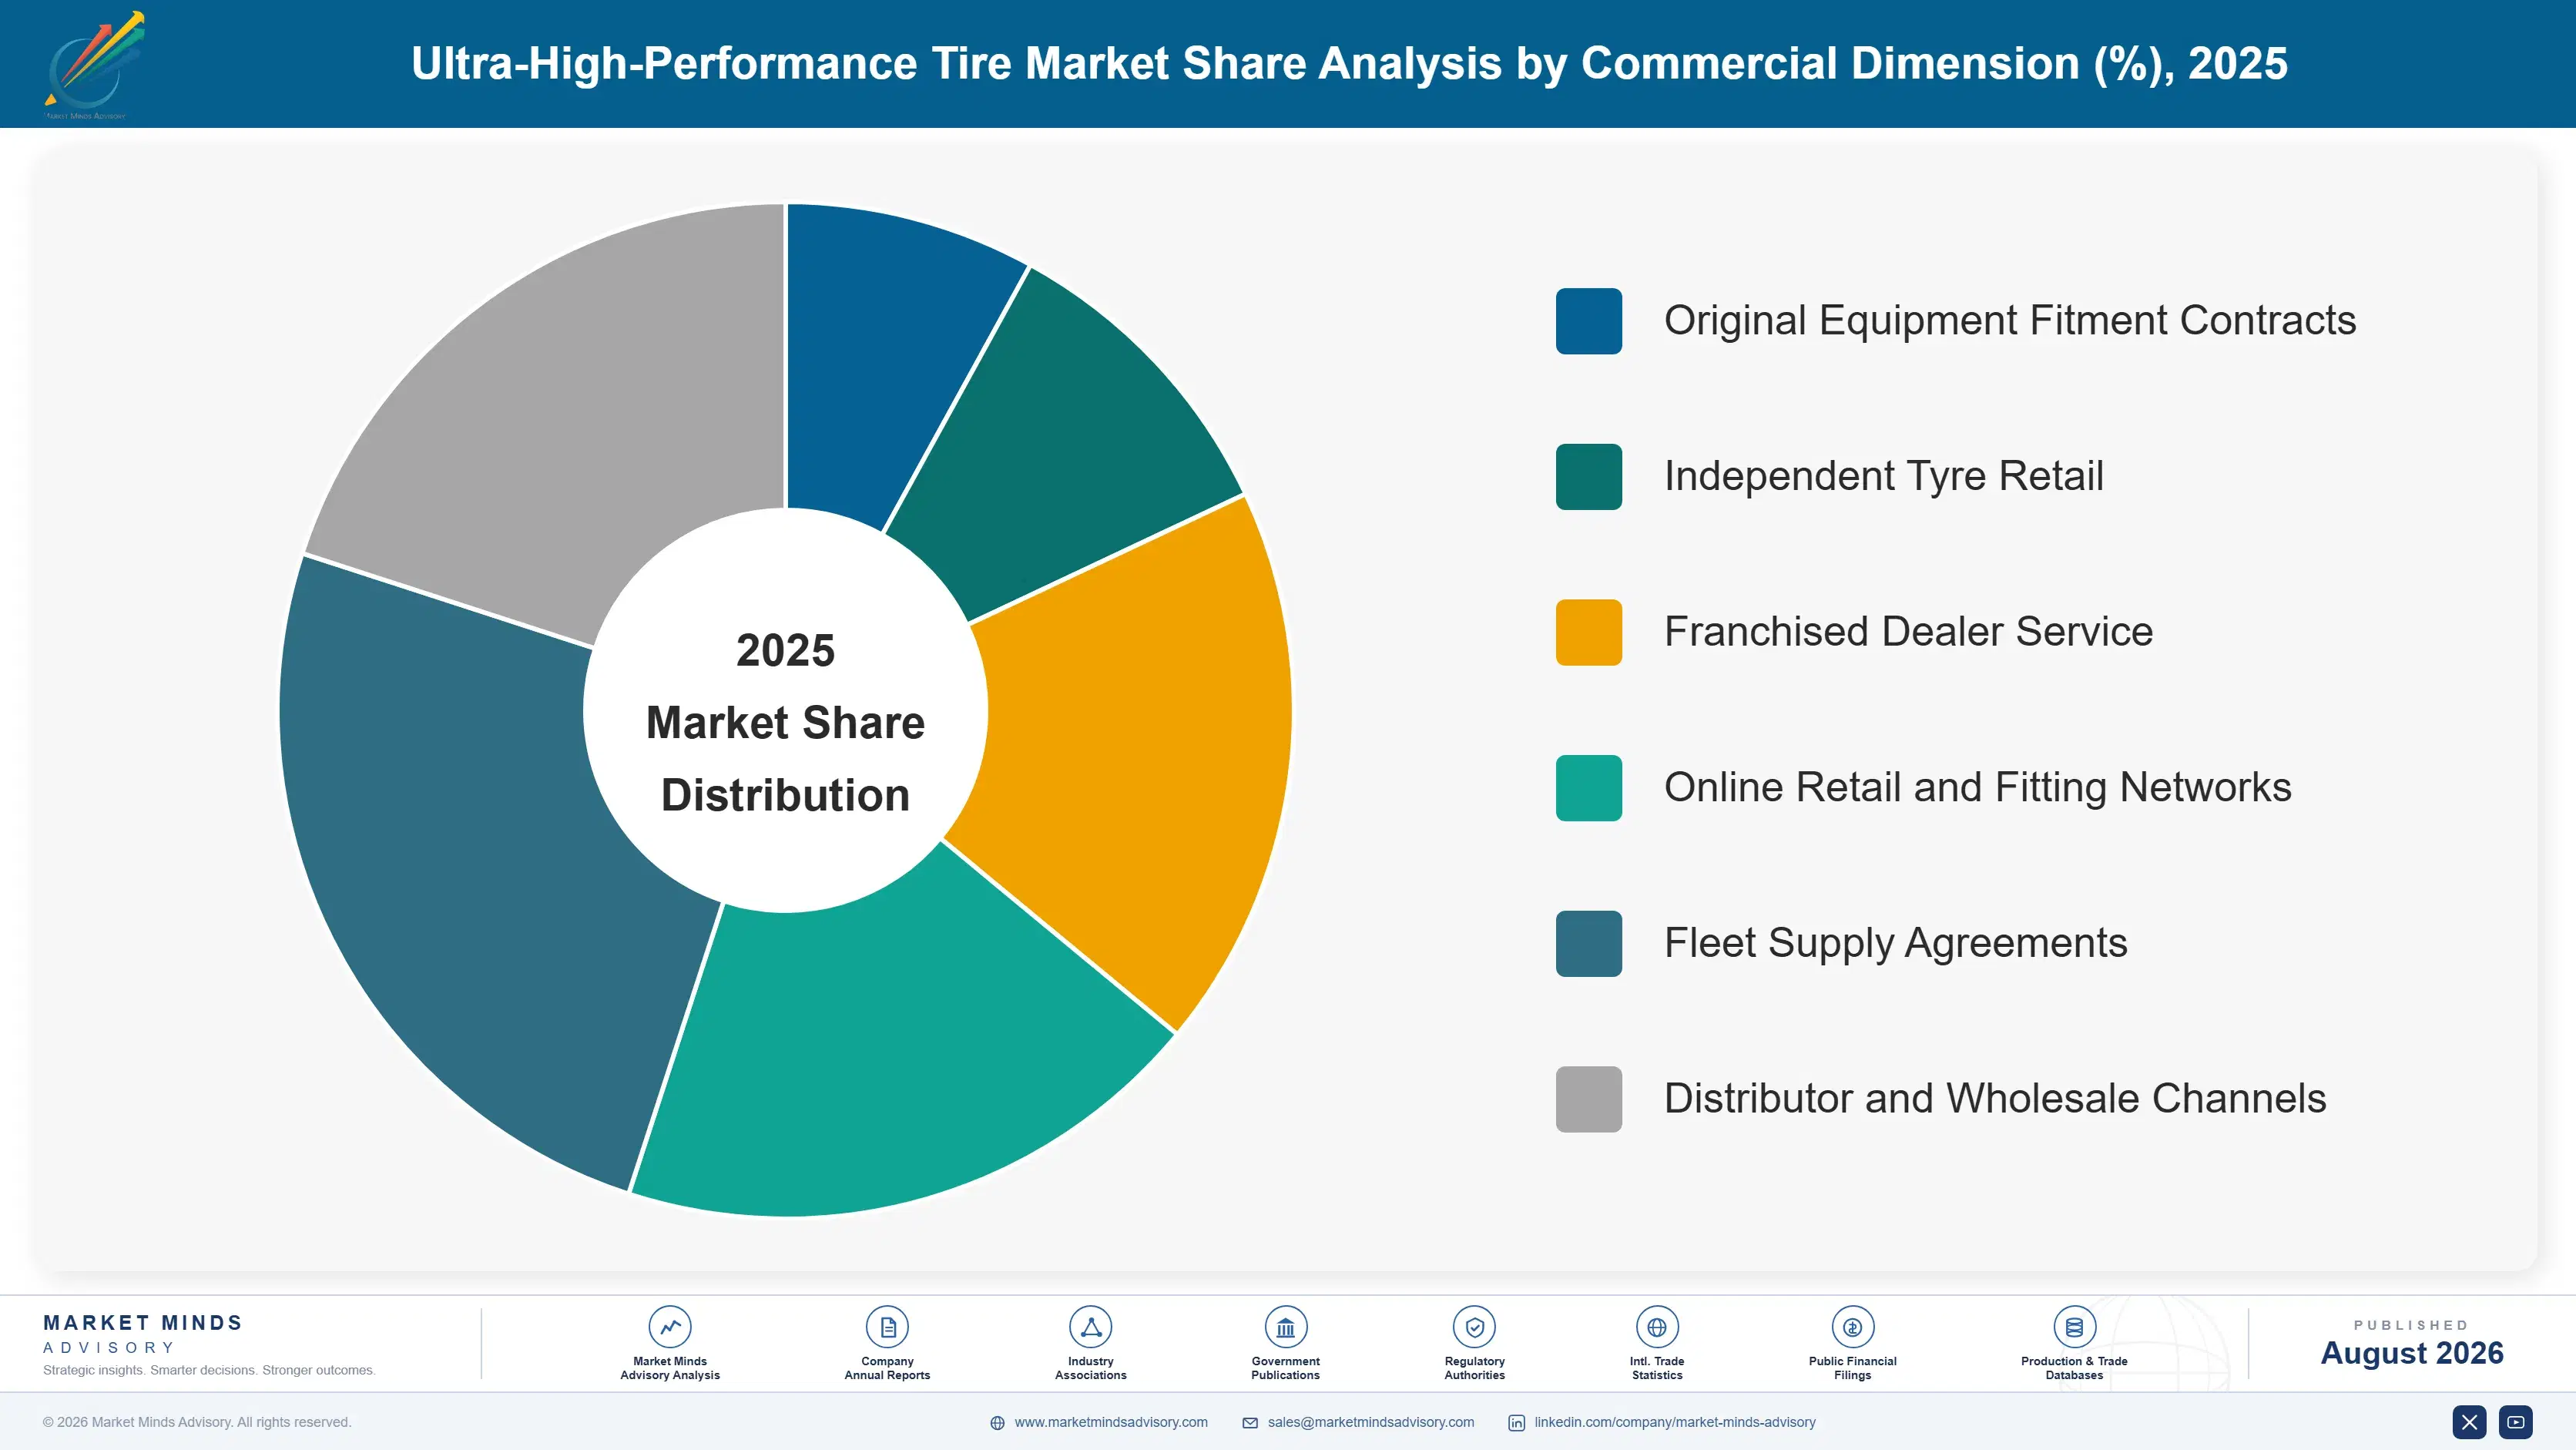
Six segments split by construction type, because construction determines the performance balance delivered, the vehicle platform it suits, the manufacturing complexity involved and the price it commands. Size and speed rating variants sit inside each construction. Fitment channel and vehicle dimensions are handled separately within the framework. Construction determines the platform it suits. Platform fit decides everything.
ultra-high-performance-tire-market-trends-market-share-analysis-1787640968847

Electric Vehicle Specific UHP Tyres

Growing at 9.6%, half again the market rate of 6.4%, purpose designed electric fitments carry higher load indices for additional vehicle mass, lower rolling resistance to protect range and quieter tread patterns because no engine masks the noise. Those three requirements conflict with each other and with tread life, which is already the property owners complain about most. Adapting a combustion construction satisfies none of them sufficiently for a vehicle manufacturer to approve it on a new platform. Vehicle manufacturers approving a construction lock the supplier in for the platform production life, which makes each programme decision worth far more than its first year of volume. Development investment is the barrier.
CAGR 9.6%

Self-Sealing and Noise-Reducing UHP Tyres

At 8.8% internal foam and sealant constructions address cabin noise and puncture risk, both of which became more prominent once electric drivetrains removed engine masking and vehicle manufacturers began deleting spare wheels. The foam adds manufacturing cost and complicates repair, which retailers dislike, but it commands a premium that pure handling capability has never quite justified to buyers who do not use the handling. Vehicle manufacturers deleting spare wheels made puncture mobility a specification requirement rather than an option, which pulled sealant constructions into fitment alongside the noise argument that justified them. Retailers dislike the repair difficulty, though buyers rarely consider it at the point of purchase and discover it only afterwards.
CAGR 8.8%
Full segment breakdown across 6 segments available in the complete report.

Regional Architecture and Country Demand Map

East Asia holds 30% of value on vehicle parc scale, electric adoption and manufacturing capability together. North America follows at 26% on large wheel fitment and sport utility vehicle dominance. South Asia and Pacific grows fastest of the seven regions covered here. Wheel inflation drives both.

North America

Sport utility vehicles and pickups dominate the parc and carry the largest wheel diameters of any major market, which puts a very high share of ordinary family fitments above the threshold where standard constructions disappear. Replacement price sensitivity is correspondingly high and trading down within the category is well established. Road surface quality varies enough that sidewall impact damage is a recognised complaint. Growth at 5.6% reflects a mature parc with mix moving upward. Owners here encounter the price gap at replacement more often than anywhere, simply because so much of the parc sits above the threshold already. Pickups and sport utility vehicles carry the largest diameters of any major market by a considerable margin.
Share: 26% | CAGR: 5.6% (2026 to 2036)

Western Europe

Speed rating requirements have always run higher here given autobahn conditions and long standing driving culture, so the category is mature rather than newly created by wheel inflation. Premium brand loyalty is stronger than anywhere and original equipment fitment carries considerable weight into replacement. Noise regulation and labelling are the most developed in the world. Regional growth of 4.8% is the slowest anywhere on a mature category and a shrinking vehicle parc. Original equipment fitment carries considerable weight into replacement here, since owners in this market are more likely to specify continuity deliberately. Noise regulation and tyre labelling here are the most developed anywhere, which supports the noise-reducing constructions commercially.
Share: 24% | CAGR: 4.8% (2026 to 2036)
Regional intelligence for 5 additional markets available in the complete report: East Asia, South Asia and Pacific, Latin America, Middle East and Africa, Eastern Europe. Contact sales@marketmindsadvisory.com.
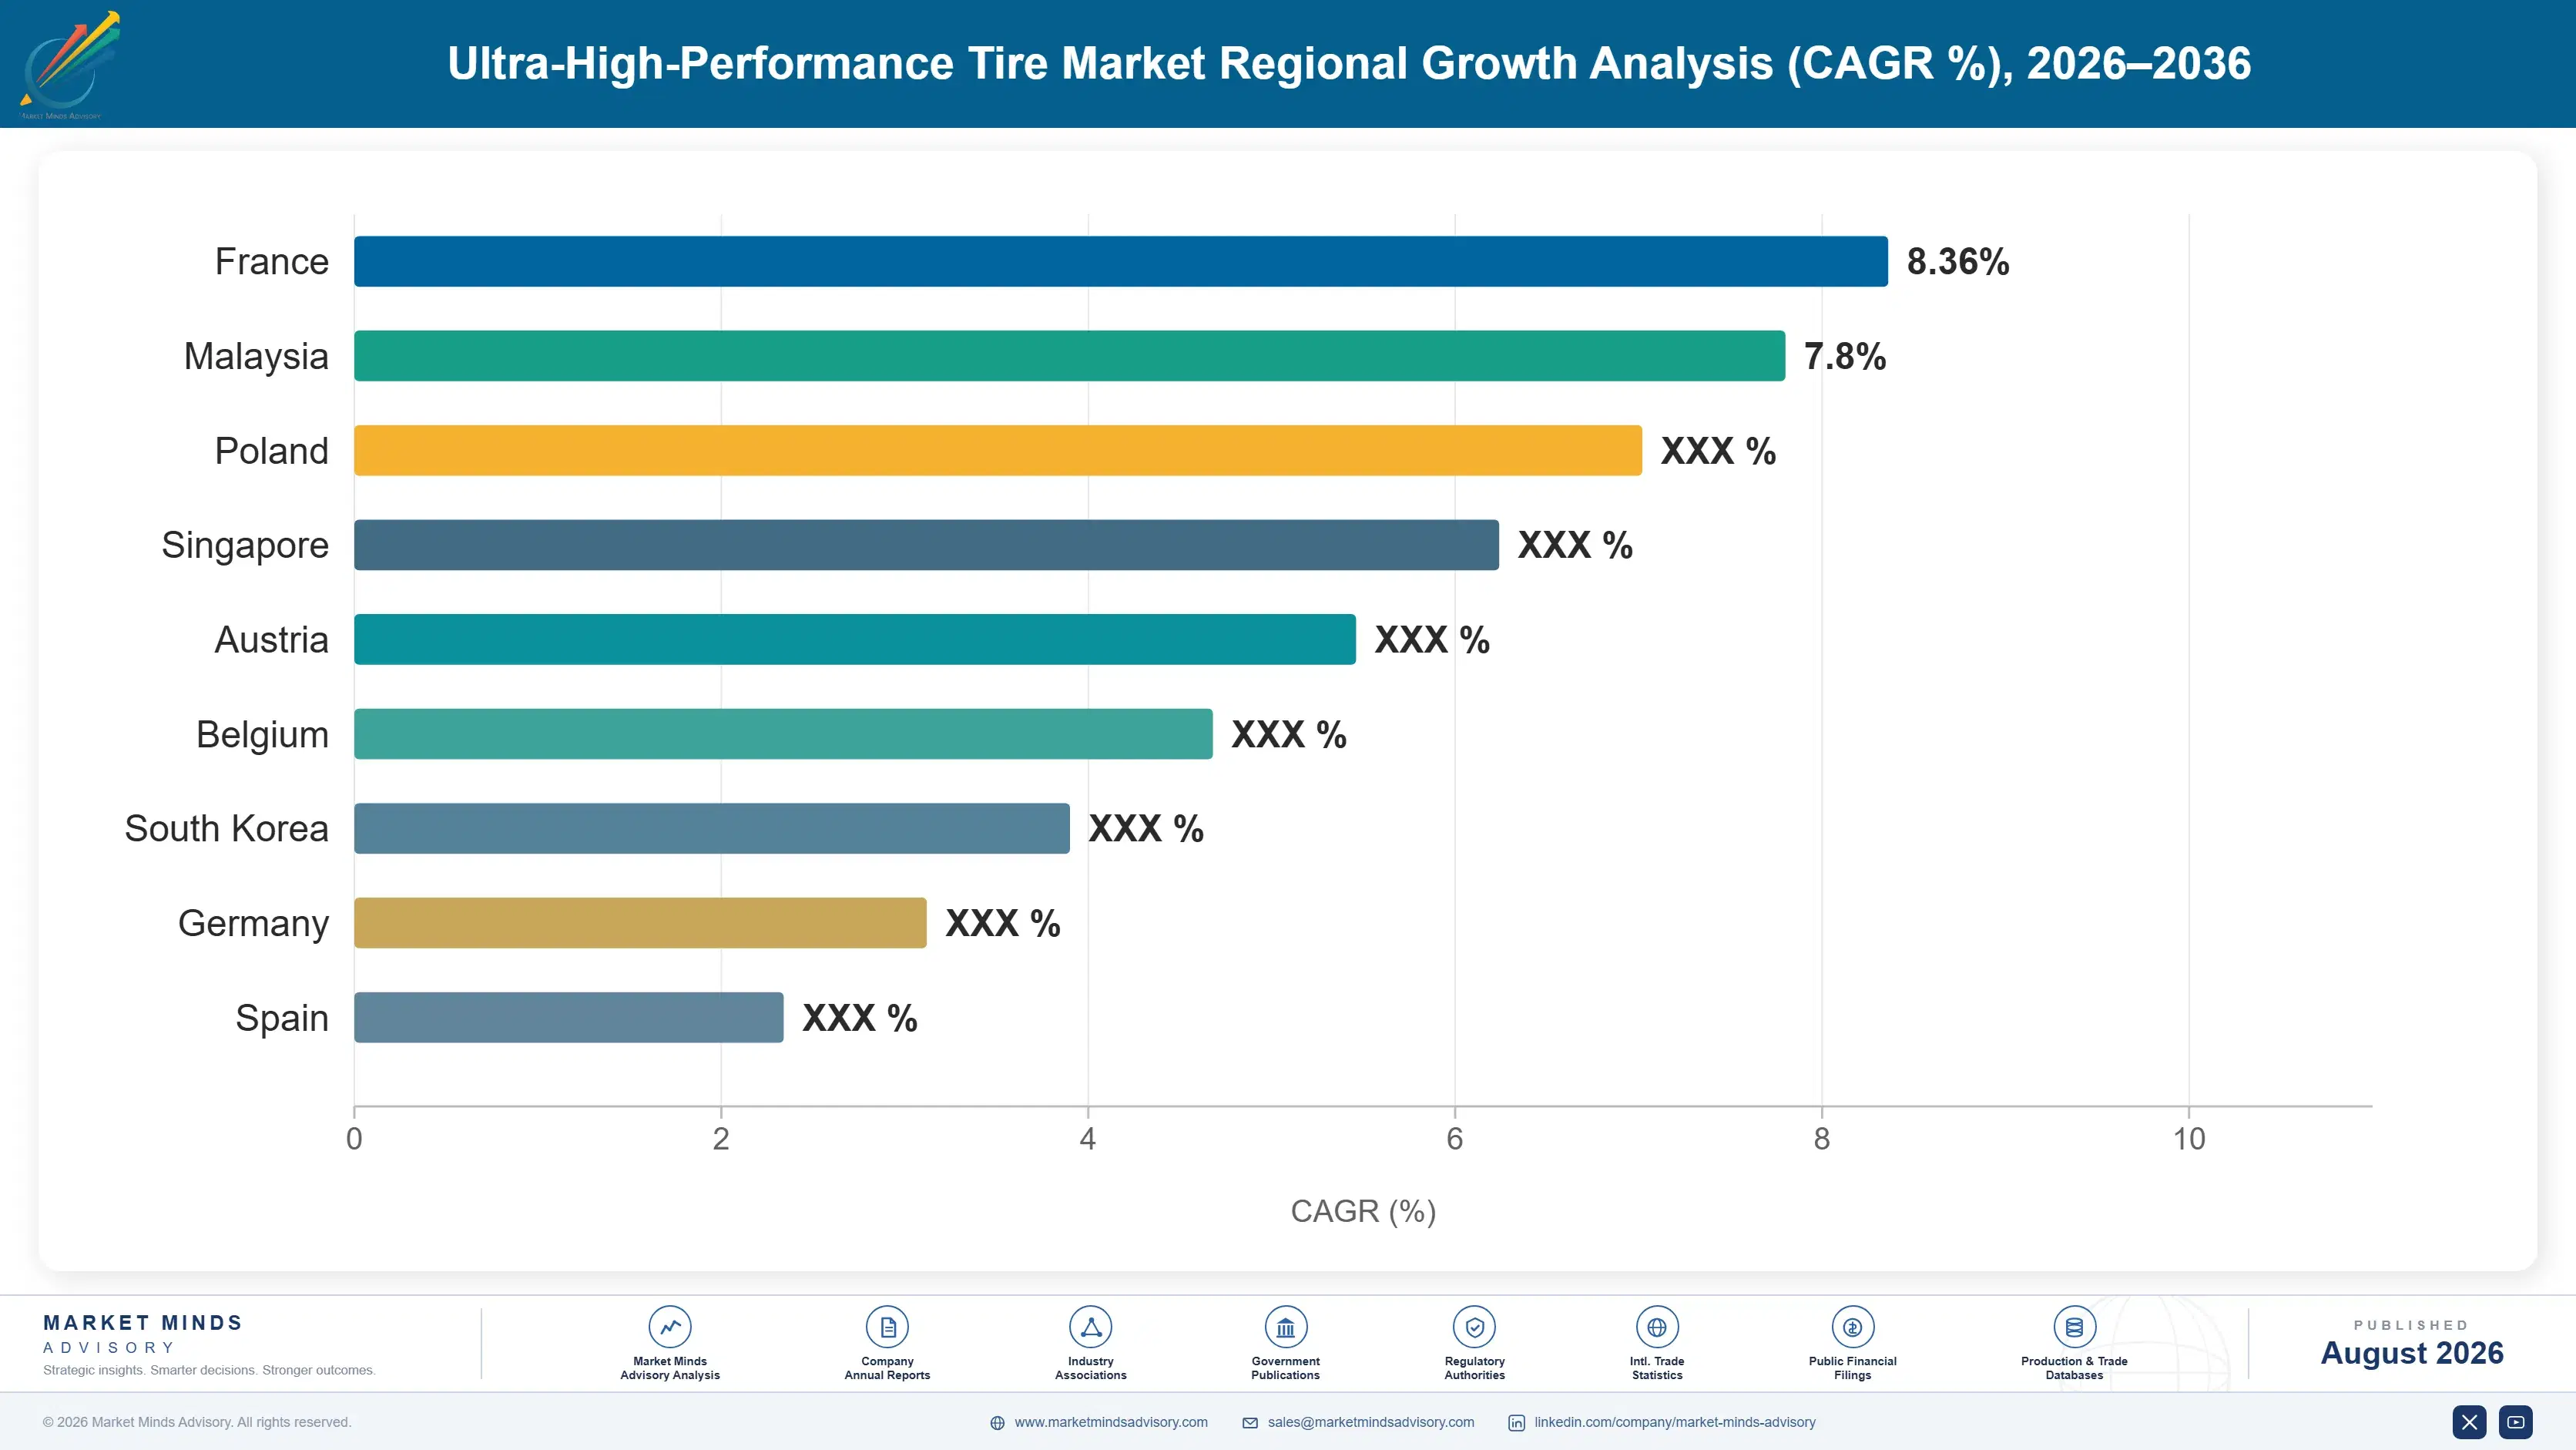
ultra-high-performance-tire-market-trends-country-cagr-analysis-1787640969394

Four Moves After the Wheel Decided

Owners inherited this category rather than choosing it, discover the cost at replacement and cannot leave because of the rim they own. What remains available is winning original equipment fitment, answering the durability complaint honestly, and pricing against a captivity nobody in the industry names out loud. Retailers decide most replacements. Owners barely participate.

Win original equipment fitment, because replacement follows it

Owners who never selected the specification tend to replace with the brand the vehicle arrived on, since they have no basis for choosing anything else and the retailer recommends continuity. Original equipment fitment therefore buys a replacement position several years later at no additional acquisition cost. Suppliers competing only in replacement are contesting a decision that a vehicle manufacturer effectively made for the owner years earlier. Around 71% of owners never chose the specification and have no basis for changing it, which makes fitment worth several times its own volume.
Market Impact: Captures the 71% who never chose it themselves

Answer tread life rather than defend the performance

The complaint is that a replacement costs around 2.4 times a standard fitment and lasts roughly 38% less far, and defending the handling capability addresses a benefit around 71% of owners never use. Constructions and compounds trading a little dry grip for meaningful mileage answer what buyers actually resent. Wear warranties convert an abstract durability claim into something a retailer can state at the counter without argument. Handling defence answers nobody. A replacement costs about 2.4 times a standard fitment and lasts roughly 38% less far, and no amount of grip data addresses either number.
Market Impact: Addresses the whole 38% tread life shortfall directly

Sell quiet, because engines stopped covering for you

Tread noise was always present and always masked by a combustion engine, and electric drivetrains removed that cover entirely. Noise-reducing constructions grow at 8.8% and command a premium that handling capability has never justified to owners who do not use it. Presenting measured cabin noise rather than lateral grip reaches buyers on a benefit they experience on every journey rather than one they experience never. Every journey delivers it. Noise-reducing constructions grow at 8.8% and command a premium that pure handling capability has never quite managed to justify to anybody.
Market Impact: Noise constructions growing at 8.8% every single year

Follow wheel diameter data rather than premium segment share

The category is created by rim size rather than by vehicle class, and China grows fastest at 11.4% where wheel inflation and electric adoption arrive together. Suppliers targeting premium vehicle segments are missing ordinary models that crossed the threshold without changing price bracket. Registration data carries wheel specification and predicts this demand precisely, which remarkably few commercial teams use for planning at all. Vehicle class predicts nothing useful. Ordinary models crossing the nineteen inch threshold do not change price bracket, so segment based targeting misses them entirely. Registration data carries it.
Market Impact: Tracks crossings of the 19 inch rim threshold

Who Controls the Margin Pool

Participation is measured on annual revenue from tyres rated V and above, and the top five hold 58%. Concentration is high in original equipment fitment, where vehicle manufacturer approval requires development capability few can fund, and considerably lower in replacement where budget brands compete effectively on price. The gap to challengers is development capability in fitment and manufacturing cost in replacement.
Competition runs on three fronts. Development partnership decides original equipment fitment, which then shapes replacement years later. Retail relationships decide replacement volume, where the fitter recommends and the owner rarely argues. And manufacturing cost decides budget tier competitiveness in a category owners feel trapped inside. Each front rewards a different capability, and very few participants hold all three of them properly.

Pressure ahead comes from electric platforms demanding purpose designed constructions and from trading down within the category. Expect makers with electric development programmes to gain in fitment and lose share in replacement. Rankings shift on whoever answers tread life credibly. Concentration should hold in fitment and fall in replacement. Makers without electric development programmes look most exposed, since each platform lost is a fitment position gone for its whole production life.
ultra-high-performance-tire-market-trends-company-positioning-matrix-1787640969925

Competitive Moat and Risk Dimensions

MICHELIN

Moat: Development partnership and premium position

Long standing development relationships with vehicle manufacturers secure original equipment fitment on platforms years before launch, and fitment converts into replacement demand from owners who have no basis for choosing differently. Premium brand strength also sustains pricing in a replacement market where a substantial share of buyers resent the category they were placed into.
MICHELIN

Risk: Trading down within the category

Owners facing replacement at roughly 2.4 times a standard fitment cannot leave the category because of the rim they own, so they trade down to budget brands within it instead. That erodes premium share in replacement while original equipment fitment holds, which splits volume and value in a way that flatters unit reporting considerably.
BRIDGESTONE

Moat: Electric platform development capability

Purpose designed electric vehicle constructions balancing load capacity, rolling resistance and noise require development investment that few manufacturers can fund, and vehicle makers approving them lock the supplier into a platform for its production life. That capability also transfers across manufacturers, since the underlying requirements are physical rather than proprietary to any one vehicle programme.
BRIDGESTONE

Risk: Tread life expectation gap

Electric fitments wear faster because of vehicle mass and instant torque, on top of a category already delivering around 38% less tread life than standard tyres. That compounds the complaint owners already have, and no construction fully resolves a conflict between grip, rolling resistance, noise and wear that is ultimately a physical one.

Players Tracked

Prominent Players

Michelin
Bridgestone
Continental
Goodyear
Pirelli

Other Key Players

Sumitomo Rubber Industries
Yokohama Rubber
Hankook Tire
Kumho Tire
Nexen Tire
Toyo Tire
Nokian Tyres
Apollo Tyres
Sailun Group
Zhongce Rubber Group
Linglong Tire
Giti Tire
Cheng Shin Rubber
Kenda Rubber
Triangle Tyre

Recent Developments

MARCH 2026

Vehicle programme adopts twenty inch wheels as standard equipment

A mainstream family vehicle programme moved to twenty inch wheels as standard equipment across its range for styling and brake package reasons, placing every fitment above the diameter at which standard constructions cease to exist. Nobody raised replacement cost during the programme review. Owners discovered it three years later.
Signal: Wheel design decisions place ordinary family vehicles into this category without anybody at all choosing it
SEPTEMBER 2025

Retailer reports trading down within the performance category

A national tyre retailer reported replacement buyers moving toward budget brands within the ultra-high-performance category rather than leaving it, since the wheels they own offer no standard sized alternative to move toward. Premium share fell while unit volumes held entirely steady. Value fell while units held.
Signal: Owners trade down inside the category because the rim they own will not let them out
JANUARY 2026

Electric platform specifies purpose designed tyre construction

An electric vehicle platform specified a purpose designed tyre construction after establishing that adapted combustion fitments could not deliver load capacity, rolling resistance and cabin noise targets simultaneously at the required tread life. Tread life targets were relaxed to accommodate the other three. Owners were not consulted.
Signal: Three requirements pull against each other and against tread wear at exactly the same time here

Compounds, Reinforcement and Moulds

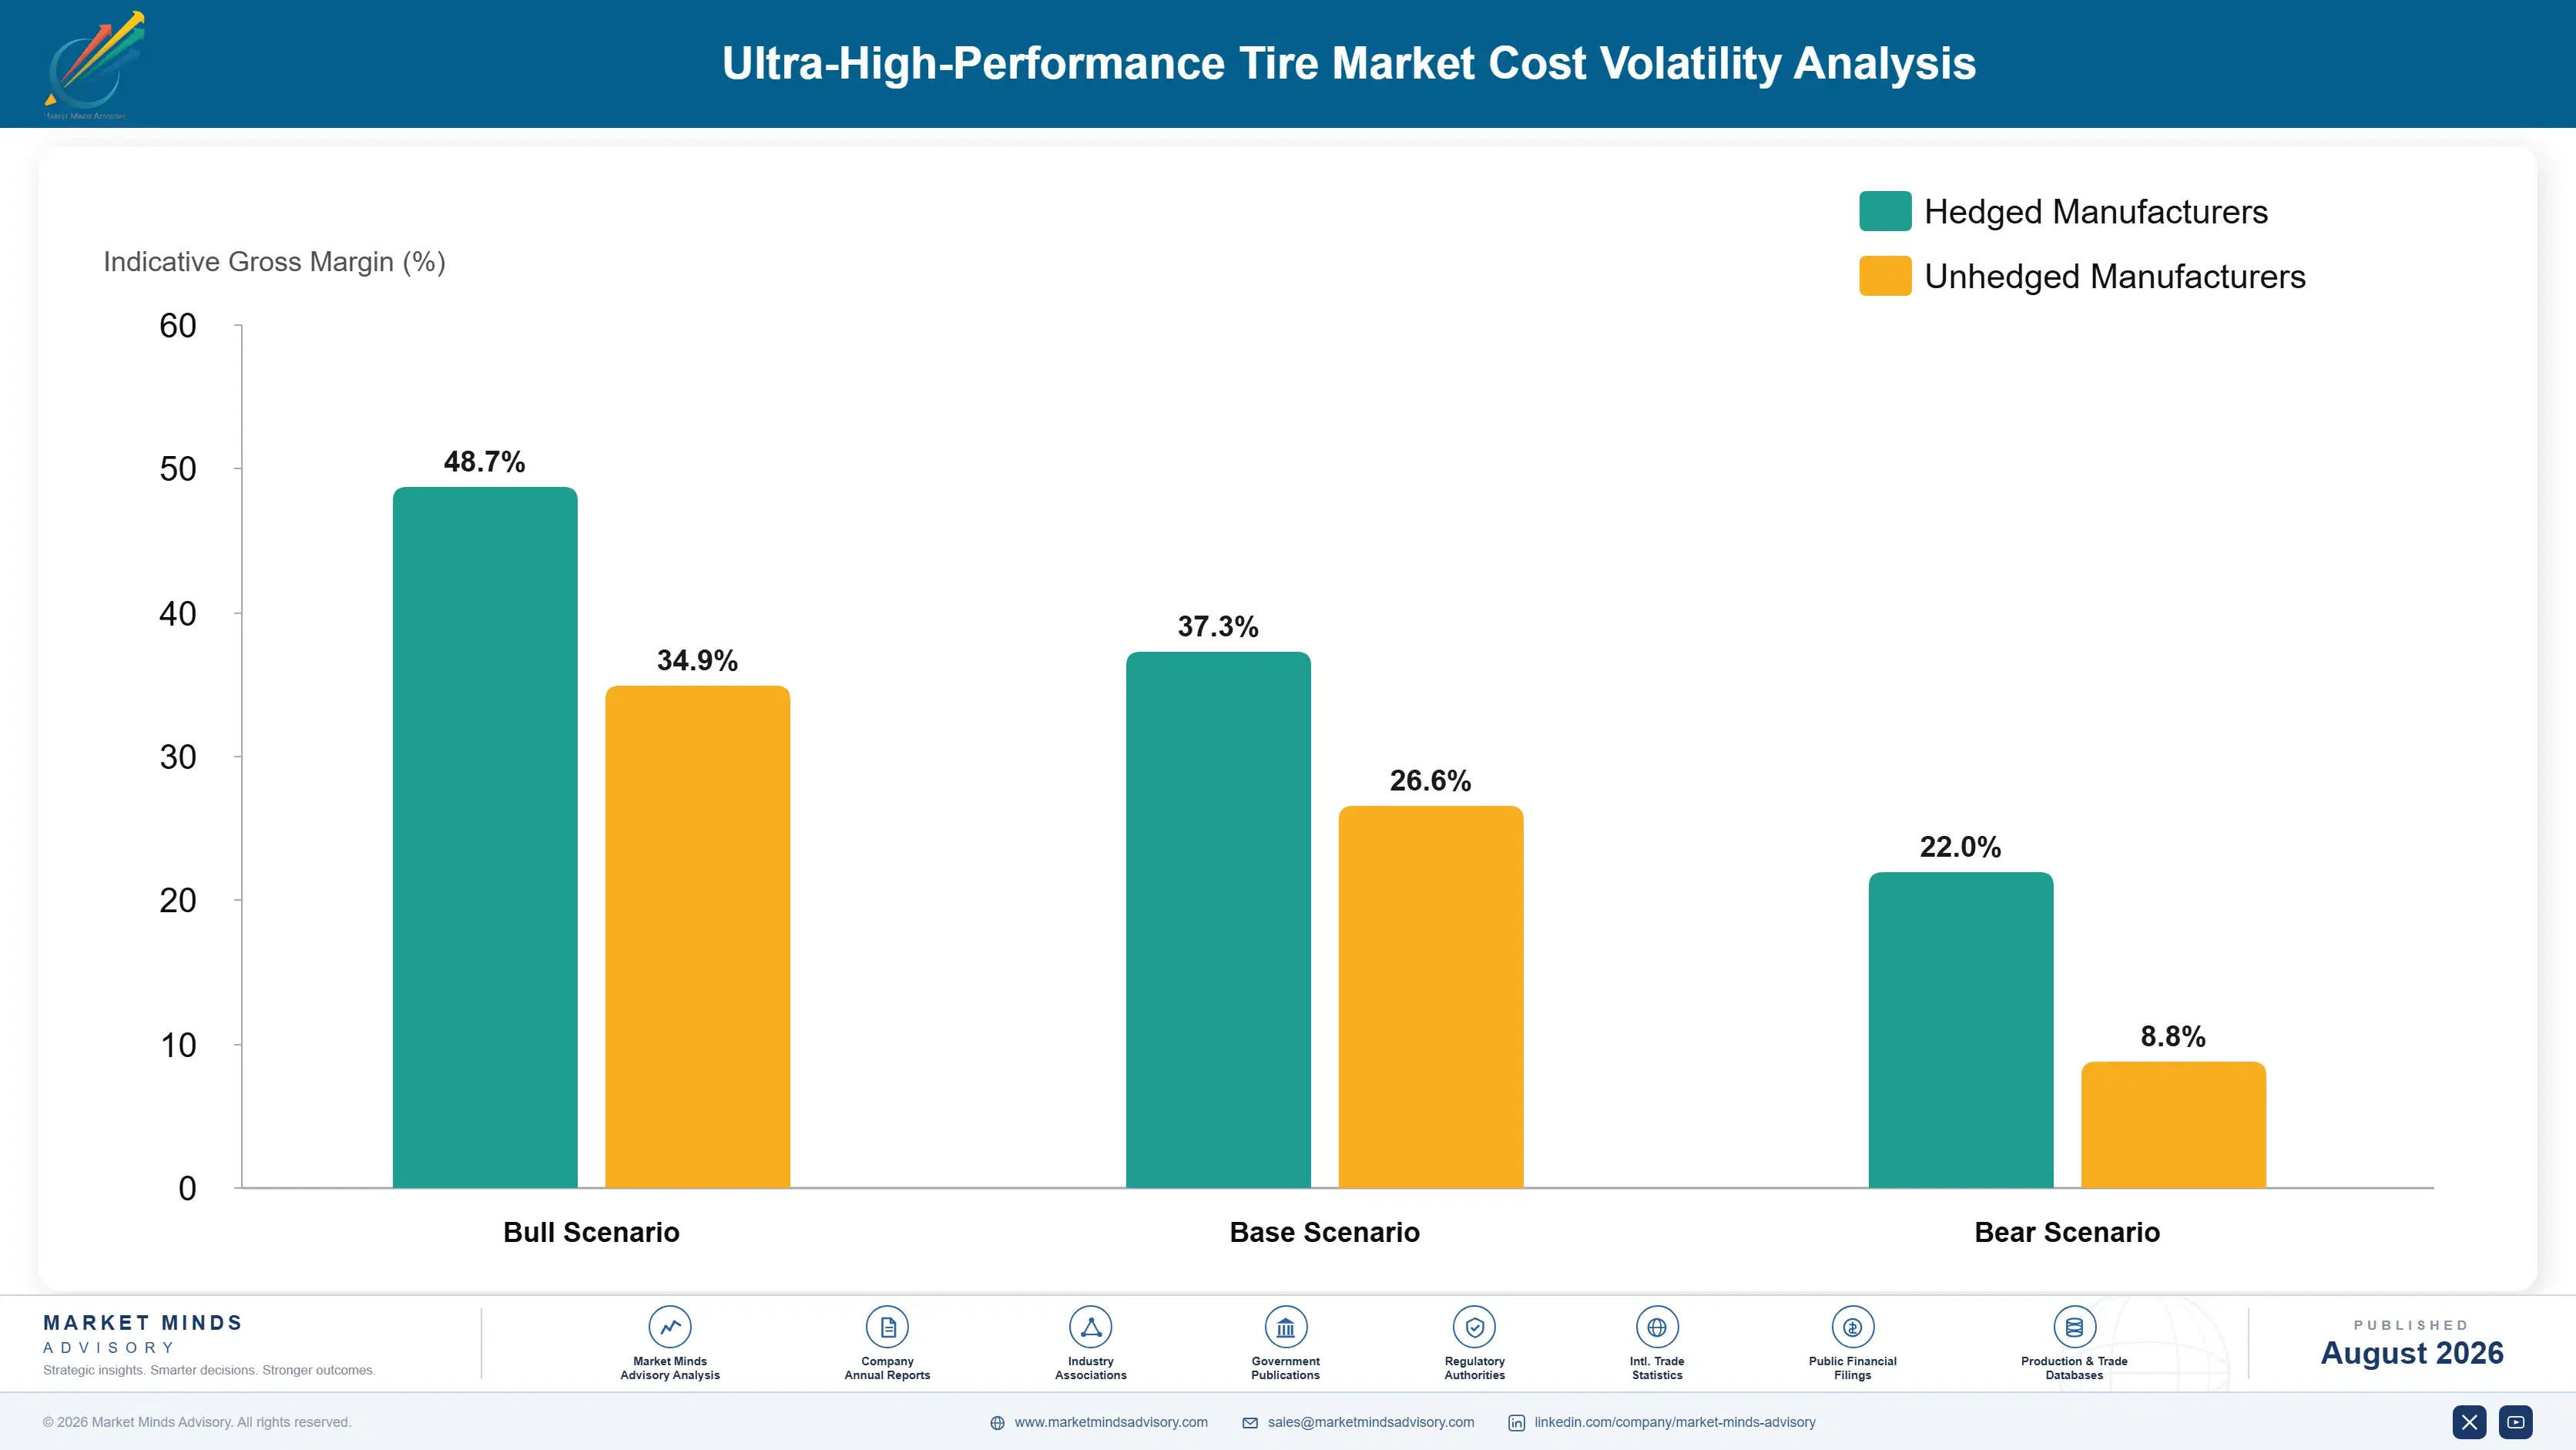
Rubber compounds including natural rubber, synthetic elastomers, silica and carbon black carry around 46% of manufacturing cost, higher than in standard tyres because performance compounds use more silica and functionalised polymer. Steel and textile reinforcement absorbs roughly 15%. Curing energy and mould amortisation account for about 12%, with mould cost spread across shorter runs given size proliferation. Labour, logistics and warranty provision take the balance.
Silica, functionalised polymer and natural rubber pricing all moved sharply across recent years, per International Energy Agency reporting on oil markets and Michelin annual reporting for 2025 on raw material cost commentary. Manufacturers passed movements through more readily in replacement than in original equipment, where contracts are fixed against vehicle programme timelines running several years at agreed prices. Budget tier makers absorbed the most of it.

Exposure divides on channel rather than on scale. An original equipment supplier carries compound cost against prices fixed for a programme life measured in years. A replacement focused maker resets pricing far more often and passes movements through readily. A budget tier manufacturer carries the same compound exposure against buyers who trade down at the first price increase, which is the least comfortable position of the three.
ultra-high-performance-tire-market-trends-cost-volatility-analysis-1787640970123

Index raw material exposure into original equipment contracts

Vehicle programme contracts fix tyre pricing for years while compound costs reset far more often, which leaves manufacturers absorbing movement they never agreed to carry. Indexation matched to programme duration addresses the actual shape of that exposure, and vehicle manufacturers accustomed to indexed steel and aluminium pricing generally accept the same mechanism once it is presented consistently.

Consolidate size proliferation to spread mould cost

Rim diameter inflation multiplied the number of sizes required without multiplying the volume behind each one, which spreads mould amortisation across shorter runs and raises cost per tyre. Working with vehicle manufacturers to consolidate fitment sizes across platforms reduces that burden considerably, though styling teams resist it more firmly than engineering teams do. Styling teams resist consolidation.

Provision realistically for wear warranty exposure

Tread life running around 38% below standard fitments makes any mileage warranty commercially serious rather than promotional, particularly on electric platforms where mass and torque accelerate wear further. Provisioning against measured rather than assumed wear avoids the position where a warranty designed as a marketing device becomes a genuine and unbudgeted liability. Measurement beats assumption here.

Portfolio Architecture for Margin Defence

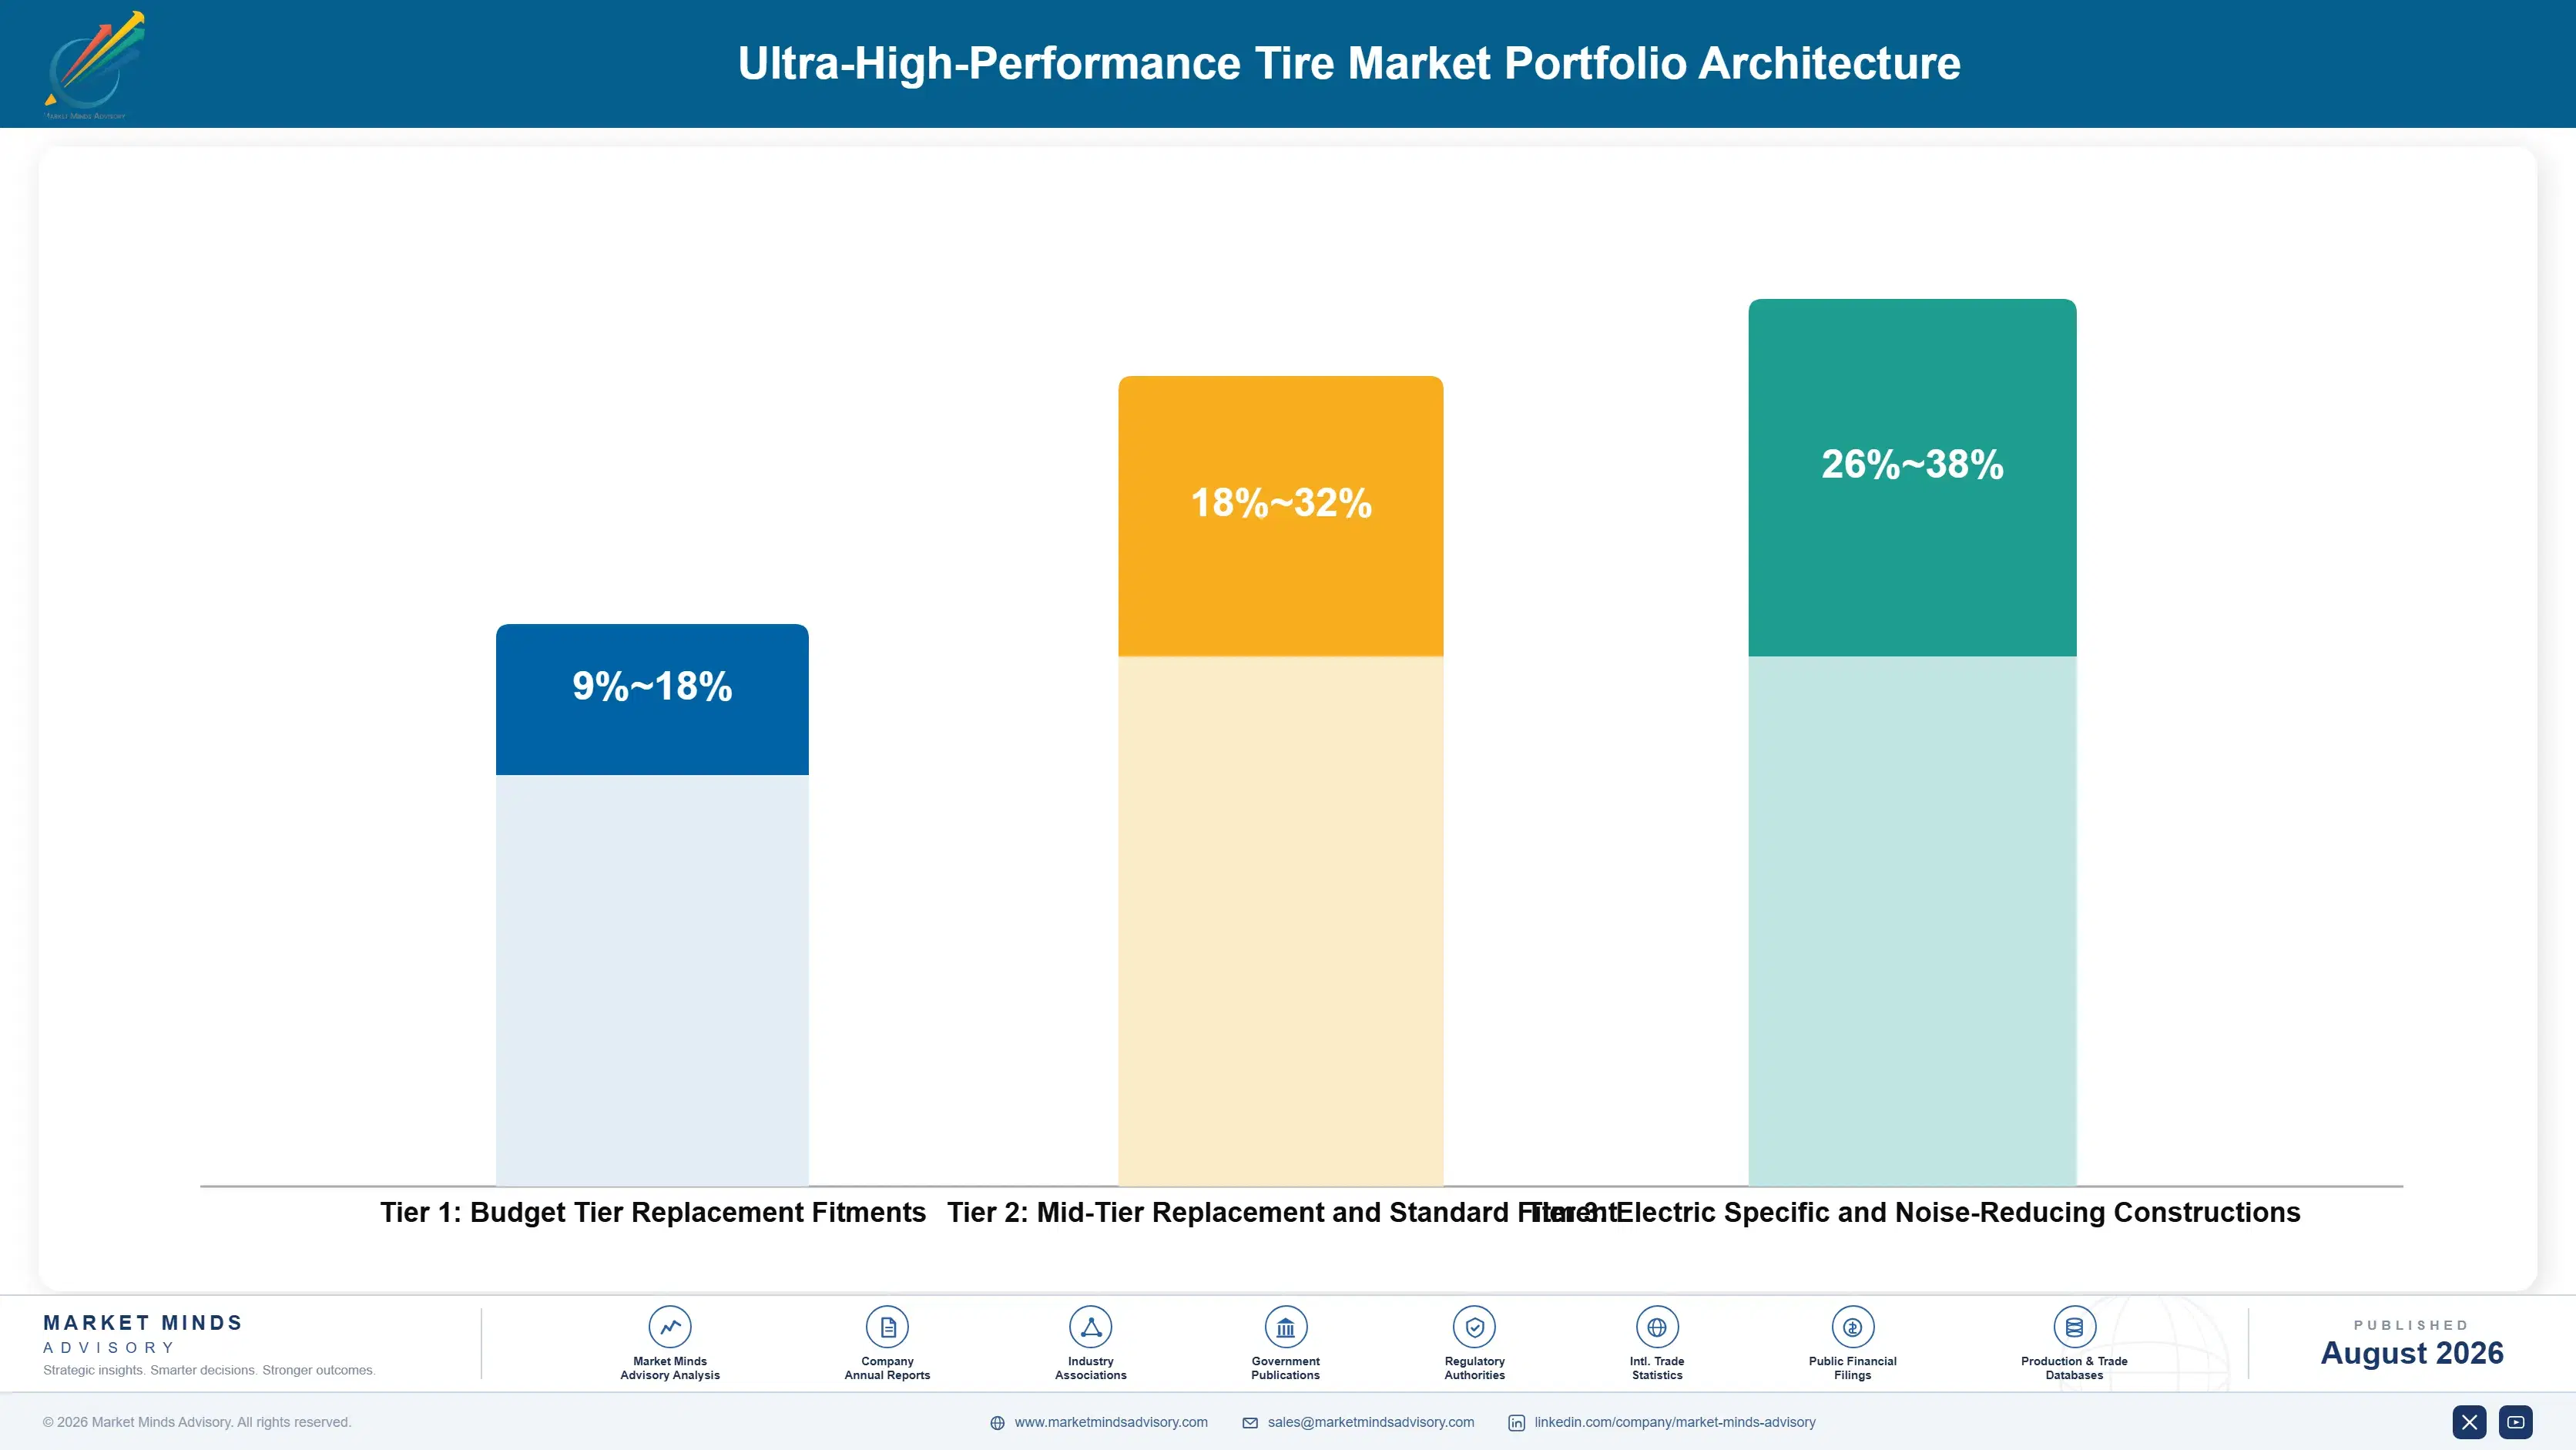
Margin here follows channel and brand rather than construction cost, because an owner who never chose the category replaces on retailer recommendation and brand familiarity rather than on any technical comparison. Budget tier replacement fitments earn margins in the high single digits to high teens, competing on price among buyers who resent what they are being asked to spend. Resentment about the price is the defining feature of that buyer.
Mid-tier replacement and standard original equipment fitments do better in the high teens to low thirties, because brand recognition carries genuine weight at the counter and original equipment volume is contracted and predictable. Retailer recommendation carries more weight than any advertising in this tier.

Electric specific and noise-reducing constructions hold the strongest position, reaching into the high thirties, where development capability limits the field and vehicle manufacturers approving a construction lock it in for the platform life. Those margins depend on the development investment continuing to differentiate, and would compress quickly if adapted constructions ever proved acceptable to vehicle programmes. Vehicle manufacturer approval rather than any retail argument is what sustains these margins over a platform life.

Budget Tier Replacement Fitments

Products bought by owners trading down within a category they cannot leave. The nine point range reflects manufacturing scale and compound sourcing rather than any performance difference buyers actually notice.
Gross Margin: 9-18%

Mid-Tier Replacement and Standard Fitment

Products carrying brand recognition at the counter and contracted original equipment volume. The fourteen point range reflects brand strength and how much fitment volume accompanies the replacement position. Continuity drives most purchases.
Gross Margin: 18-32%

Electric Specific and Noise-Reducing Constructions

Constructions requiring development capability few manufacturers can fund at all. The twelve point range reflects platform approval breadth and how long each fitment position runs before renewal. Approval holds for years.
Gross Margin: 26-38%
ultra-high-performance-tire-market-trends-portfolio-architecture-1787640970640

High-value Sub-segments and Strategic Watch-out

Electric Vehicle Specific UHP Tyres

High value and the fastest growth at 9.6%, balancing load capacity, rolling resistance and noise where adapted constructions satisfy none of them. Platform approval locks the position for years. Development investment rather than manufacturing scale is what limits the qualified field here. Entry is expensive.
Gross Margin: 26-38%

Self-Sealing and Noise-Reducing UHP

High value and growing at 8.8% on a benefit owners experience on every journey rather than never. Foam construction complicates repair, which retailers dislike and buyers rarely consider. Spare wheel deletion made puncture mobility a specification requirement rather than an option. Repair remains awkward. Premiums hold well.
Gross Margin: 28-40%

Summer UHP Replacement Fitments

The volume core, where owners who never chose the specification trade down within a category the rim prevents them leaving. Price rather than performance decides almost every purchase here. Retailer recommendation rather than any advertising decides which brand the owner ends up with. Price decides everything.
Gross Margin: 12-24%

Tread Life Expectation Gap

The strategic watch-out. Fitments deliver around 38% less mileage at 2.4 times the price, and the range reflects whether a maker answers wear credibly or keeps defending handling nobody uses. Wear warranties make the claim concrete at a counter where arguments are rarely welcome. Measurement beats assertion.
Gross Margin: 0-30%

Inherited, Then Repeated Reluctantly

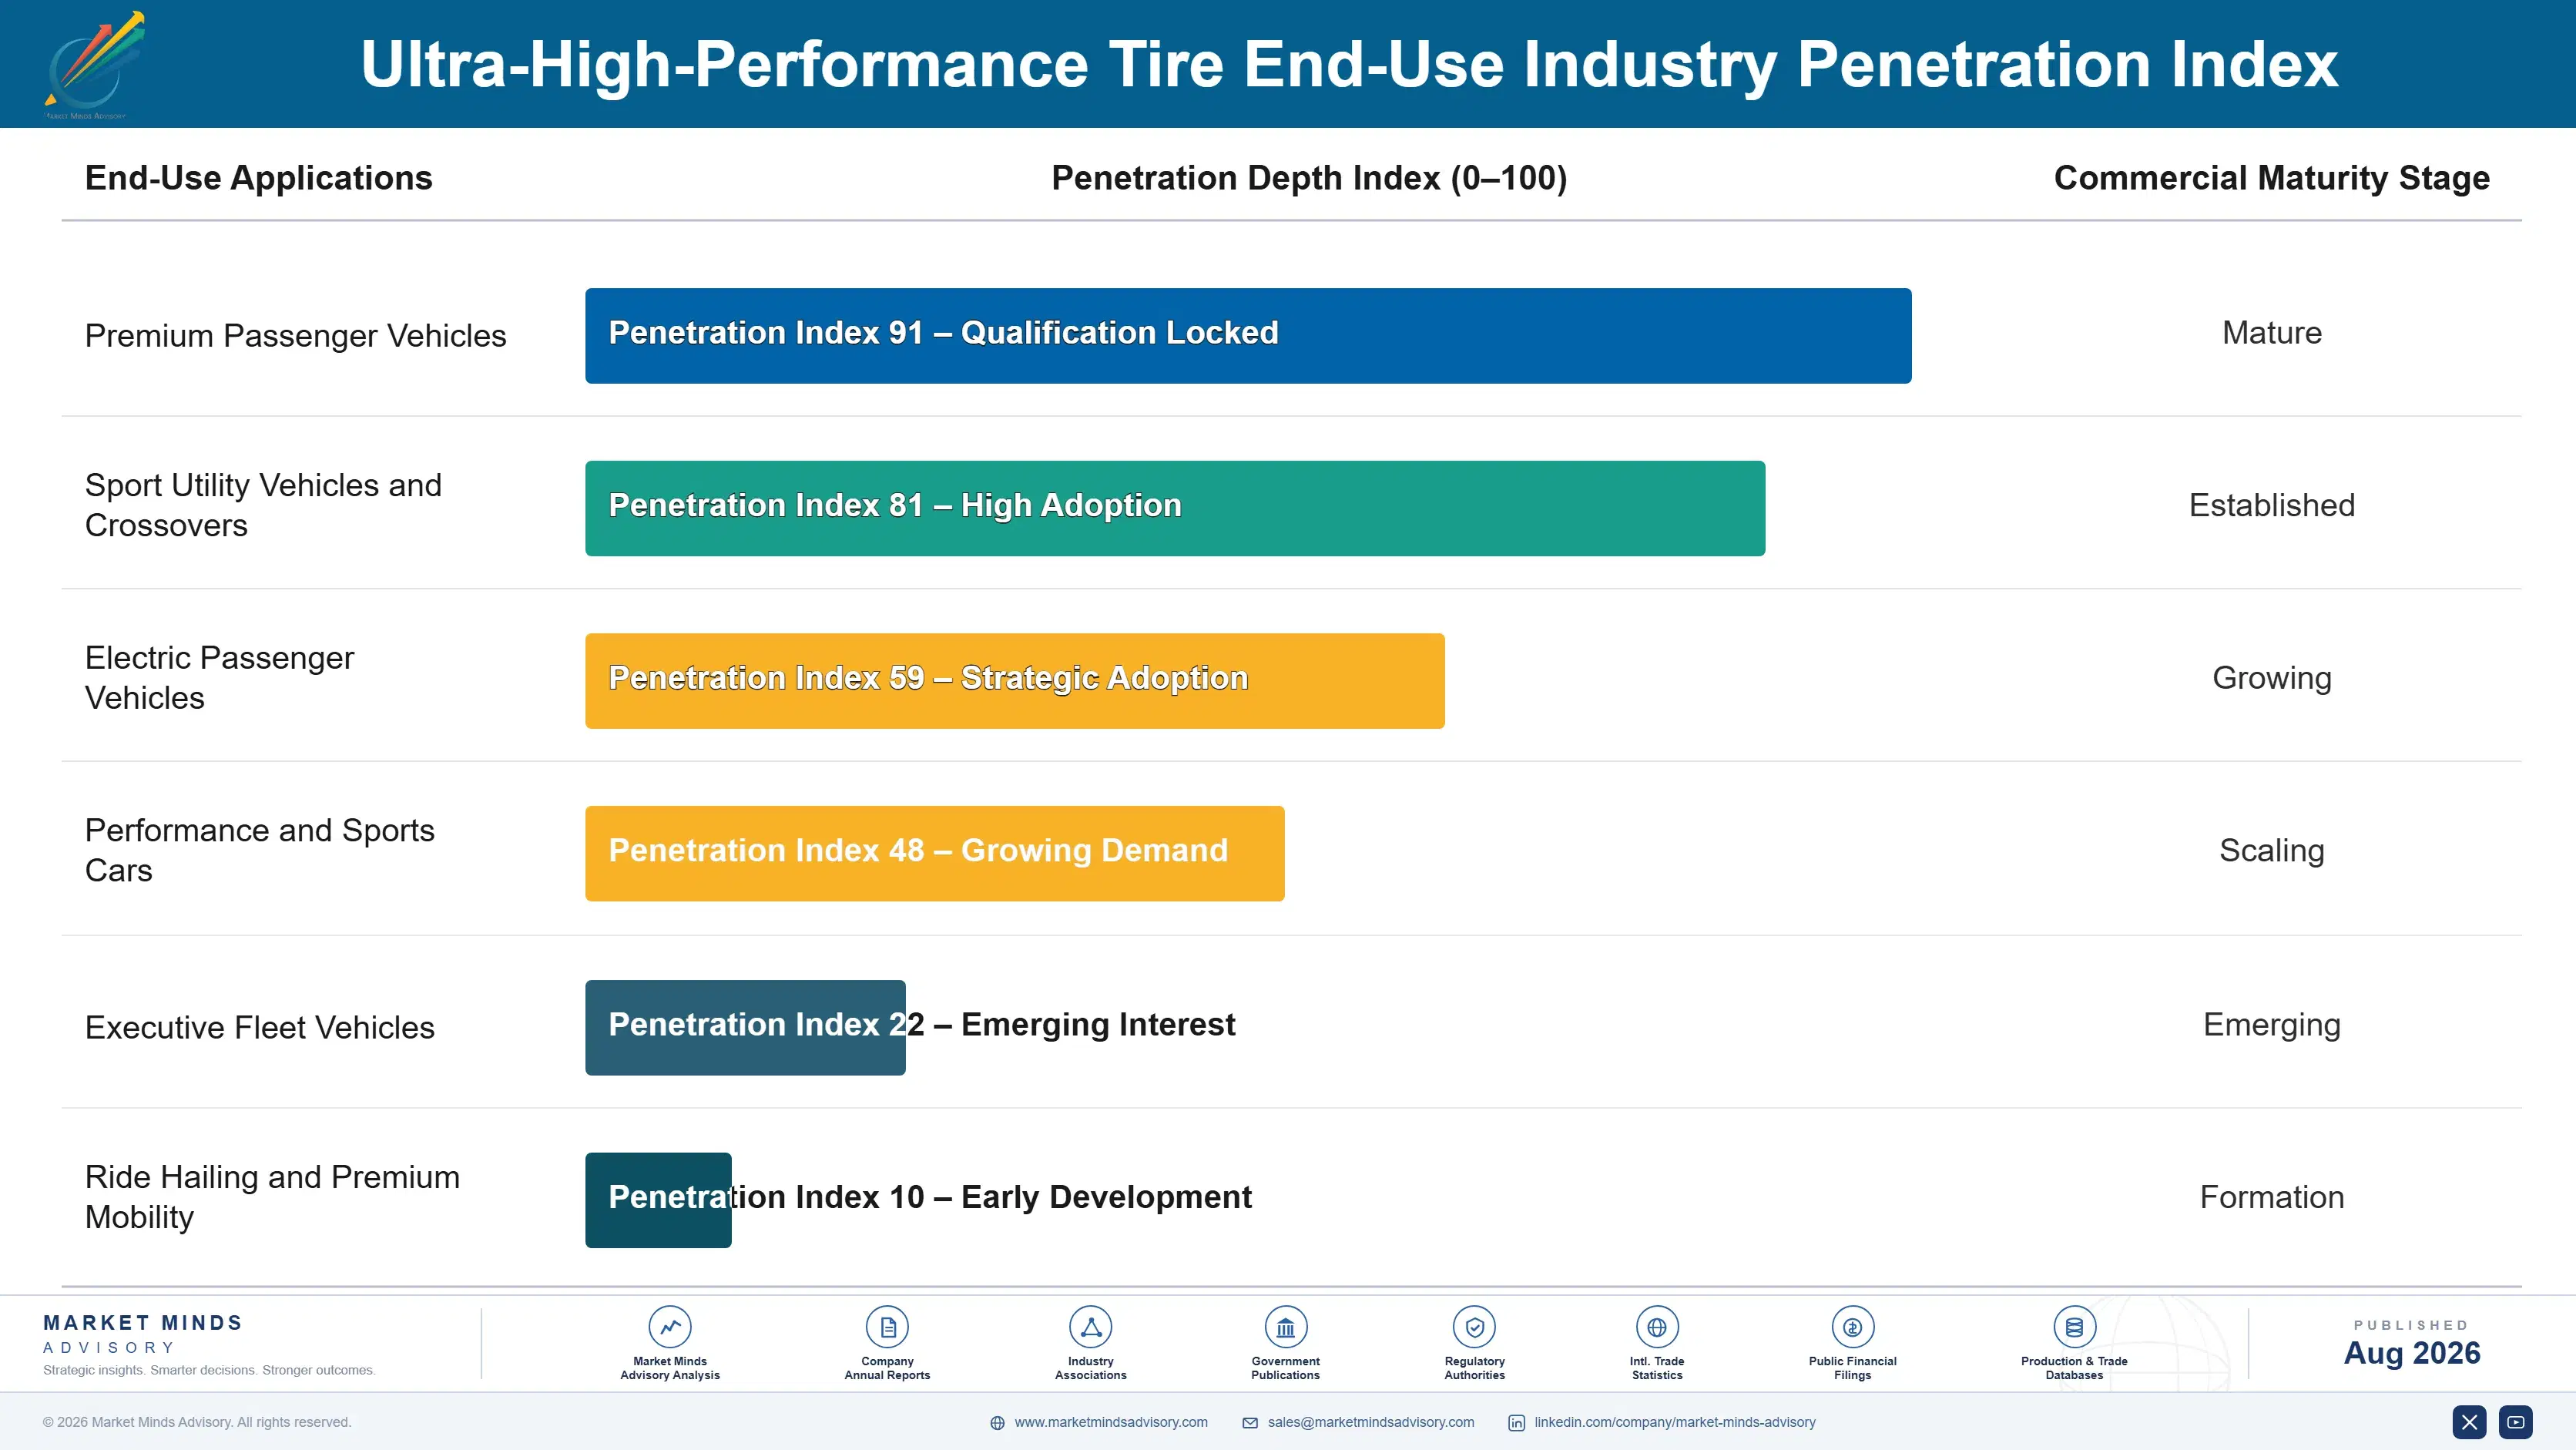
Demand here arrives in two quite different ways and most commercial planning treats them as one. Original equipment fitment is decided by vehicle manufacturers years before launch and delivered in contracted volume against a programme. Replacement arrives three or four years later from an owner who never made the original choice, cannot escape the category and is frequently unhappy about what it costs. Averaging the two misleads badly.
Stickiness runs through the vehicle rather than through the buyer. An owner replacing for the first time usually takes whatever the retailer recommends, and retailers recommend continuity with the original fitment because it is defensible and requires no explanation. That gives original equipment position a replacement inheritance worth several times the fitment volume itself, provided the price gap does not become intolerable.

The deciding party is therefore a vehicle designer choosing wheel diameter, followed by a tyre fitter making a recommendation at a counter. The owner sits between two decisions they did not make, which is why brand advertising aimed at drivers has consistently underperformed in this category relative to the money spent on it. Advertising has consistently underperformed here.
ultra-high-performance-tire-market-trends-end-use-penetration-index-1787640971138

Where We Would Put Effort

These are among the four positions where our research anticipates prominent divergence between winners and laggards over the coming forecast period. Each is grounded in the demand model, the regulatory perimeter, and the announced capacity pipeline.
01 / FITMENT POSITION PRIORITY

Replacement inherits what fitment decided

Owners who never selected the specification in the first place replace with whatever brand the vehicle arrived on, because they have no real basis for choosing otherwise and the retailer recommends continuity as the most defensible option available. Original equipment fitment therefore buys a replacement position several years later at no additional acquisition cost whatsoever to the supplier. Suppliers competing only in the replacement channel are contesting a decision that a vehicle manufacturer effectively made on the owner's behalf several years earlier.
02 / TREAD LIFE HONESTY

Stop defending grip nobody uses

The complaint is straightforward: a replacement costs around 2.4 times a standard fitment and lasts roughly 38% less far, while about 71% of those owners never once approach the speed rating they are actually carrying. Defending handling capability answers a benefit that those owners genuinely never experience at any point. Constructions that trade a little dry grip for meaningful additional mileage address what buyers actually resent about the category, and wear warranties make that concrete at the retail counter itself.
03 / CABIN NOISE POSITIONING

The engine stopped covering for you

Tread pattern noise was always present and always masked by a combustion engine sitting a few feet in front of the driver, and electric drivetrains have now removed that cover from the driver completely. Noise-reducing constructions are growing at 8.8% and now command a premium that pure handling capability has never once justified to owners who do not use it. Presenting measured cabin noise rather than lateral grip figures reaches buyers on something they genuinely experience during every single journey.
04 / WHEEL DATA TARGETING

Rim size, not vehicle class, creates this

This category is created by rim diameter alone rather than by any vehicle segment, and China grows fastest of any country covered at 11.4% precisely because wheel inflation and electric adoption happen to arrive there together. Suppliers still targeting premium vehicle segments are missing ordinary family models that crossed the nineteen inch threshold without ever changing price bracket at all. Registration data carries wheel specification and predicts this demand precisely, yet almost nobody in the industry currently uses it for planning.

Engagement Snapshot From the Field

A live engagement with an industry participant carrying material or product regulatory and market exposure ahead of a defining policy shift, showing how our research translates into a defensible multi-year portfolio strategy.
MARKET MINDS ADVISORY · CLIENT ENGAGEMENT SUMMARY
Ultra-High-Performance Tire Producer Strategic Portfolio Review and Transition Roadmap 2026·Investment Scenario on Ultra-High-Performance Tire Exposure Evaluation 2025-26
CLIENT PROFILE
A tyre manufacturer supplying replacement and original equipment fitments across European and Asian markets at annual revenue near 3.1 billion dollars (client-reported, unverified by MMA). Marketing ran through driver facing performance advertising and electric platform development capability was limited. Commercial planning targeted premium vehicle segments rather than wheel diameter data. Wear performance was never communicated.
STRATEGIC CHALLENGE
Replacement share was eroding toward budget brands while original equipment fitment held, and electric vehicle programmes were specifying constructions the business could not offer. Management wanted to understand whether those two problems shared a cause. Advertising spend had risen for three consecutive years without any measurable effect. Something structural was wrong.
MMA APPROACH
MMA analysed replacement purchase decisions at retail level to establish what actually drove brand selection, quantified tread life and price gaps against owner complaint data, mapped wheel diameter distribution across new vehicle registrations, and assessed electric construction development requirements. Interviews with 47 experts covered vehicle engineering, tyre retail, compound development and fleet operations.
KEY FINDINGS
  1. Replacement buyers followed retailer recommendation in the overwhelming majority of observed transactions, and driver facing advertising influenced almost none of them measurably.
  2. Complaints centred on cost and tread life rather than on performance, while nearly all marketing spend defended handling characteristics most owners never experienced at all.
  3. Wheel diameter rather than vehicle segment predicted category membership, and the client's targeting had been built entirely around premium vehicle classifications instead.
  4. Electric construction development required investment the business had deferred twice, and each deferred platform represented a fitment position lost for its whole production life.
CLIENT PROFILE
A tyre manufacturer supplying replacement and original equipment fitments across European and Asian markets at annual revenue near 3.1 billion dollars (client-reported, unverified by MMA). Marketing ran through driver facing performance advertising and electric platform development capability was limited. Commercial planning targeted premium vehicle segments rather than wheel diameter data. Wear performance was never communicated.
STRATEGIC CHALLENGE
Replacement share was eroding toward budget brands while original equipment fitment held, and electric vehicle programmes were specifying constructions the business could not offer. Management wanted to understand whether those two problems shared a cause. Advertising spend had risen for three consecutive years without any measurable effect. Something structural was wrong.
MMA APPROACH
MMA analysed replacement purchase decisions at retail level to establish what actually drove brand selection, quantified tread life and price gaps against owner complaint data, mapped wheel diameter distribution across new vehicle registrations, and assessed electric construction development requirements. Interviews with 47 experts covered vehicle engineering, tyre retail, compound development and fleet operations.
KEY FINDINGS
  1. Replacement buyers followed retailer recommendation in the overwhelming majority of observed transactions, and driver facing advertising influenced almost none of them measurably.
  2. Complaints centred on cost and tread life rather than on performance, while nearly all marketing spend defended handling characteristics most owners never experienced at all.
  3. Wheel diameter rather than vehicle segment predicted category membership, and the client's targeting had been built entirely around premium vehicle classifications instead.
  4. Electric construction development required investment the business had deferred twice, and each deferred platform represented a fitment position lost for its whole production life.
RECOMMENDED STRATEGY
Phase 1: Phase one: redirect marketing spend from driver advertising toward retailer recommendation programmes, since fitters decide the overwhelming majority of replacement purchases. Phase 2: Phase two: develop and communicate wear performance rather than handling, because cost and mileage are what owners actually complain about. Phase 3: Phase three: fund electric platform construction development, as every deferred programme is a fitment position lost for years. Each deferral compounds the gap.
OUTCOME
The manufacturer redirected marketing toward retailer programmes during 2026 and replacement share stabilised in two major markets (client-reported, unverified by MMA). Wear performance messaging was introduced, and electric construction development was funded for two platforms. Driver facing performance advertising was reduced substantially across every major market.

Frequently Asked Questions

Foundational context covering the market sizes, CAGR, scope, country, region and competition that inform every finding below. This section is provided to cover basics and most often pre-purchase conversations, answered from the MMA Primary Research Dataset.

What is the current size of the Ultra-High-Performance Tire Market?

MMA sizes it at USD 42.0 billion in 2025, rising to USD 44.69 billion in 2026. The figure covers passenger tyres rated V and above at manufacturer selling value.

How large will the Ultra-High-Performance Tire Market be by 2036?

USD 83.10 billion by 2036, an incremental USD 38.41 billion over the 2026 base and an expansion multiple of 1.86 times. Electric specific constructions carry a disproportionate share.

What is the CAGR for the Ultra-High-Performance Tire Market 2026 to 2036?

6.4% in the base case, with a bull case at 7.6% and a bear case at 5.2%. Electric vehicle share and trading down behaviour drive most of the spread.

Which segment is growing fastest?

Electric vehicle specific fitments at 9.6%, half again the market rate of 6.4%. They balance load capacity, rolling resistance and noise that adapted constructions cannot deliver together.

Who are the major companies in the Ultra-High-Performance Tire Market?

Michelin, Bridgestone, Continental, Goodyear and Pirelli lead on performance tyre revenue. Fifteen further participants are profiled in the full report on the same consistent revenue basis throughout.

Which country is growing fastest?

China at 11.4%, where electric vehicle adoption, rim diameter inflation and domestic premium tyre capability are all advancing at once, which no other market has assembled.

Report Segmentation Architecture

The full report scope spans multiple orthogonal segmentation dimensions, with cross-tabulated demand data provided for each dimension pair. Coverage extends further to regional breakdowns, trend trajectories, and the competitive detail needed to support segment-level decision-making.

By Construction Type

  • Summer UHP Tyres
  • All-Season UHP Tyres
  • Electric Vehicle Specific UHP Tyres
  • Run-Flat and Self-Supporting UHP
  • UHP Winter and Performance Winter
  • Self-Sealing and Noise-Reducing UHP

By End-Use Industry

  • Premium Passenger Vehicles
  • Sport Utility Vehicles and Crossovers
  • Electric Passenger Vehicles
  • Performance and Sports Cars
  • Executive Fleet Vehicles
  • Ride Hailing and Premium Mobility

By Commercial Dimension

  • Original Equipment Fitment Contracts
  • Independent Tyre Retail
  • Franchised Dealer Service
  • Online Retail and Fitting Networks
  • Fleet Supply Agreements
  • Distributor and Wholesale Channels

By Region

  • North America
  • Western Europe
  • East Asia
  • South Asia and Pacific
  • Latin America
  • Middle East and Africa
  • Eastern Europe

Scope, Methodology, and Coverage

Every figure in this report is reproducible from documented input assumptions. The scope below maps the historical period, the forecast horizon, the segmentation dimensions, and the countries covered, alongside the underlying primary and qualitative methodology.
Historical Period
2020 to 2025
Forecast Period
2026 to 2036
Base Year
2025 (USD billions; MMA Primary Research Dataset, August 2026)
Market Definition
Passenger tyres rated V and above, typically fitted to rims of seventeen inches and larger with low aspect ratio construction, covering summer UHP tyres, all-season UHP tyres, electric vehicle specific UHP tyres, run-flat and self-supporting UHP, UHP winter and performance winter, and self-sealing and noise-reducing UHP. Measured at manufacturer selling value across original equipment and replacement channels. Standard touring and economy tyres, commercial vehicle tyres, motorsport tyres, and tyre raw materials are excluded from scope.
Quantitative Units
USD billions (current prices); units shipped; USD per unit by construction type
Segmentation Dimensions
Construction type; end-use industry; commercial dimension; region
Regions Covered
North America, Western Europe, East Asia, South Asia and Pacific, Latin America, Middle East and Africa, Eastern Europe
Countries Covered
United States, Canada, Mexico, Germany, United Kingdom, France, Italy, Spain, China, Japan, South Korea, Taiwan, India, Australia, Thailand, Brazil, Argentina, United Arab Emirates, South Africa, Poland
Key Companies Profiled
Michelin, Bridgestone, Continental, Goodyear, Pirelli, Sumitomo Rubber Industries, Yokohama Rubber, Hankook Tire, Kumho Tire, Nexen Tire, Toyo Tire, Nokian Tyres, Apollo Tyres, Sailun Group, Zhongce Rubber Group, Linglong Tire, Giti Tire, Cheng Shin Rubber, Kenda Rubber, Triangle Tyre
Quantitative Methodology
Primary survey, n=3,800 respondents, Q4 2025, six countries; demand-side model with trade association cross-validation
Qualitative Methodology
47 expert interviews, Q4 2025; applied to validate demand model assumptions, identify emerging dynamics, and assess competitive positioning
Report Format
PDF and XLSX data workbook (Word format preview document)
Publisher
Market Minds Advisory
Report Code
MMA-2026-AUT-102
Published
August 2026
Contact
sales@marketmindsadvisory.com | www.marketmindsadvisory.com

Purchase the full Ultra-High-Performance Tire Market Report (2026 to 2036).

The full report treats ultra-high-performance fitment as a category created by wheel design rather than by driving preference, which explains both its growth and the resentment that surfaces at first replacement. It sizes all six constructions independently through 2036, quantifies price and tread life gaps against owner complaint data, and maps wheel diameter distribution across new vehicle registrations. Regional chapters cover all seven regions with rim size tracked separately from vehicle segment. Competitive profiling covers 20 participants on one consistent revenue basis. Replacement inheritance is traced from fitment position throughout.
Six constructions sized independently through 2036
Price and tread life gaps quantified against owner complaint data
Wheel diameter distribution mapped across new vehicle registrations
Rim size tracked separately from vehicle segment by region
Replacement inheritance measured against original equipment fitment position
Twenty participants profiled on one consistent revenue basis

Built For The People Who Decide

From boardroom strategy to bench-side execution, this report is read cover-to-cover by leaders shaping the next decade of their industry, turning demand scenarios, market dynamics and valuation benchmarks into decisions.
CXOs/ Presidents/ VPs/ Managers
M&A and Corporate Development
Strategy Teams and R&D Heads
Procurement and Product Directors
Regulatory and Compliance Leaders
Investor Relations and Equity Analysts