Market Minds Advisory
Remotely Operated Vehicles (ROV) Market

Remotely Operated Vehicles (ROV) Market: The Vessel Above Costs More Than The Robot Below

A support vessel accounts for roughly 78% of what an intervention day costs, which means the most valuable thing this industry can build is a vehicle that no longer needs one.

Lead Analyst

David Horsley

Published

August 2026

Make Smarter Decisions with Customized Research Insights

Request a free sample report and evaluate market opportunities, growth trends, and competitive dynamics relevant to your business needs.

2025 MARKET VALUE$3.1BMarket Size 2025
2036 FORECAST VALUE$7.4BBase Case , 2026 to 2036
CAGR 2026 TO 20368.2 %Bull 9.4% / Bear 7.0%
INCREMENTAL OPPORTUNITY$4.0BNet 10- year value creation
EXPANSION MULTIPLE2.20x2036 value over 2026 base
Strategic Levers
M&A Pipeline
Regional Outlook
Country Rankings
Competitive Intelligence
Segmental Deep-dive
Call-Us : 91 93563 13602

Executive Snapshot and Market Trajectory

The vehicle is not the expensive part. A support vessel carries roughly 78% of what a subsea intervention day costs, so every commercial argument in this industry eventually reduces to how much vessel time a given vehicle removes. That ratio explains where the technology is going.
Growth runs at 8.2% and resident systems lead it. Permanently deployed subsea vehicles grow at 12.3%, exactly 1.50 times the market rate, because a system living on the seabed and controlled from shore removes the vessel entirely rather than merely shortening its charter. Latin America holds 23%, far outside band, since Brazilian pre-salt operates more deepwater subsea infrastructure than any other province. Every other question follows from it.
Concentration is moderate at 47% across the top five measured on systems under operational management, and offshore crewing depth holds it more than vehicle technology does. Running a work class system continuously takes six offshore personnel per shift pattern, and that constraint has shaped this industry far more than any manufacturer's capability ever has. A competitor can buy vehicles in months and cannot staff them for years. Fleet growth is a people problem.
Market Definition
This market covers remotely operated underwater vehicle systems and the services delivered with them, spanning work class ROV systems, light work class systems, observation and inspection class vehicles, resident and remotely operated subsea systems, and ROV tooling and intervention packages. Autonomous underwater vehicles operating without a tether, support vessels and their chartering, subsea production equipment, diving services and saturation systems, survey sensors sold independently of vehicle systems, and subsea cable and pipeline installation spreads fall outside scope.
Base Year Value
$3.1B in 2025 (MMA Primary Research Dataset, August 2026)
Forecast Period
2026 to 2036, eleven discrete annual values
CAGR
8.2% base case. Bull 9.4%. Bear 7.0%.
Fastest Growth Segment
Resident and Remotely Operated Subsea Systems: 12.3% CAGR
Fastest Growth Country
Guyana: 12.4% CAGR
Fastest Growth Region
South Asia and Pacific: 10.2% CAGR
Largest Region
Latin America: 23% of 2025 global value
Market Leaders
Oceaneering International, Fugro, Subsea7, DOF Group, TechnipFMC. Source: MMA Analysis based on company annual reports.
Primary Survey
n=3,800 procurement and R&D decision-makers, Q4 2025, six countries
Methodology
Demand-side build-up, cross-validated against public data, 47 expert interviews

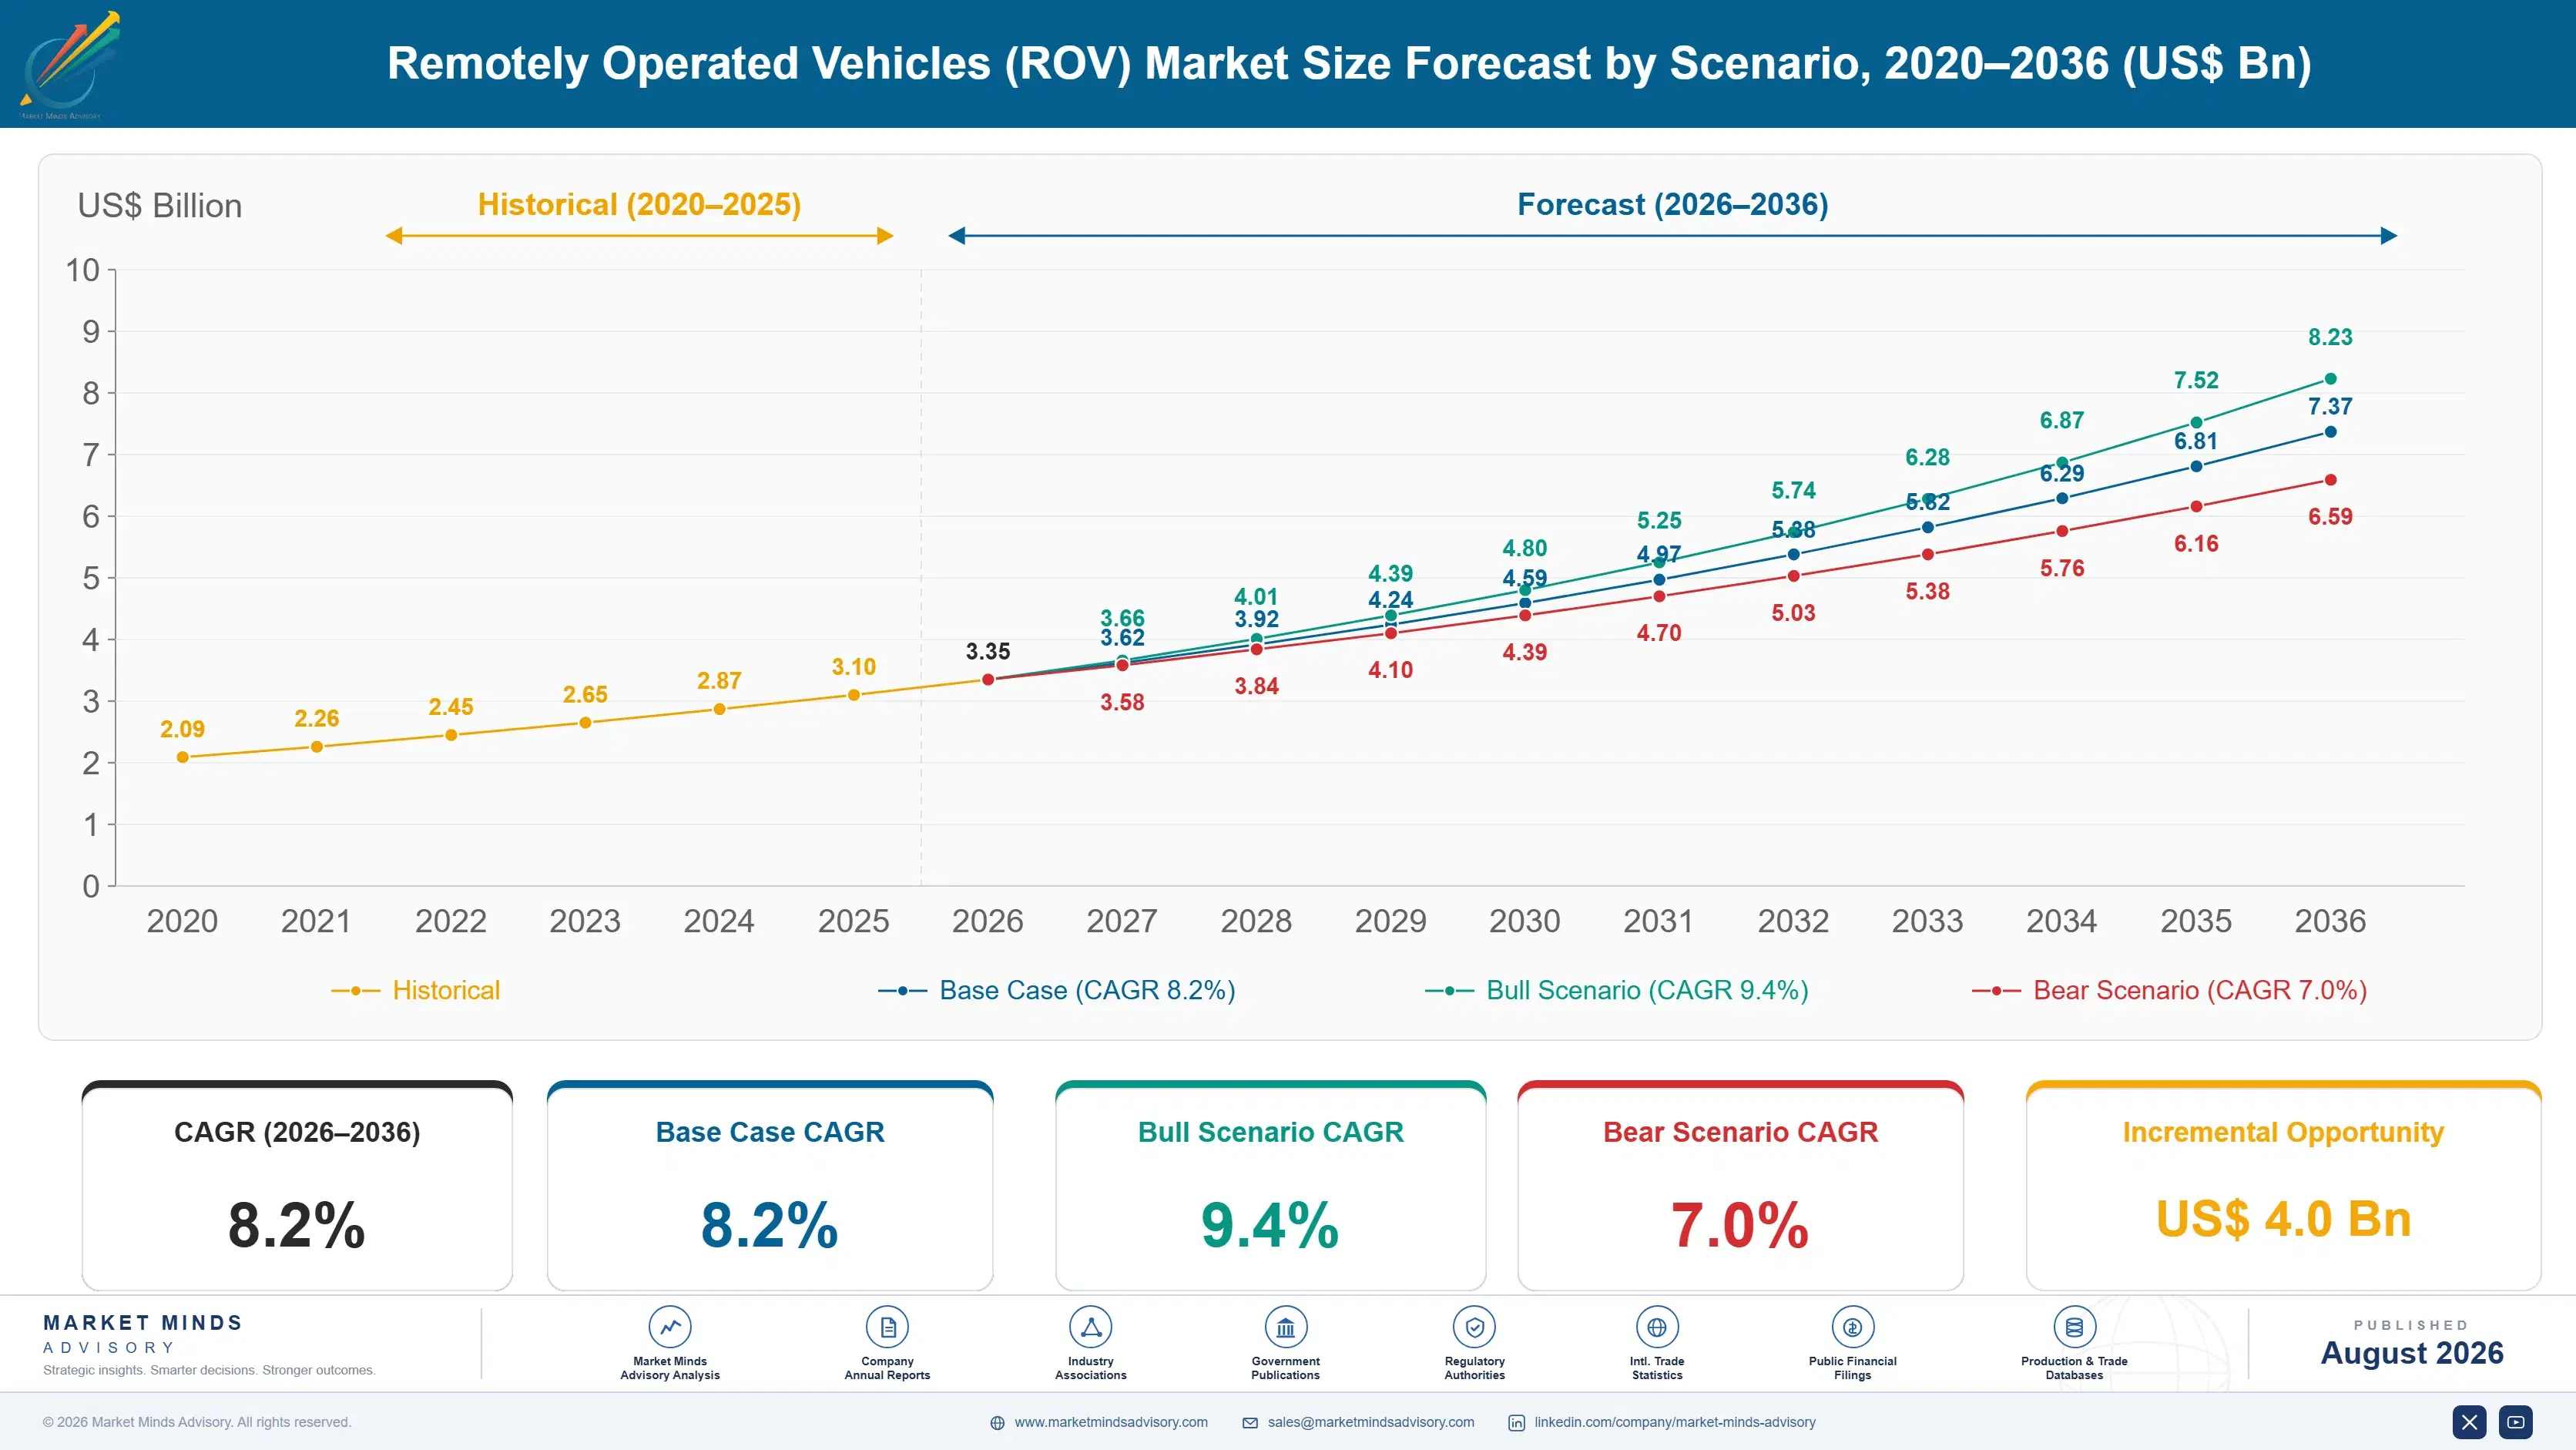
Remotely Operated Vehicles (ROV) Market Forecast Scenarios

remotely-operated-vehicles-rov-market-size-forecast-scenario-1787302776272
The 2020 to 2025 period ran at 6.8% and the mix shifted more than the rate suggests. Offshore oil and gas activity collapsed in 2020 and recovered strongly from 2022, while offshore wind inspection and cable survey work grew throughout without any comparable interruption. Resident systems moved from single demonstration deployments into small operating fleets across the same period, which nobody in the
Three mechanisms carry the 8.2% base case. Deepwater subsea infrastructure inspection is the largest, since every subsea tree, manifold, and flowline installed over the last two decades now requires periodic intervention regardless of oil price. Offshore wind inspection is the second, growing with installed turbine and cable populations. And resident systems are the third, at 12.3%, driven by the vessel cost they eliminate rather than by any capability gain. Decommissioning adds days beneath all three.
The 9.4% bull case rests on resident deployment scaling faster than operators currently plan, which would expand the market by converting vessel charter spend into vehicle and shore control spend. The 7.0% bear case is a sustained oil price fall deferring offshore activity, since inspection can be delayed for a season and intervention campaigns get postponed before anything else does.

Removing The Vessel Is The Product

Every commercial argument in this industry reduces to vessel time. A support vessel carries roughly 78% of what an intervention day costs, and the vehicle, its tooling, and its crew make up the remainder between them. An operator comparing two ROV suppliers is really comparing how many vessel days each will consume, and the difference between them is worth far more than any equipment pricing gap.
TOP FIVE CONCENTRATION47%Moderate, held through fleet scale and offshore crewing depth
VESSEL SHARE OF COST78%Of a subsea intervention day, before the vehicle itself
WORK CLASS FLEET SIZE1,150Systems in operation across the global offshore industry today
FLEET UTILISATION RATE72%Across work class systems through the last full year
RESIDENT SYSTEM DEPLOYMENTS34Permanently subsea installations operating without any support vessel above
PILOT CREW PER SYSTEM6Offshore personnel required to run continuous operations around the clock
That logic explains the technology direction. Resident systems live on the seabed, are controlled from an onshore centre, and remove the vessel entirely rather than merely shortening its charter, which is why they grow at 12.3% from a base of only 34 deployments. Adoption is slower than the economics alone would suggest because operators need confidence that a vehicle nobody can reach will keep working.
Crewing shapes the competitive structure more than technology does. A work class system running continuously needs six offshore personnel across its shift pattern, and those pilots and technicians take years to develop and are difficult to recruit. Concentration at 47% follows from that as much as from fleet ownership, since a competitor can buy vehicles considerably faster than it can staff them.
"Operators tell us they want a better ROV. What they actually want is fewer vessel days, and if you hand them a mediocre vehicle that halves the vessel time they will take it every single time."
Director, Subsea Technology and Offshore Operations Practice · MMA Subsea Techno

Market Trends

Resident Systems Convert Vessel Spend Into Vehicle Spend

Permanently deployed subsea vehicles controlled from shore grow at 12.3% against 8.2% for the market, from a base of 34 deployments. The commercial case is arithmetic rather than technical, since a vessel carries roughly 78% of intervention day cost and a resident system removes it altogether. Adoption lags the economics because operators need confidence that a vehicle they cannot physically reach will keep functioning through a full deployment period. Norwegian operators have deployed more of them than anybody, treating residency as an operating cost decision. Others still call it a trial. The economics do not differ.
Market Impact: Fleet utilisation runs near 72%
Offshore Wind Inspection Builds A Non-Cyclical Base

Installed turbine foundations, scour protection, and export cables all require periodic inspection that grows with the operating fleet rather than with any capital cycle, which gives this work a stability offshore oil and gas has never had. Observation and inspection class vehicles grow at 9.8% partly on that. The work uses smaller vehicles from smaller vessels, which suits a different fleet and a different cost structure entirely. Wind operators will not charter a dedicated construction spread for a survey campaign at any price. That constraint favours smaller vehicles. It also opens the work to smaller providers.
Market Impact: Around 1,150 work class systems ope

Market Opportunities and Growth Drivers

Installed Subsea Infrastructure Requires Intervention Regardless

Two decades of subsea trees, manifolds, jumpers, and flowlines are now in the water, and every one of them needs periodic inspection, valve intervention, and anomaly investigation whatever the oil price does. That demand scales with installed base rather than with new development spending, which makes it the most predictable revenue in an otherwise cyclical industry. Operators defer it for a season at most before integrity management obligations force the work. Integrity management obligations set the schedule rather than any commercial judgement about timing. Deferral is possible for a season. It is not possible indefinitely.
Market Impact: Each system needs 6 offshore crew

Deepwater Development Cannot Proceed Without Vehicles

Beyond diver depth every subsea task requires a vehicle, which makes ROV demand a direct function of water depth rather than of production volume. Brazilian pre-salt, Guyanese, and West African developments all sit well past any diving envelope. That dependency is absolute rather than economic, and no operator has ever cancelled an ROV spread and continued a deepwater campaign without one in any circumstances. Water depth rather than production volume therefore determines how much vehicle time a field consumes across its life. Brazilian and Guyanese fields sit well past any diving envelope. So does most of West Africa.
Market Impact: Fleet utilisation sits at 72%

Market Restraints and Challenges

Offshore Crewing Limits How Fast Fleets Grow

A work class system running continuously needs six offshore personnel across its shift pattern, and the root cause is that ROV pilot technicians take years to develop through supervised offshore hours that cannot be compressed or simulated away. Commercial impact is that fleet expansion is limited by people rather than by vehicles or capital. Mitigation runs through structured cadet programmes, onshore control centres that move some roles ashore, and automation of routine flying tasks. Providers that paused training through the last downturn could not bid work they already owned vehicles for. The gap took years to close.
Market Impact: Resident systems grow at 12.3%

Vessel Availability Governs Utilisation More Than Demand

Work class fleet utilisation sits near 72% and the root cause is that a vehicle without a suitable support vessel cannot work regardless of how much demand exists for it. Commercial impact is that ROV providers carry idle assets during periods when the vessel market is tight and their own order book is full. Mitigation runs through vessel alliances, resident deployments that need no vessel, and smaller systems deployable from vessels of opportunity. Idle vehicles during a tight vessel market is the most frustrating position in this business. The order book looks full.
Market Impact: Observation vehicles grow at 9.8%
3 additional market trends, 4 additional growth drivers, and 2 additional restraints and challenges are covered in the full report. Contact sales@marketmindsadvisory.com to access the complete intelligence.

Segment CAGR and Growth Architecture

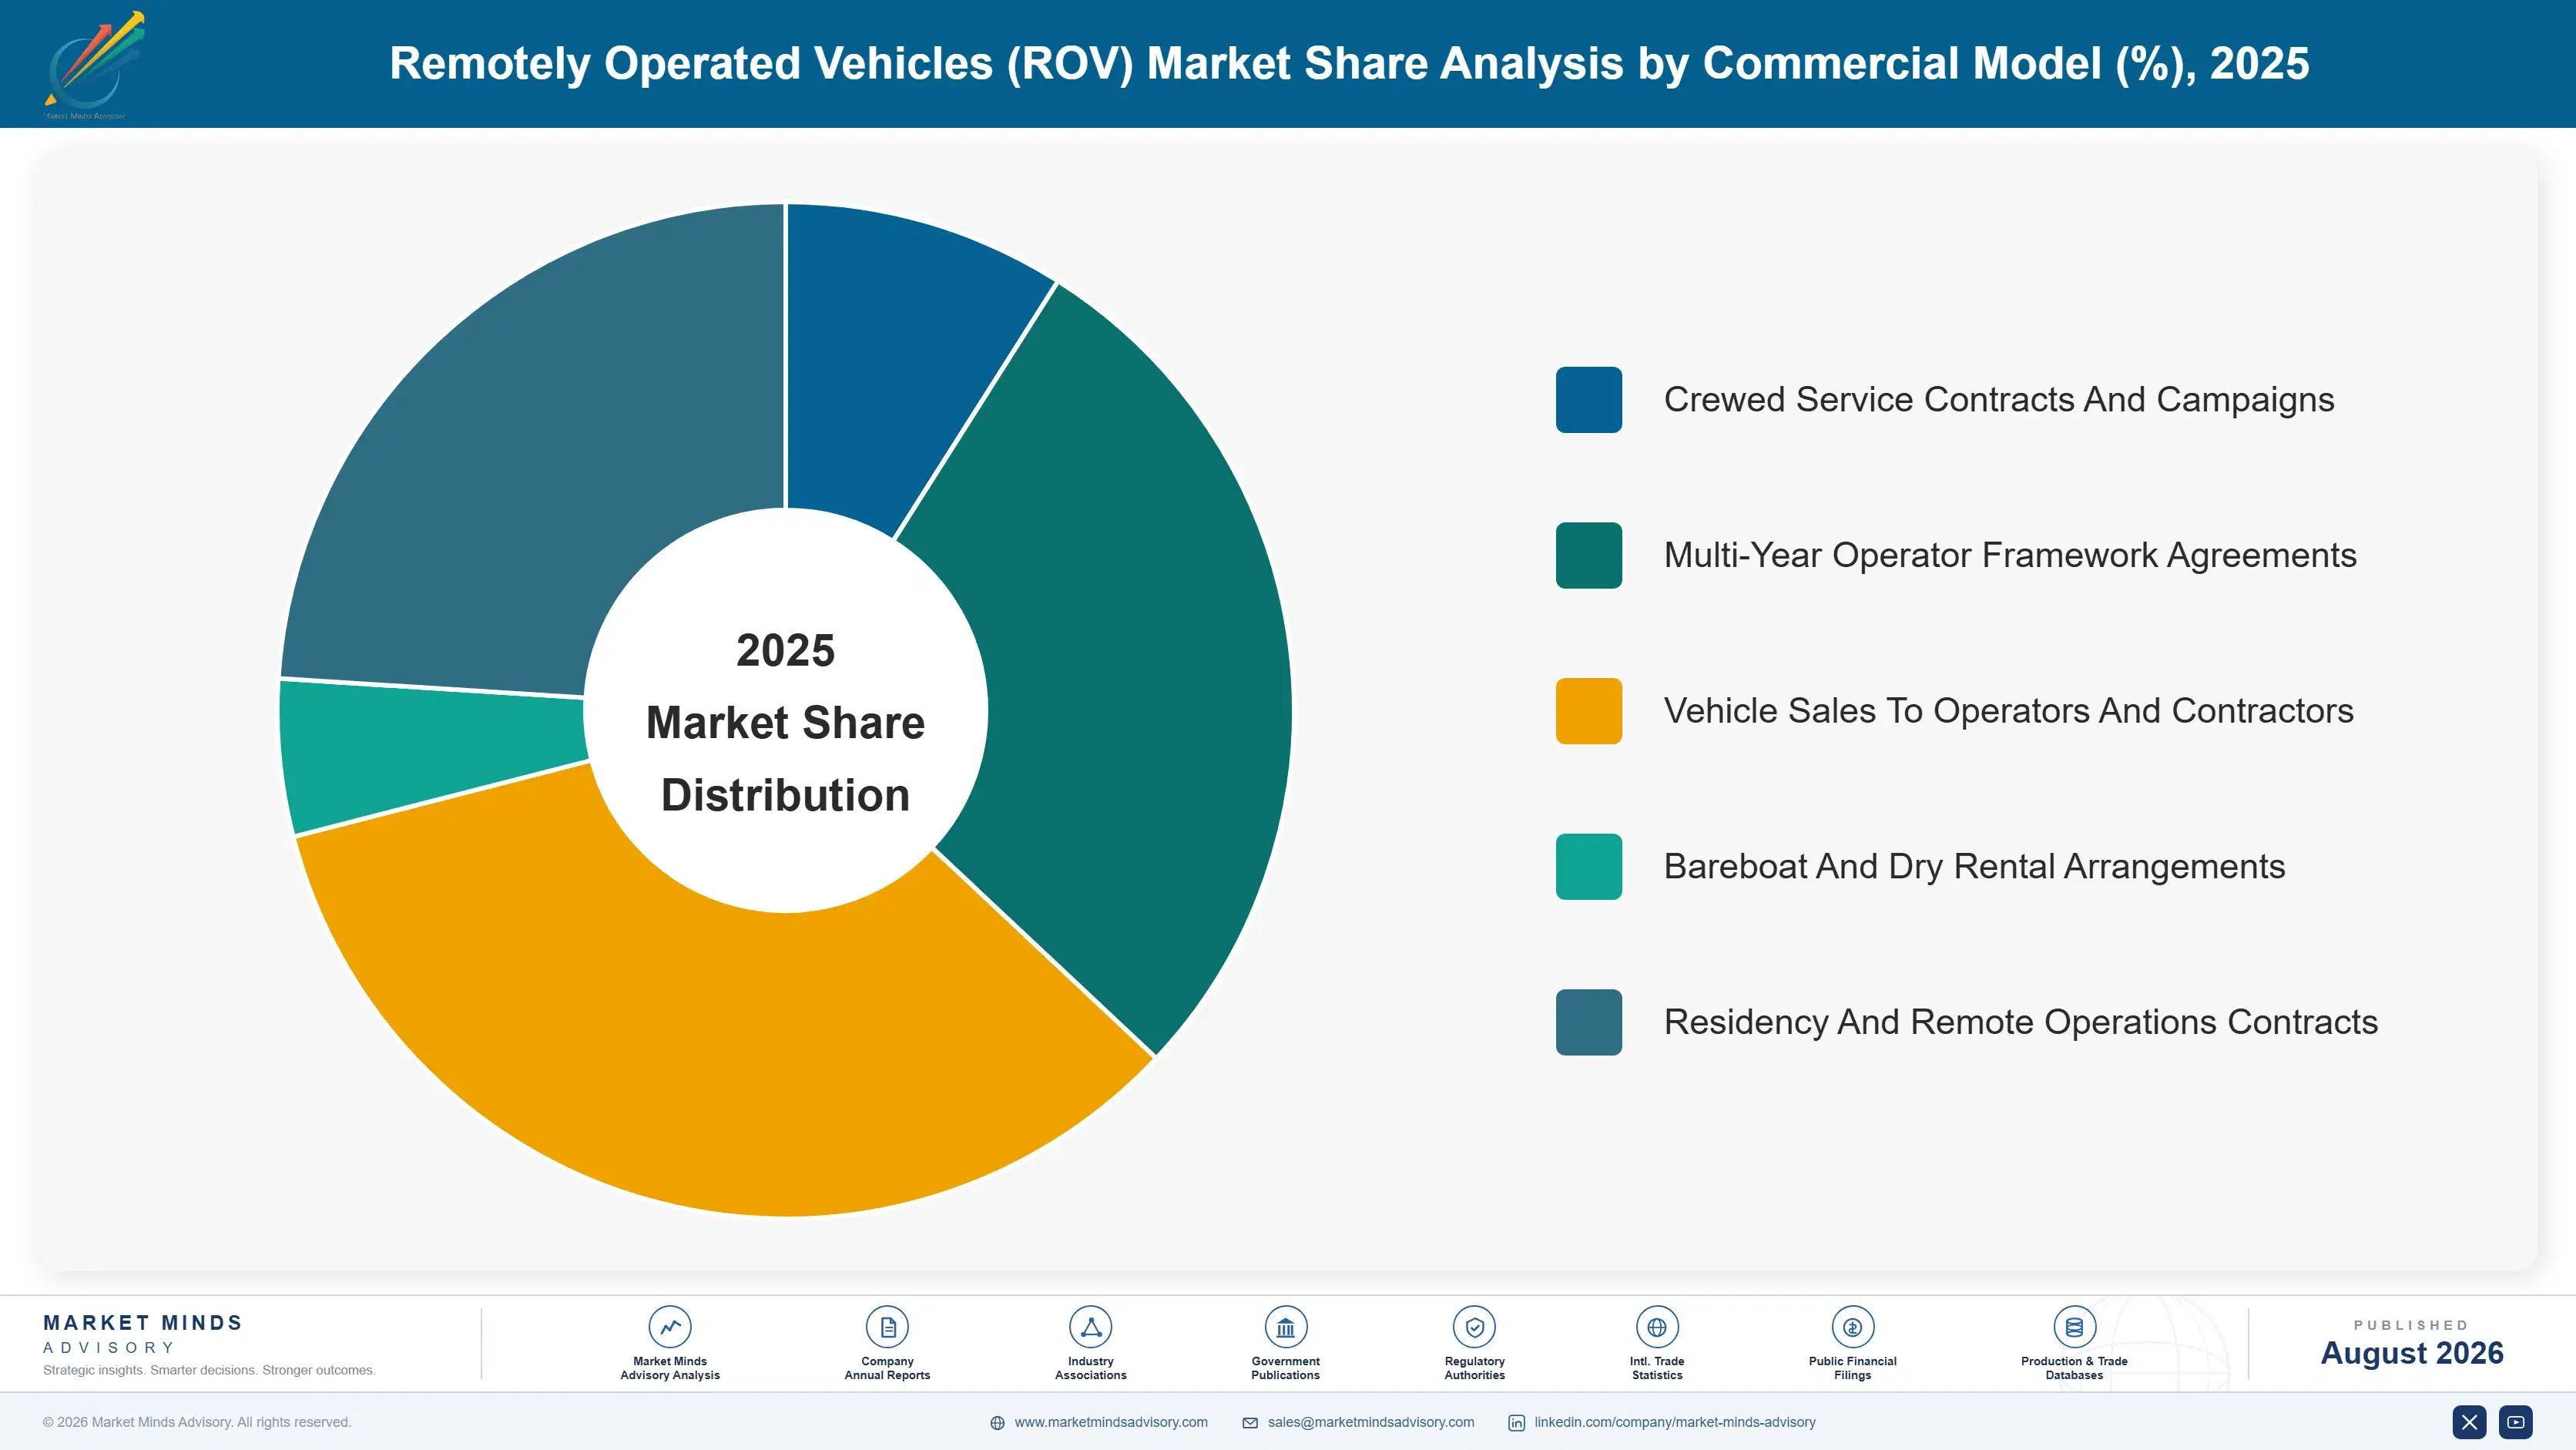
Segmentation follows vehicle class and the deployment model it belongs to, because that determines power, depth rating, tooling capability, vessel requirement, and crewing intensity. Application and water depth both cut across every vehicle class rather than separating them cleanly, which makes either a weaker primary dimension for this market. Vehicle class is what the operator actually contracts for.
remotely-operated-vehicles-rov-market-market-share-analysis-1787302776807

Resident And Remotely Operated Subsea Systems

The fastest class at 12.3%, exactly 1.50 times the market rate, covering vehicles that live subsea in a docking station and are piloted from an onshore control centre rather than a vessel bridge. Only 34 deployments exist, which makes the growth rate less impressive than it sounds and the trajectory more so. The commercial case removes roughly 78% of intervention day cost by removing the vessel, and the barrier is confidence rather than capability: an operator has to accept that a vehicle it cannot reach will keep working for months at a time. Norwegian operators have led adoption by treating residency as an operating cost comparison rather than a technology trial. Others are still running pilots.
CAGR 12.3%

Observation And Inspection Class Vehicles

Second fastest at 9.8%, covering smaller electric vehicles used for visual inspection, survey support, and light intervention across offshore wind, harbour infrastructure, and shallower oil and gas work. Growth follows installed offshore wind capacity, which needs periodic foundation, scour, and cable inspection that scales with the operating fleet rather than with construction. These vehicles deploy from vessels of opportunity rather than dedicated spreads, which changes the cost structure completely and opens the work to smaller operators than work class campaigns ever could. Regional providers compete effectively here in a way they cannot in deepwater work class campaigns, since crewing demands are far lighter. Vehicle capital is modest by comparison. Margins reflect both of those facts.
CAGR 9.8%
Full segment breakdown across 5 segments available in the complete report.

Regional Architecture and Country Demand Map

Latin America leads at 23%, far outside band, because Brazilian pre-salt operates more deepwater subsea infrastructure than any other province. Western Europe and Middle East and Africa follow. Guyana grows fastest. Four regional shares sit outside their framework bands. Water depth and subsea infrastructure geography explain them.

Latin America

Twenty-three percent, far outside the framework band, and justified because Brazilian pre-salt operates more subsea trees and deepwater infrastructure than any other province in the world, all of it beyond any diving envelope. Every intervention there requires a vehicle without exception. Guyana has added the fastest growing deepwater development anywhere since first oil, and Petrobras contracts ROV spreads on multi-year terms rather than campaign by campaign. Growth at 9.0% runs above the market rate on installed base expanding faster than anywhere else. Regional operators have built crewing depth and vehicle capability that has begun taking deepwater scope international providers held for years. Local capability closed that gap quickly. Multi-year framework terms are normal here.
Share: 23% | CAGR: 9.0% (2026 to 2036)

Western Europe

Twenty-one percent, below the framework band, and the North Sea combines mature oil and gas integrity work with the largest operating offshore wind fleet, which gives the region an unusually balanced demand base. Decommissioning adds further vehicle days as ageing infrastructure is surveyed and removed. Norwegian operators have deployed more resident systems than anyone, treating them as an operating cost decision rather than a technology trial. Growth at 6.8% is the slowest of any region, reflecting a mature basin rather than any technology lag. Aberdeen and Stavanger remain the deepest concentration of ROV engineering and pilot training anywhere, which supplies crews to operations worldwide rather than only regionally. That export of people matters commercially.
Share: 21% | CAGR: 6.8% (2026 to 2036)
Regional intelligence for 5 additional markets available in the complete report: Middle East and Africa, North America, South Asia and Pacific, East Asia, Eastern Europe. Contact sales@marketmindsadvisory.com.
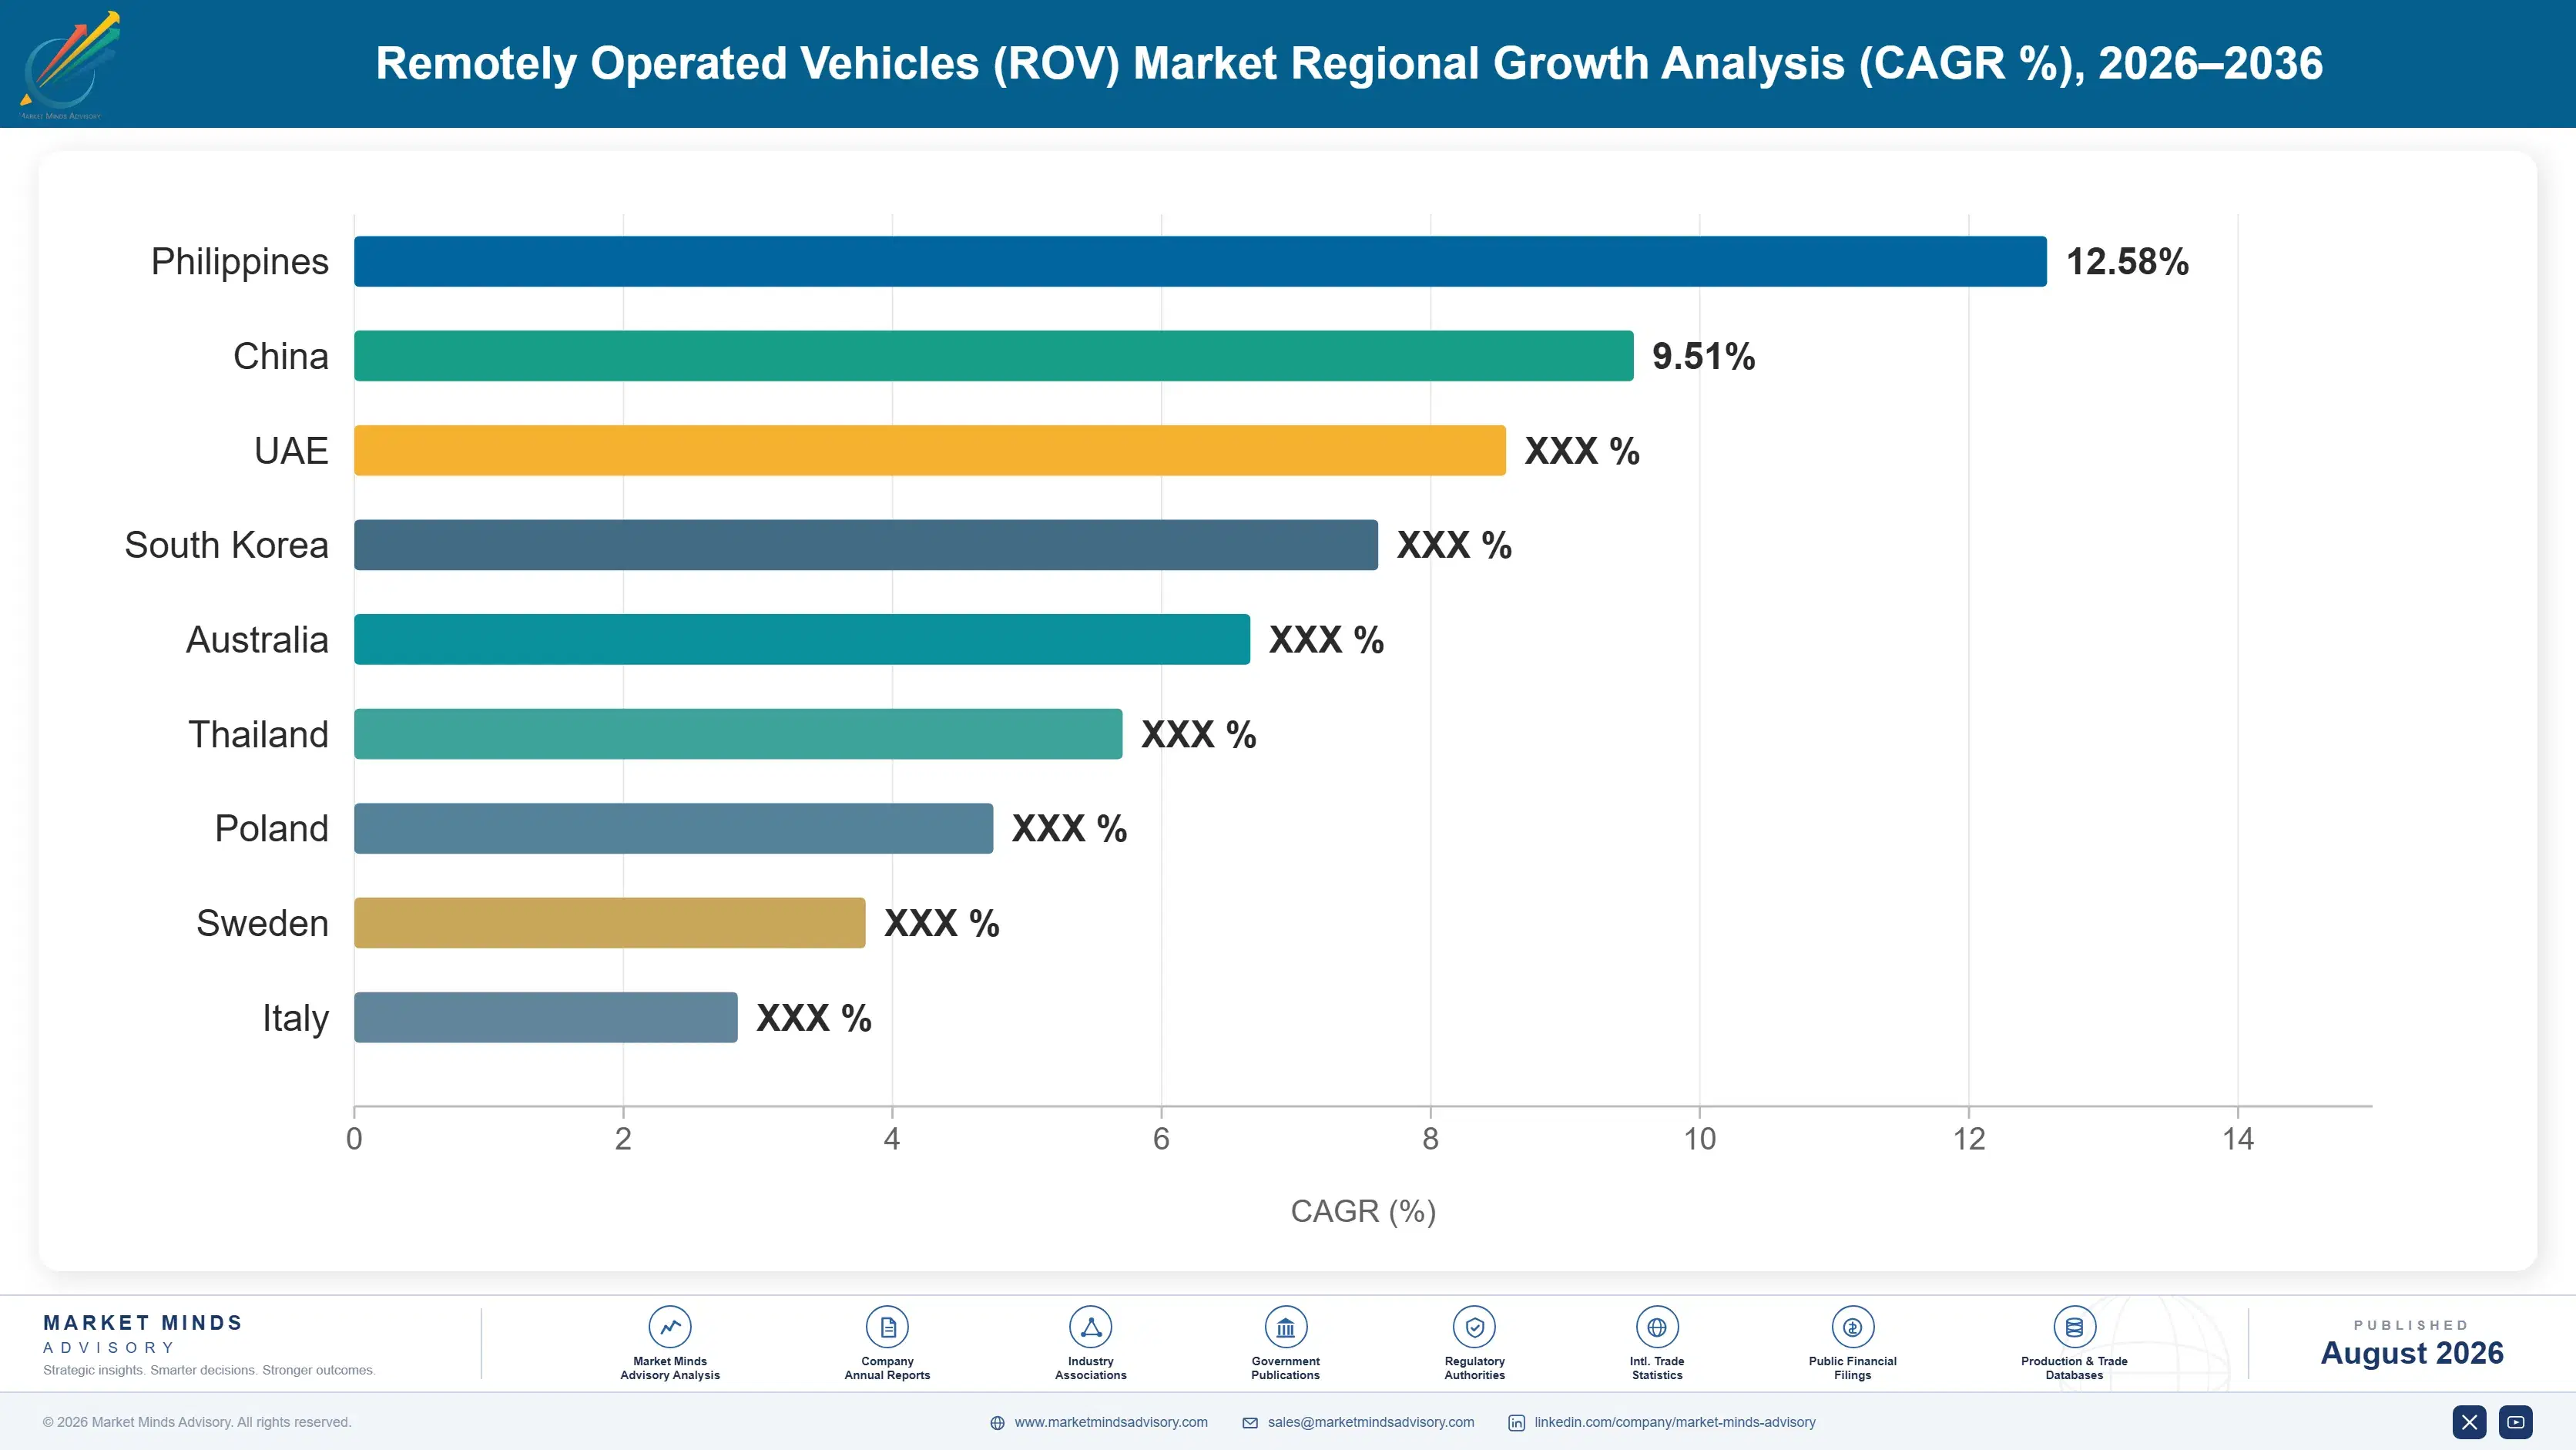
remotely-operated-vehicles-rov-market-country-cagr-analysis-1787302777329

Sell The Vessel Days You Remove

Vessels carry 78% of intervention day cost, roughly 1,150 work class systems operate at 72% utilisation, each needs six offshore crew, and resident systems grow at 12.3%. Value comes from removing vessel time, from crewing depth, and from residency capability built early. Vehicle capability decides remarkably little of it. Vessel arithmetic decides most of it.

Price Against Vessel Days Removed Rather Than Day Rates

A support vessel carries roughly 78% of intervention day cost, so a vehicle and crew that complete a campaign two days faster save the operator far more than any day rate discount could. Providers competing on vehicle pricing are negotiating over the smaller fifth of the bill. Those quantifying vessel time saved are addressing the number the operator's own economics actually turn on, and they rarely have to discount at all. An operator comparing two providers is comparing vessel days consumed, whether or not the tender document says so. Very few bids are written that way.
Market Impact: Vessels carry 78% of the total day

Build Residency Capability Before Operators Ask For It

Resident systems grow at 12.3% against 8.2% for the market from only 34 deployments, and the barrier to adoption is operator confidence rather than technology. Providers with deployed hours and demonstrated reliability will be the ones operators trust when the conversion accelerates. Building that record takes years of subsea time that cannot be acquired later, and the providers waiting for demand signals will find the reference cases already belong elsewhere. Norwegian operators are already treating residency as an operating cost decision rather than a technology trial. Reference cases are being allocated now.
Market Impact: Only 34 resident systems are deploy

Treat Crewing Pipeline As A Capacity Investment

Each work class system running continuously needs six offshore personnel, and pilot technicians take years of supervised offshore hours to develop. Fleet growth is therefore limited by people rather than by vehicles or capital, and providers that stopped training through the last downturn found themselves unable to bid work in the recovery. Cadet programmes are slow, unglamorous, and the only mechanism that adds real operating capacity to this business. Six offshore personnel per system means a fleet of 20 systems requires roughly 120 trained people in rotation. Nobody recruits that number quickly.
Market Impact: Each single system requires 6 offsh

Deploy Smaller Systems From Vessels Of Opportunity

Work class fleet utilisation sits near 72% because vehicles cannot work without suitable support vessels, and dedicated spreads are expensive to mobilise for short scopes. Observation and light work class systems deployable from vessels of opportunity reach work that a full spread cannot justify, and they grow at 9.8%. That flexibility also opens offshore wind inspection, where operators will not charter a dedicated construction vessel for a survey campaign. Mobilising a full spread for a short scope rarely pays, and operators simply defer the work instead. Smaller systems reach scopes that never get tendered otherwise.
Market Impact: Work class fleet utilisation sits a

Who Controls the Margin Pool

Concentration is moderate at 47% across the top five measured on systems under operational management, and offshore crewing depth holds it more reliably than any vehicle technology does. A competitor can buy vehicles within months and cannot staff them within years, since pilot technicians develop through supervised offshore hours that nothing compresses. The leader to challenger gap is widest in deepwater work class operations and considerably narrower in observation class inspection work.
Competitive activity runs on three fronts. Crewing depth is the first and the least visible from outside, since it determines how much fleet a provider can actually operate rather than own. Residency capability is the second, where deployed hours build the operator confidence that will decide the next decade. And vessel relationships are the third, because a vehicle without a deck is an idle asset whatever its capability.

Pressure arrives from two directions. Regional providers in Brazil, China, and Southeast Asia have built credible operating capability and hold local work that international providers once served. And operators are contracting residency directly with manufacturers in some cases. Rankings shift on crewing and residency positions rather than on fleet size.
remotely-operated-vehicles-rov-market-company-positioning-matrix-1787302777853

Competitive Moat and Risk Dimensions

OCEANEERING INTERNATIONAL

Moat: Fleet scale and crewing depth

The largest operating fleet combined with a trained pilot technician base built over decades gives operating capacity that competitors cannot assemble at any speed, since crewing rather than capital limits fleet growth. Deployment history across every major deepwater province adds campaign knowledge that shortens mobilisation. Both advantages compound with operating hours rather than with investment.
OCEANEERING INTERNATIONAL

Risk: Residency reduces future vessel scope

Resident systems remove the vessel and much of the offshore crew that a conventional spread requires, which compresses exactly the revenue base a large fleet operator has built. Growth at 12.3% is happening inside a model that pays the incumbent less per intervention. Leading the transition and defending the existing business pull in opposite directions.
FUGRO

Moat: Remote operations centre infrastructure

Onshore control centres already running vehicles remotely give a genuine head start on residency, since the hardest part of removing the vessel is proving that shore-based operation works reliably at scale. Offshore wind inspection depth adds demand that does not move with oil prices. Both positions were built ahead of the market asking for them.
FUGRO

Risk: Lighter position in deepwater intervention

Work class intervention in deepwater provinces is where the largest and least price sensitive scopes sit, and a survey-weighted position participates less in that work. Deepwater intervention also requires tooling depth and heavy vehicle fleets that survey operations do not build. Growth in Brazil and West Africa favours providers already established in those campaigns.

Players Tracked

Prominent Players

Oceaneering International
Fugro
Subsea7
DOF Group
TechnipFMC

Other Key Players

Saipem
Saab Seaeye
Forum Energy Technologies
Soil Machine Dynamics
Kystdesign
Deep Trekker
Blueye Robotics
VideoRay
Teledyne Marine
IKM Subsea
Reach Subsea
Helix Energy Solutions
Ashtead Technology
ROVOP
Modus Subsea Services

Recent Developments

JANUARY 2025

Operator converts inspection campaign to resident system

A North Sea operator replaced a scheduled vessel-based inspection campaign with a permanently deployed subsea vehicle controlled from an onshore centre, removing the support vessel from the scope entirely. The decision was an operating cost comparison rather than any technology trial, partnership, or joint development arrangement.
Signal: Residency is now being justified purely on
APRIL 2025

Provider commits to multi-year pilot technician cadet programme

An ROV service provider committed to a structured multi-year cadet intake after being unable to crew vehicles it already owned during a demand peak, having recruited from competitors without materially increasing capacity. The commitment was internal capability building rather than any acquisition or partnership arrangement.
Signal: Crewing rather than any available capital
AUGUST 2025

Wind operator contracts inspection from vessels of opportunity

An offshore wind operator contracted foundation and cable inspection using observation class vehicles deployed from vessels of opportunity rather than chartering a dedicated construction spread for the campaign. The arrangement was a procurement structure decision rather than any technology change or new supplier relationship. Dedicated spread mobilisation was
Signal: Wind operators will not charter any dedica

Crew, Mobilisation and Spares

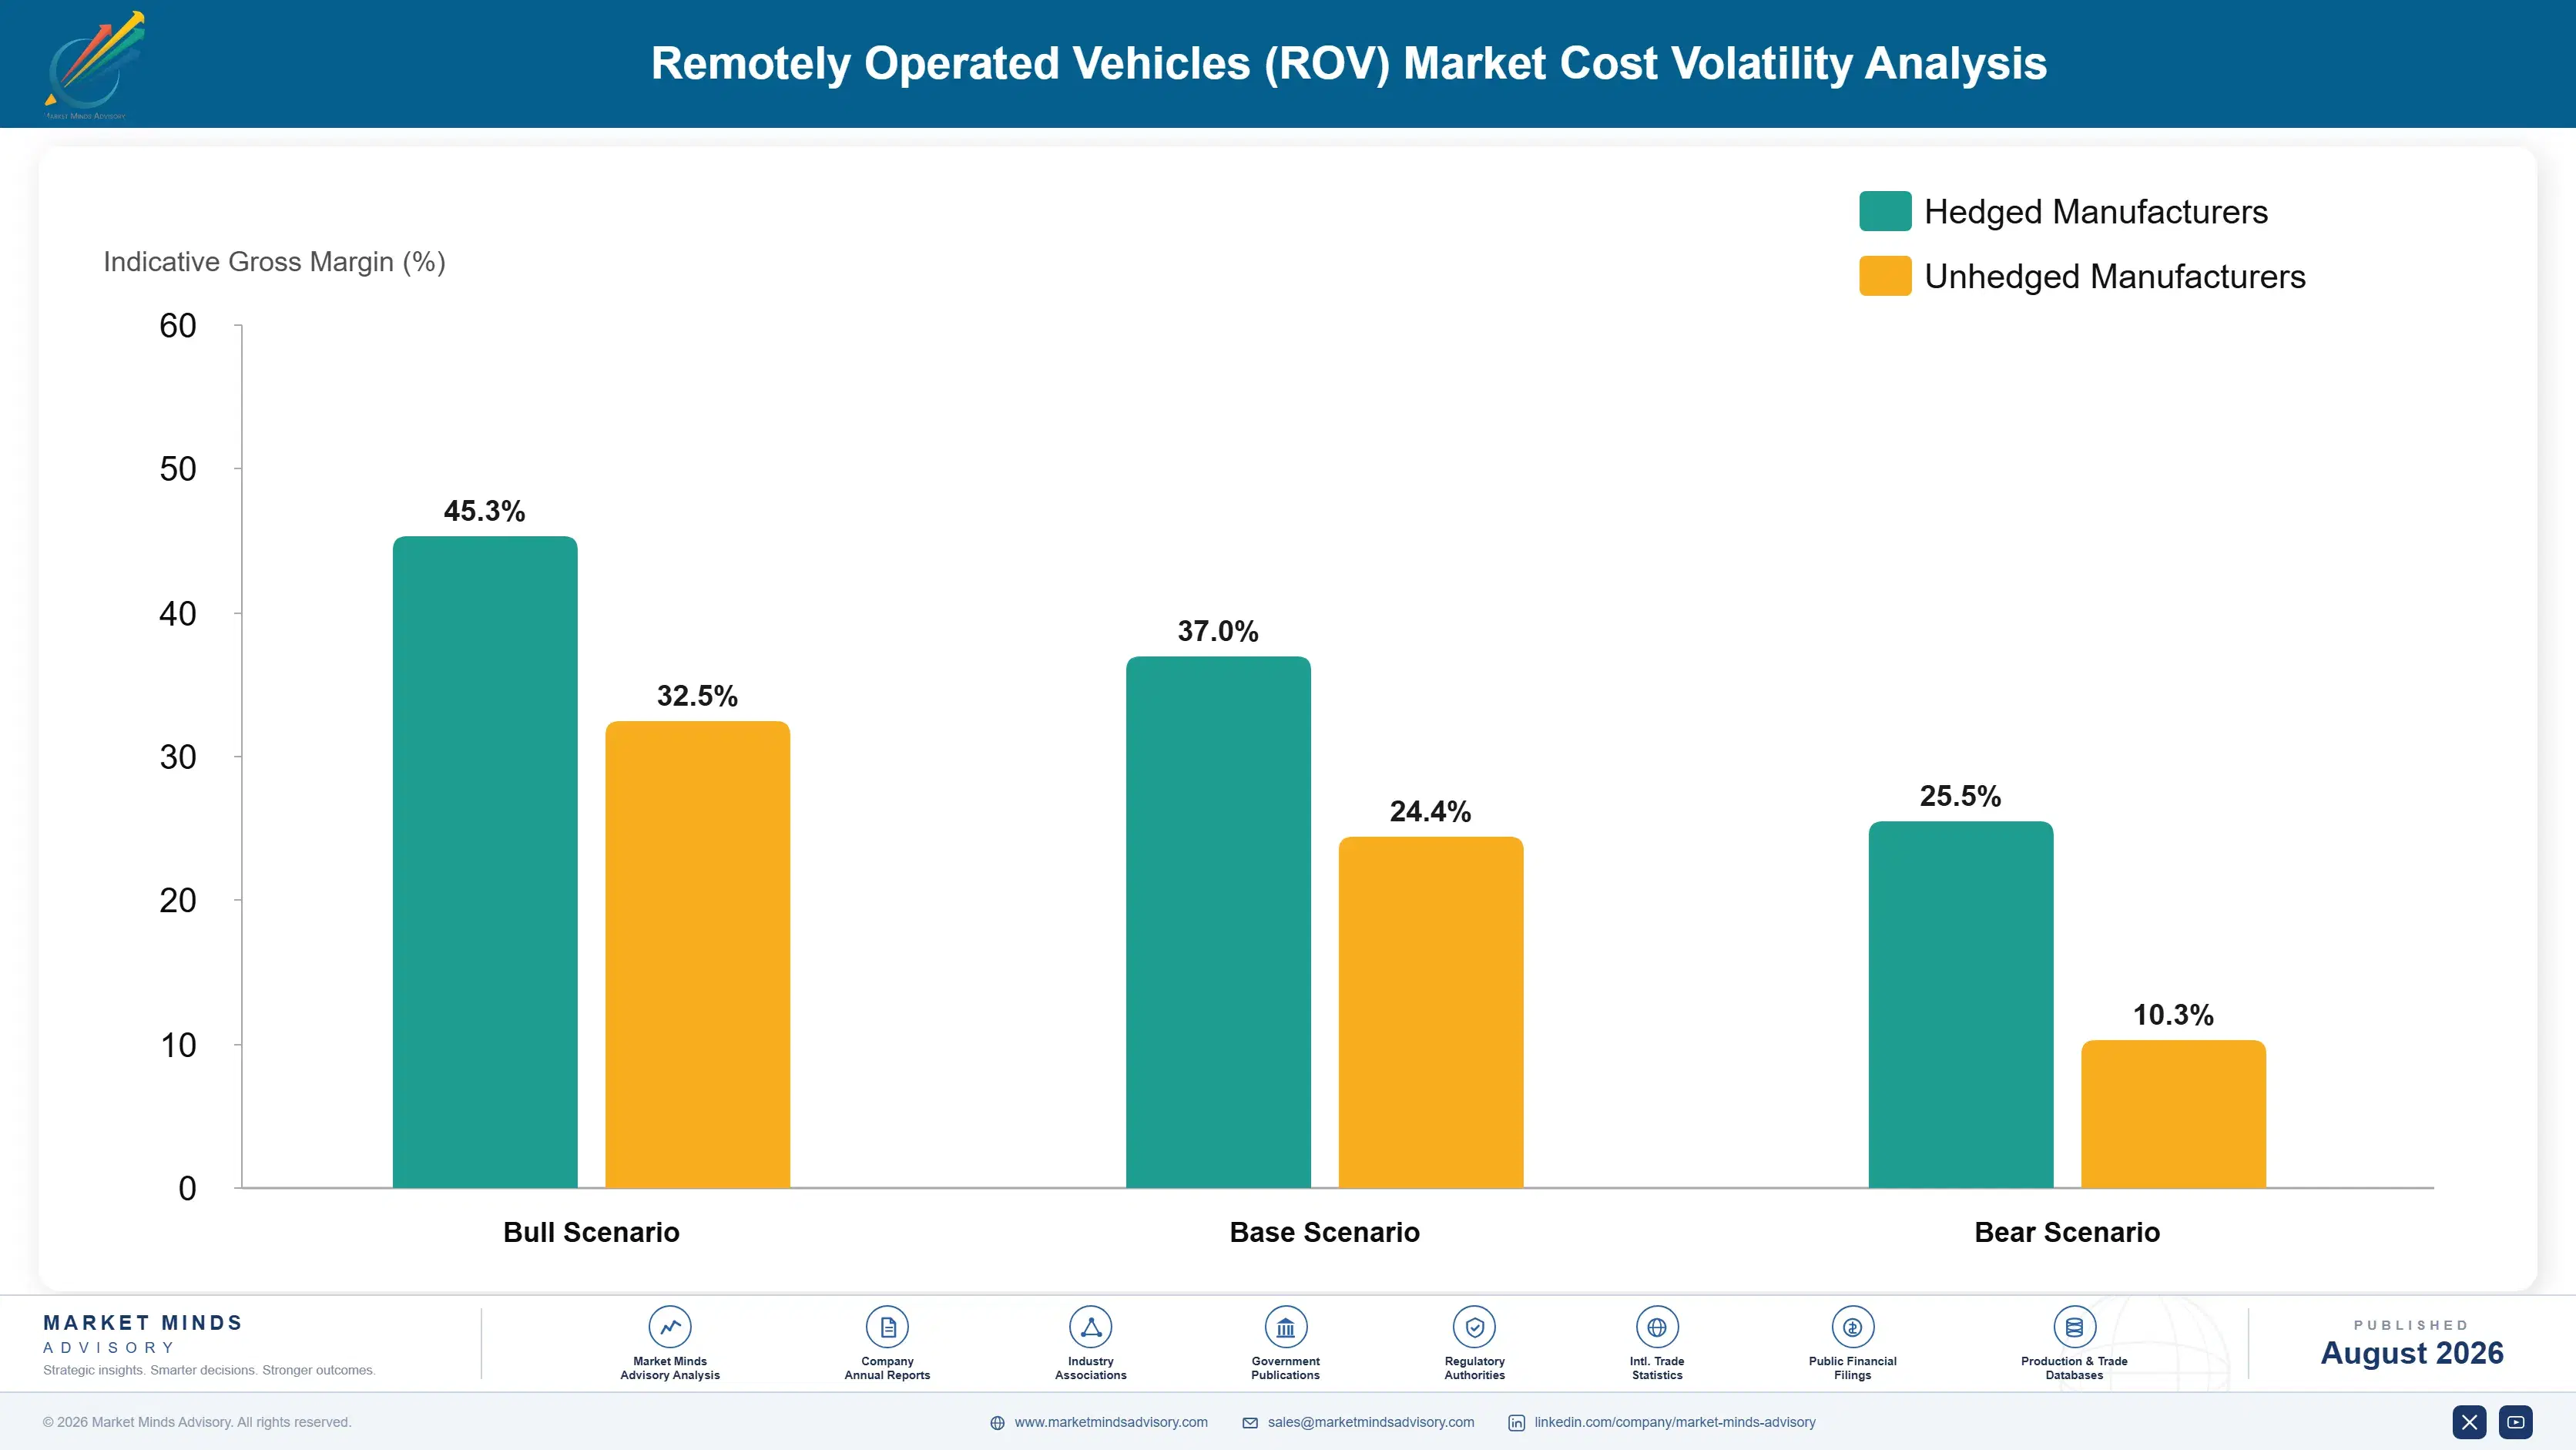
Provider cost divides between offshore crew wages and rotation at roughly 38%, vehicle maintenance, spares, and umbilical replacement near 21%, mobilisation and demobilisation around 16%, onshore engineering and technical support about 13%, and insurance, certification, and overhead the balance. Crew dominates because continuous operation needs six people per system, and rotation costs include travel to locations that are rarely convenient.
Offshore technical wages rose sharply through 2022 and 2023 as activity recovered faster than the crewing base did, and several listed subsea service groups disclosed personnel cost inflation and recruitment difficulty in filings covering those years. Umbilical and spares lead times extended over the same period. Neither could be recovered quickly, since multi-year frameworks with operators typically fix day rates with limited escalation provision. Frameworks fix day rates with limited escalation provision.

The competitive disadvantage mechanism runs through crewing rather than through equipment cost. Vehicles and spares cost broadly the same for every provider, while a provider without a trained pilot base must either recruit at premium rates or decline work it has vehicles for. Providers that maintained cadet programmes through the last downturn hold an operating cost advantage that competitors cannot close inside several years.
remotely-operated-vehicles-rov-market-cost-volatility-analysis-1787302778047

Move eligible roles ashore into remote operations centres

Offshore crew carries roughly 38% of provider cost including rotation and travel to inconvenient locations. Onshore control centres let supervision, data analysis, and some piloting move ashore, which cuts offshore headcount per system and widens the recruitment pool considerably. The connectivity and procedural work required is substantial, and it also builds directly toward residency capability.

Maintain cadet intake through downturns rather than pausing it

Pilot technicians need years of supervised offshore hours, so a training pause creates a capability gap that appears exactly when the next recovery arrives. Providers that stopped through the last downturn could not bid work they had vehicles for. Cadet intake is a small cost carried through a cycle and the only mechanism that adds genuine operating capacity

Standardise vehicle fleets to compress spares holdings

Maintenance, spares, and umbilical replacement carry around 21% of provider cost, and a mixed fleet multiplies the spares inventory, the training burden, and the technical support required to keep it running. Standardising on fewer vehicle types reduces all three at once. The constraint is that acquired fleets rarely match, and rationalising them takes longer than any acquisition case assumes.

Portfolio Architecture for Margin Defence

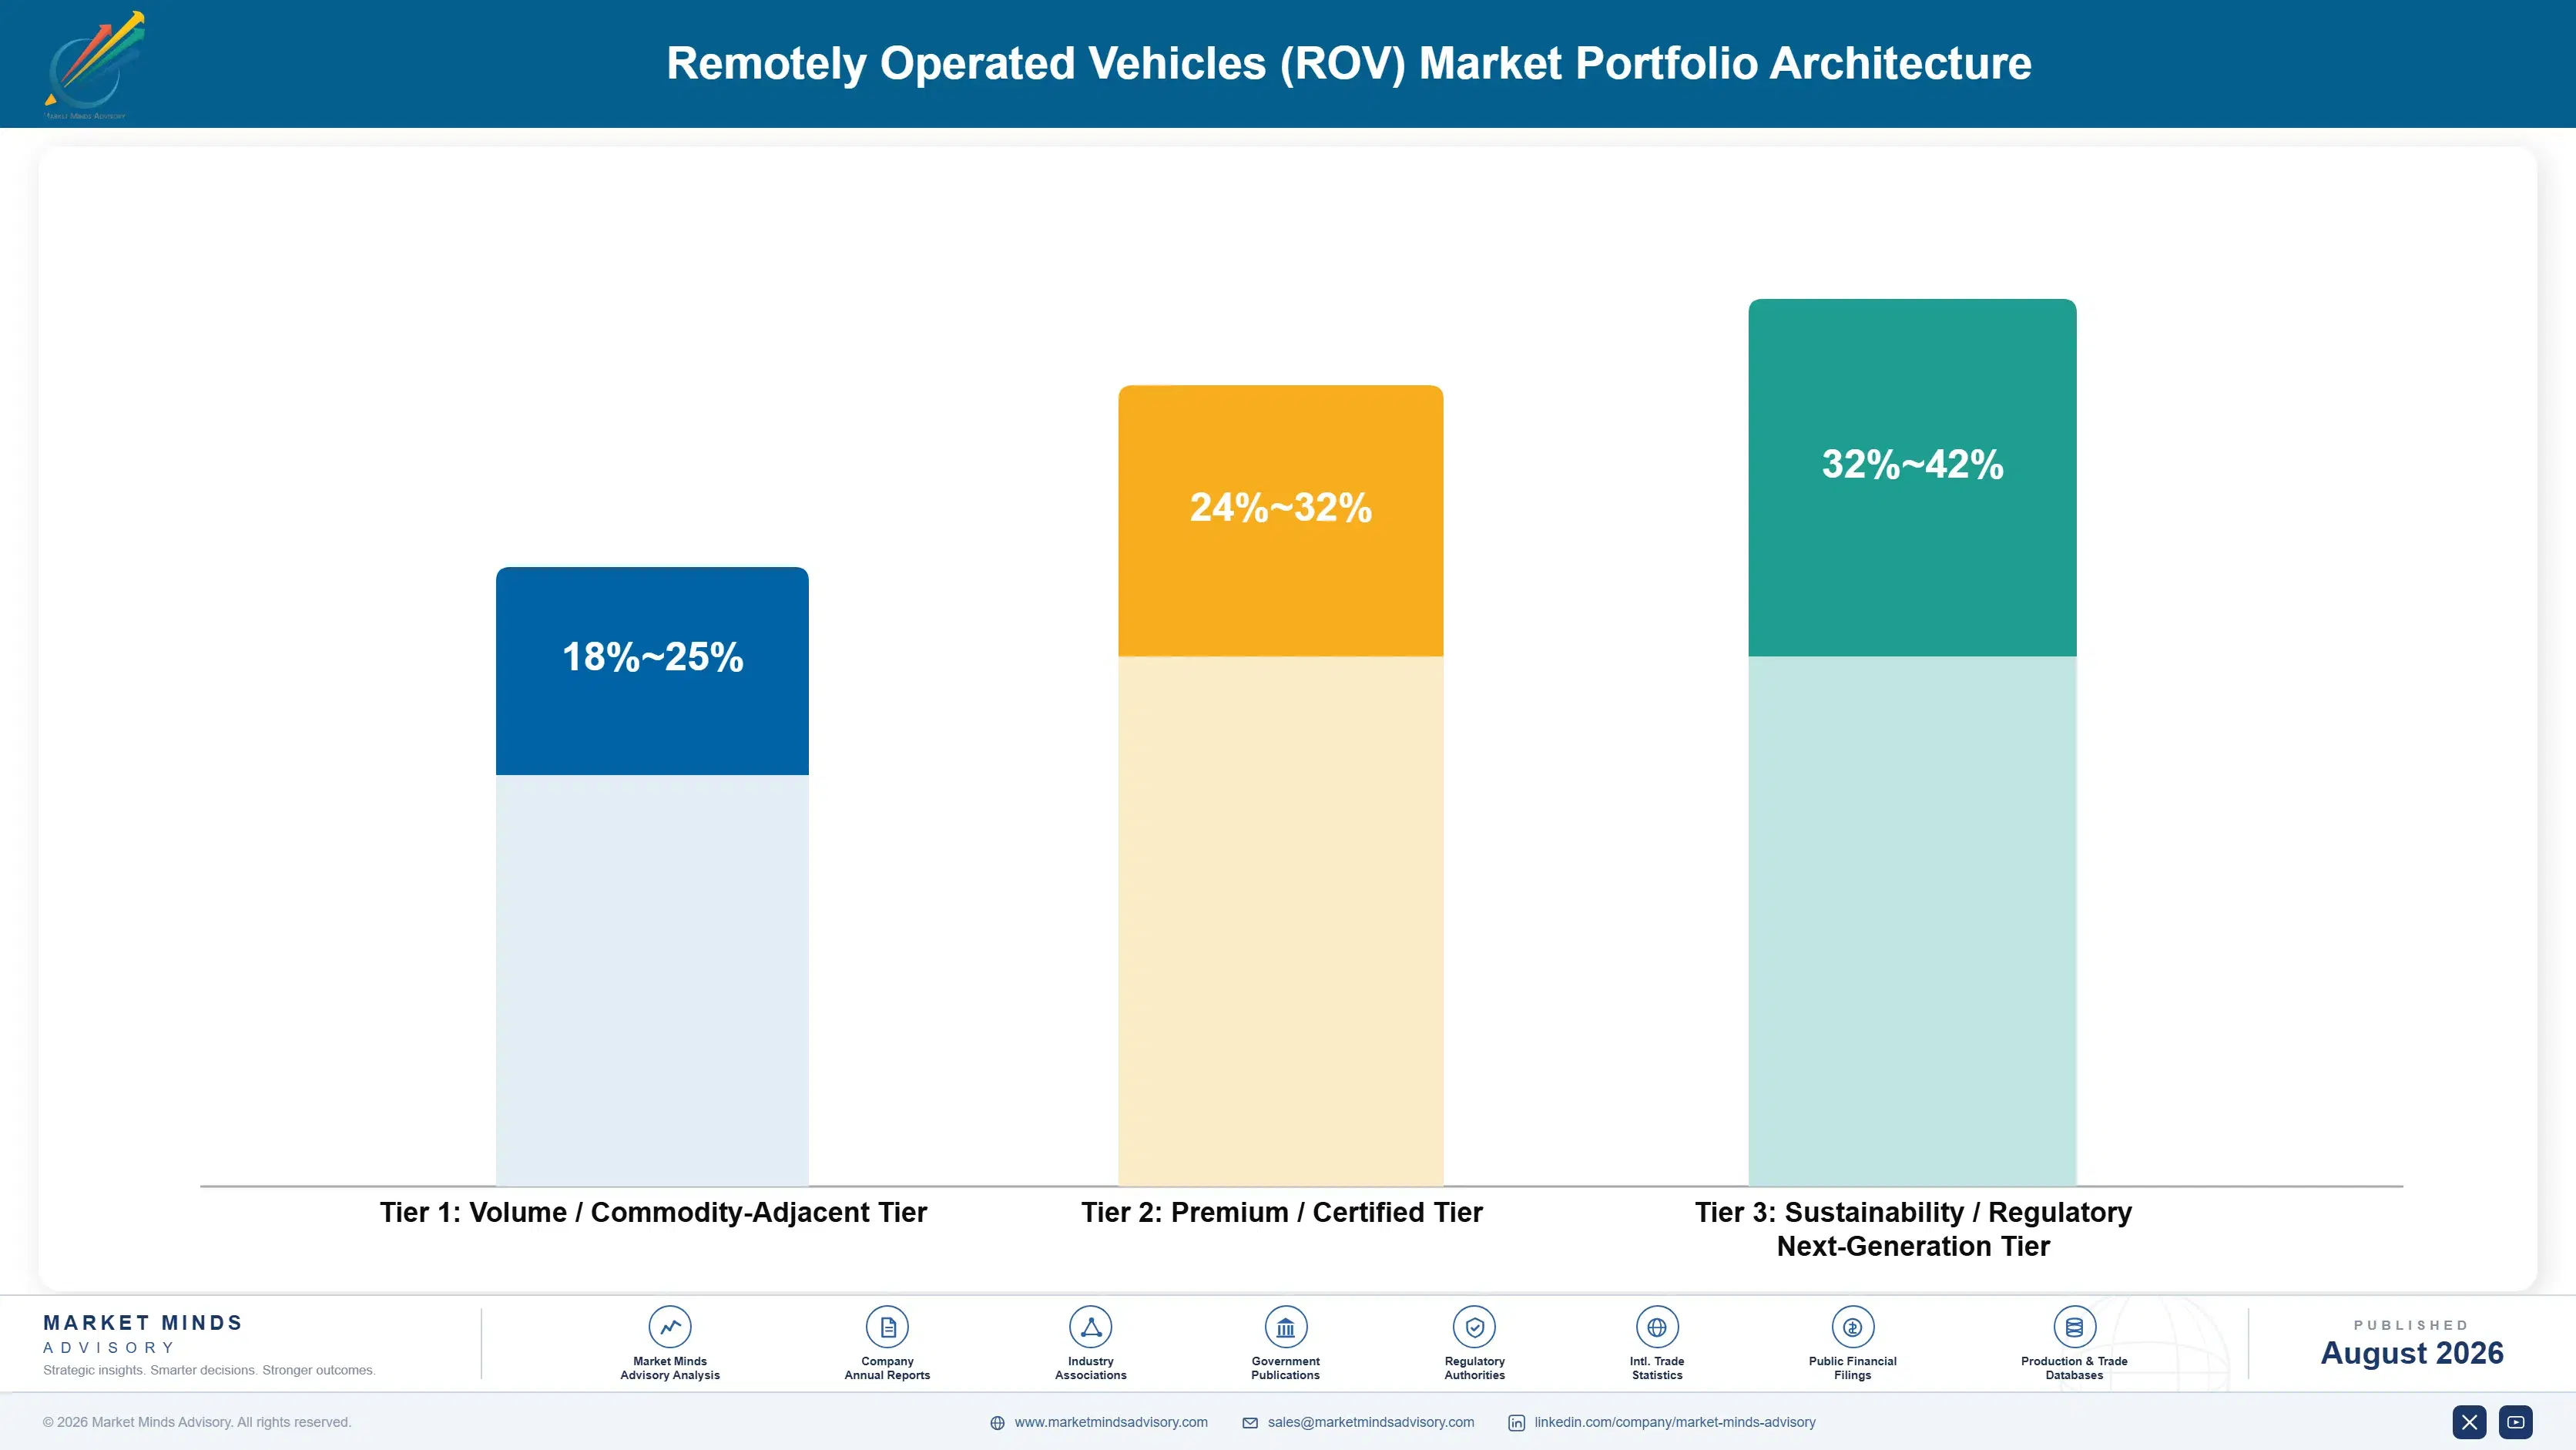
Three tiers describe this business and the spread follows how much vessel time the work consumes rather than vehicle size. Observation class inspection sits at the bottom, where vehicles are cheap, crews are small, and regional providers compete effectively on cost. Work class campaign services occupy the middle. Resident systems and complex deepwater intervention sit at the top, where the value delivered is measured in vessel days removed.
The tension is that work class campaign services carry the revenue base and the vessel dependency together, so utilisation at 72% reflects a constraint the provider does not control. A provider weighted there carries idle assets whenever the vessel market tightens. One weighted toward residency is building a business that reduces the size of its own conventional revenue base, which is uncomfortable and unavoidable.

High-value pools concentrate where the client's alternative is expensive. Deepwater intervention is the clearest case, since beyond diver depth there is no alternative at all, and an operator facing a shut-in well will pay whatever the intervention costs rather than accept the deferred production. Residency is the second such pool, where the value delivered is measured in vessel charters that never happen at all.

Volume / Commodity-Adjacent Tier

Observation and inspection class work deployed from vessels of opportunity for wind, harbour, and shallow water scopes. Vehicles are inexpensive, crews are small, and regional providers compete effectively on delivered cost.
Gross Margin: 18-25%

Premium / Certified Tier

Work class campaign services with dedicated spreads for construction support, intervention, and integrity work. Carries the revenue base and the vessel dependency together, which utilisation figures reflect directly. Utilisation reflects a constraint nobody controls.
Gross Margin: 24-32%

Sustainability / Regulatory / Next-Generation Tier

Resident systems and complex deepwater intervention where value is measured in vessel days removed and production restored. Best margin available and the least price sensitivity anywhere in this market. Beyond diver depth no alternative exists.
Gross Margin: 32-42%
remotely-operated-vehicles-rov-market-portfolio-architecture-1787302778546

Campaigns, Frameworks and Residency

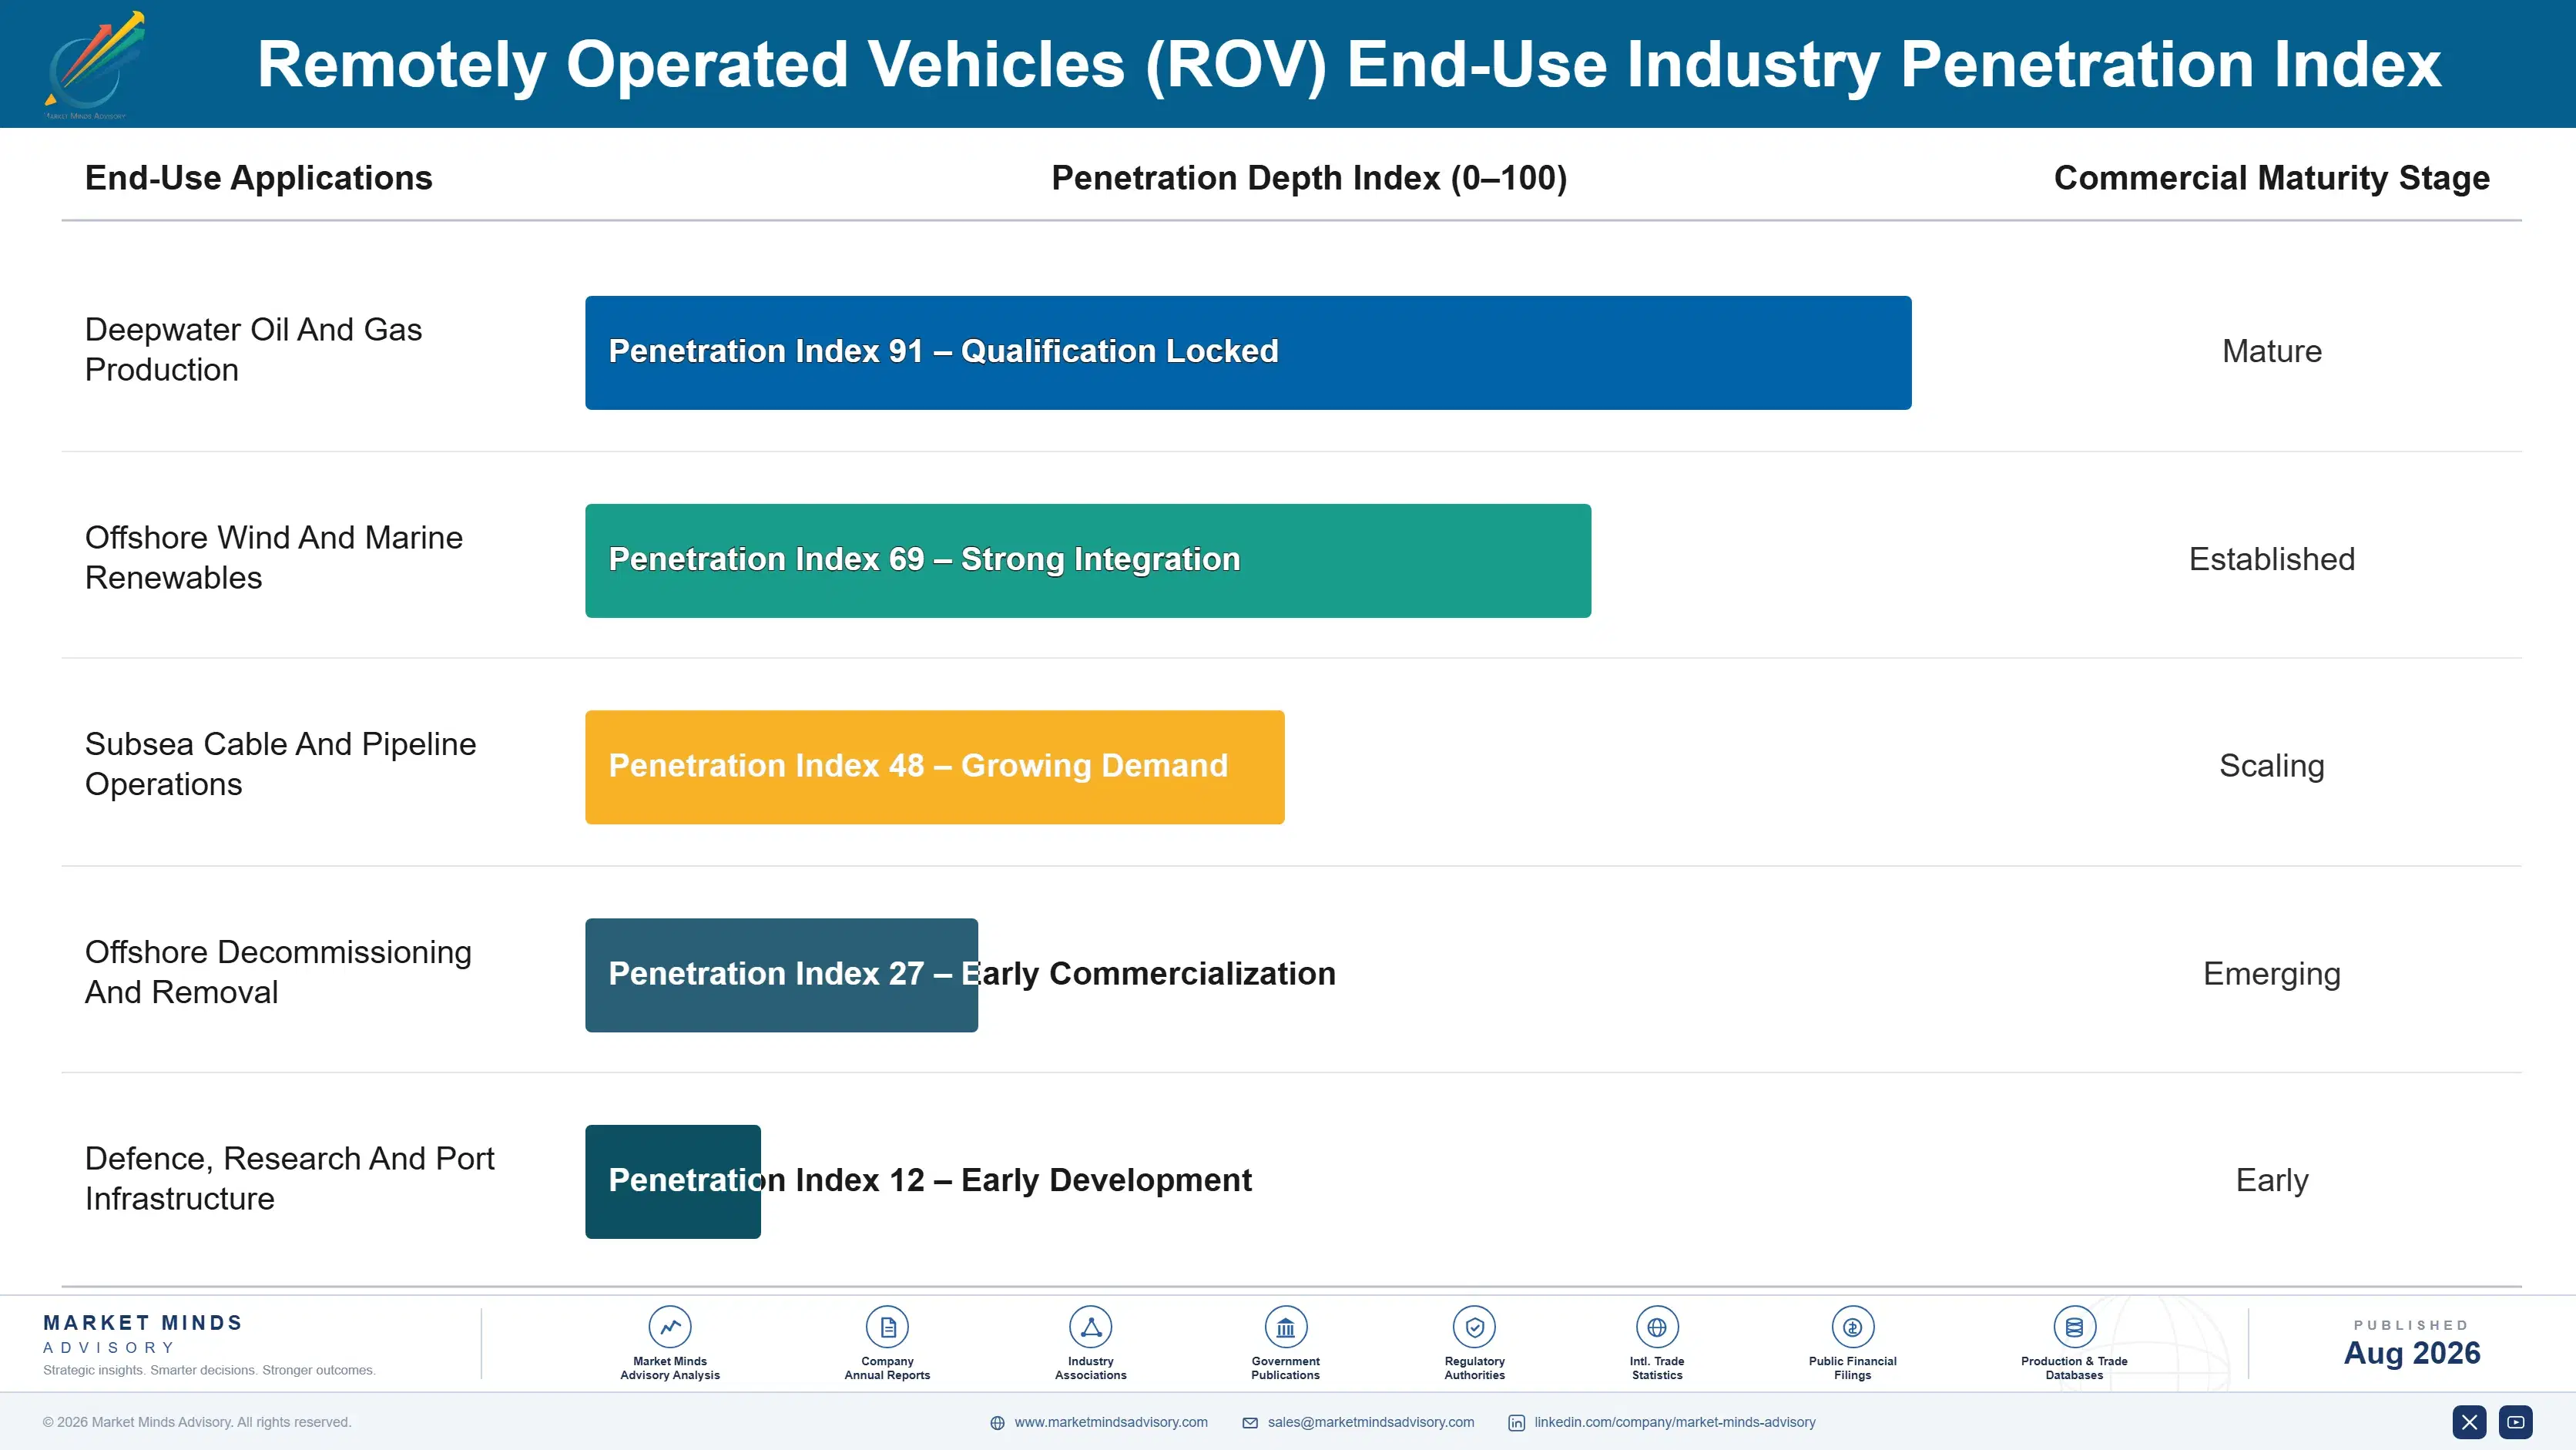
Revenue arrives as campaigns rather than as a smooth annuity, though the mix has shifted considerably as integrity work grew relative to construction support. Inspection and intervention on installed infrastructure recurs on maintenance schedules regardless of oil price, which gives providers a base load that construction work never did. Framework agreements with large operators increasingly cover multiple years and several vessels at once.
Stickiness varies sharply by scope and by operator. Deepwater intervention frameworks are the firmest, because operators qualify providers on campaign records and safety performance that a challenger cannot present. Offshore wind inspection is looser and does move on price, since the work is more standardised. Residency contracts are the firmest of all, though there are too few of them yet for that to matter commercially.

Buyer profiles shifted as residency and wind inspection grew. The earlier buyer was an offshore construction manager chartering a spread for a defined campaign. The current conversation increasingly involves an asset integrity manager comparing annual intervention cost against a resident system, or a wind operations manager who has never chartered a construction vessel and does not intend to start.
remotely-operated-vehicles-rov-market-end-use-penetration-index-1787302779036

What We Would Tell a Board

These are among the four positions where our research anticipates prominent divergence between winners and laggards over the coming forecast period. Each is grounded in the demand model, the regulatory perimeter, and the announced capacity pipeline.
01 / VESSEL TIME PRICING

Sell vessel days removed, not vehicle day rates

A support vessel carries roughly 78% of what a subsea intervention day costs, so a crew and vehicle finishing a campaign two days early saves the operator far more than any day rate concession ever could. Providers competing hard on vehicle pricing are negotiating over the smaller fifth of the total bill while the operator worries about the rest. Quantifying vessel time saved addresses the number the operator's own economics genuinely turn on, and providers who do it rarely find themselves discounting the vehicle at all.
02 / RESIDENCY RECORD BUILDING

Deployed hours now decide the next decade

Resident systems grow at 12.3% against 8.2% for the wider market from a base of only 34 deployments, and the barrier to adoption is operator confidence rather than any technical capability gap. Providers with demonstrated subsea hours will be the ones trusted when conversion accelerates, and that record takes years of deployment nobody can acquire retrospectively. Waiting for a clear demand signal simply means the reference cases will already belong to somebody else by the time the conversion actually arrives.
03 / CREWING PIPELINE INVESTMENT

People, not vehicles, cap your fleet growth

Every work class system running continuously needs six offshore personnel, and pilot technicians develop through years of supervised offshore hours that no simulator or recruitment budget compresses meaningfully. Providers that paused cadet intake through the last downturn could not bid work they already owned the vehicles for when the recovery finally arrived, and several never fully closed that gap. Cadet programmes are slow, unglamorous, and expensive to carry through a downturn, and they remain the only mechanism that adds genuine operating capacity to this business.
04 / VESSEL DEPENDENCY REDUCTION

Utilisation is a vessel problem, not a demand problem

Work class fleet utilisation sits near 72% because a vehicle without a suitable support vessel cannot work regardless of how strong the order book looks on paper. Providers carry idle assets during exactly those periods when the vessel market is tightest and demand for their own services is at its highest, which is the most frustrating position in this business. Smaller systems deployable from vessels of opportunity, alliances with vessel owners, and resident deployments each attack that dependency from a different direction entirely.

Engagement Snapshot From the Field

A live engagement with an industry participant carrying material or product regulatory and market exposure ahead of a defining policy shift, showing how our research translates into a defensible multi-year portfolio strategy.
MARKET MINDS ADVISORY · CLIENT ENGAGEMENT SUMMARY
Remotely Operated Vehicles (ROV) Producer Strategic Portfolio Review and Transition Roadmap 2026·Investment Scenario on Remotely Operated Vehicles (ROV) Exposure Evaluation 2025-26
CLIENT PROFILE
An independent ROV service provider with approximately 190 million dollars in annual revenue (client-reported, unverified by MMA), operating twenty-two work class and observation class systems across three offshore regions. Utilisation had run below the market average for two years, no residency capability existed, and cadet training had been suspended during the previous downturn and never restarted.
STRATEGIC CHALLENGE
The board had approved capital for six additional work class vehicles to address what it read as a capacity shortfall, and wanted validation before committing, since utilisation on the existing fleet did not obviously support the case for more. Nobody had decomposed the utilisation losses into their actual causes. Capacity had simply been assumed.
MMA APPROACH
We decomposed utilisation losses by cause across two years of operating records, separating vessel unavailability from crewing shortfalls and from genuine demand gaps. Crewing capacity was modelled against fleet size. Residency economics were assessed at three client sites, and comparable provider fleet strategies were benchmarked over the same period. Cadet intake economics were then tested against fleet size.
KEY FINDINGS
  1. Utilisation losses traced overwhelmingly to crewing shortfalls and vessel unavailability rather than to any absence of demand, which the capital case had assumed was the constraint.
  2. The existing fleet could not be fully crewed at any point in either year, meaning six additional vehicles would have been idle assets from the day they arrived.
  3. Two client sites showed residency economics that were already favourable on published vessel rates, and neither client had been approached with the proposition.
  4. Competitors that maintained cadet intake through the downturn were operating larger fleets with comparable capital, which explained a persistent utilisation gap. Capital had never been the binding constraint at all.
CLIENT PROFILE
An independent ROV service provider with approximately 190 million dollars in annual revenue (client-reported, unverified by MMA), operating twenty-two work class and observation class systems across three offshore regions. Utilisation had run below the market average for two years, no residency capability existed, and cadet training had been suspended during the previous downturn and never restarted.
STRATEGIC CHALLENGE
The board had approved capital for six additional work class vehicles to address what it read as a capacity shortfall, and wanted validation before committing, since utilisation on the existing fleet did not obviously support the case for more. Nobody had decomposed the utilisation losses into their actual causes. Capacity had simply been assumed.
MMA APPROACH
We decomposed utilisation losses by cause across two years of operating records, separating vessel unavailability from crewing shortfalls and from genuine demand gaps. Crewing capacity was modelled against fleet size. Residency economics were assessed at three client sites, and comparable provider fleet strategies were benchmarked over the same period. Cadet intake economics were then tested against fleet size.
KEY FINDINGS
  1. Utilisation losses traced overwhelmingly to crewing shortfalls and vessel unavailability rather than to any absence of demand, which the capital case had assumed was the constraint.
  2. The existing fleet could not be fully crewed at any point in either year, meaning six additional vehicles would have been idle assets from the day they arrived.
  3. Two client sites showed residency economics that were already favourable on published vessel rates, and neither client had been approached with the proposition.
  4. Competitors that maintained cadet intake through the downturn were operating larger fleets with comparable capital, which explained a persistent utilisation gap. Capital had never been the binding constraint at all.
RECOMMENDED STRATEGY
Phase 1: Phase 1 (months one to nine): defer the vehicle purchase and restart cadet intake at a scale matched to existing fleet capacity. Phase 2: Phase 2 (months nine to twenty-four): develop a residency proposition for the two identified client sites and commit to one deployment. Phase 3: Phase 3 (months twenty-four to forty-eight): revisit fleet expansion only once crewing capacity exceeds the current fleet requirement. Judge the case on crewed capacity.
OUTCOME
The vehicle purchase was deferred and cadet intake restarted within one quarter. A residency proposal was submitted to one client and accepted for a trial deployment, and utilisation on the existing fleet rose measurably within a year as crewing recovered (client-reported, unverified by MMA). The board accepted crewing as the binding constraint.

Frequently Asked Questions

Foundational context covering the market sizes, CAGR, scope, country, region and competition that inform every finding below. This section is provided to cover basics and most often pre-purchase conversations, answered from the MMA Primary Research Dataset.

What is the current size of the Remotely Operated Vehicles (ROV) Market?

The market is valued at USD 3.1 billion in 2025, rising to USD 3.35 billion in 2026. Scope covers vehicle systems and the services delivered with them, not autonomous vehicles, support vessels, or subsea production equipment.

How large will the Remotely Operated Vehicles (ROV) Market be by 2036?

MMA forecasts USD 7.37 billion by 2036, an increase of USD 4.02 billion over the 2026 base. That represents an expansion multiple of 2.20 times across the forecast period.

What is the CAGR for the Remotely Operated Vehicles (ROV) Market 2026 to 2036?

The base case CAGR is 8.2%, with a bull case of 9.4% and a bear case of 7.0%. The historical rate from 2020 to 2025 was 6.8%, depressed by the 2020 offshore activity collapse.

Which segment is growing fastest?

Resident and remotely operated subsea systems at 12.3%, exactly 1.50 times the market rate. They remove the support vessel that carries roughly 78% of intervention day cost.

Who are the major companies in the Remotely Operated Vehicles (ROV) Market?

Oceaneering International, Fugro, Subsea7, DOF Group, and TechnipFMC lead on systems under operational management. The top five hold 47%, held there by crewing depth more than technology.

Which country is growing fastest?

Guyana at 12.4%, the fastest developing deepwater province anywhere since first oil. Every subsea task there sits well beyond any diving envelope, making vehicle demand absolute rather than economic.

Report Segmentation Architecture

The full report scope spans multiple orthogonal segmentation dimensions, with cross-tabulated demand data provided for each dimension pair. Coverage extends further to regional breakdowns, trend trajectories, and the competitive detail needed to support segment-level decision-making.

By Vehicle Class And Deployment Model

  • Work Class ROV Systems
  • Light Work Class ROV Systems
  • Observation And Inspection Class Vehicles
  • Resident And Remotely Operated Subsea Systems
  • ROV Tooling And Intervention Packages

By End-Use Industry

  • Deepwater Oil And Gas Production
  • Offshore Wind And Marine Renewables
  • Subsea Cable And Pipeline Operations
  • Offshore Decommissioning And Removal
  • Defence, Research And Port Infrastructure

By Commercial Model

  • Crewed Service Contracts And Campaigns
  • Multi-Year Operator Framework Agreements
  • Vehicle Sales To Operators And Contractors
  • Bareboat And Dry Rental Arrangements
  • Residency And Remote Operations Contracts

By Region

  • Latin America
  • Western Europe
  • Middle East and Africa
  • North America
  • South Asia and Pacific
  • East Asia
  • Eastern Europe

Scope, Methodology, and Coverage

Every figure in this report is reproducible from documented input assumptions. The scope below maps the historical period, the forecast horizon, the segmentation dimensions, and the countries covered, alongside the underlying primary and qualitative methodology.
Historical Period
2020 to 2025
Forecast Period
2026 to 2036
Base Year
2025 (USD billions; MMA Primary Research Dataset, August 2026)
Market Definition
This market comprises remotely operated underwater vehicle systems and the operating services delivered with them, measured at provider and manufacturer revenue across crewed service, framework, vehicle sale, rental, and residency channels. Coverage spans work class ROV systems, light work class systems, observation and inspection class vehicles, resident and remotely operated subsea systems including their docking and control infrastructure, and ROV tooling and intervention packages. Autonomous underwater vehicles operating without a tether, support and construction vessels and their chartering, subsea production equipment and controls, saturation and air diving services, survey sensors and acoustic positioning sold independently of vehicle systems, and cable and pipeline installation spreads fall outside scope.
Quantitative Units
USD billions (current prices); systems under operational management; vehicle operating days; fleet utilisation rate
Segmentation Dimensions
By Vehicle Class And Deployment Model; By End-Use Industry; By Commercial Model; By Region
Regions Covered
Latin America, Western Europe, Middle East and Africa, North America, South Asia and Pacific, East Asia, Eastern Europe
Countries Covered
Brazil, Guyana, Mexico, Trinidad and Tobago, United States, Canada, United Kingdom, Norway, Netherlands, Denmark, Germany, Angola, Nigeria, Mozambique, Saudi Arabia, United Arab Emirates, Australia, Malaysia, Indonesia, Vietnam, India, China, Japan, South Korea, Poland, Romania, and additional markets relevant to this sector
Key Companies Profiled
Oceaneering International, Fugro, Subsea7, DOF Group, TechnipFMC, Saipem, Saab Seaeye, Forum Energy Technologies, Soil Machine Dynamics, Kystdesign, Deep Trekker, Blueye Robotics, VideoRay, Teledyne Marine, IKM Subsea, Reach Subsea, Helix Energy Solutions, Ashtead Technology, ROVOP, Modus Subsea Services
Quantitative Methodology
Primary survey, n=3,800 respondents, Q4 2025, six countries; demand-side model with trade association cross-validation
Qualitative Methodology
47 expert interviews, Q4 2025; applied to validate demand model assumptions, identify emerging dynamics, and assess competitive positioning
Report Format
PDF and XLSX data workbook (Word format preview document)
Publisher
Market Minds Advisory
Report Code
MMA-2026-ENE-819
Published
August 2026
Contact
sales@marketmindsadvisory.com | www.marketmindsadvisory.com

Purchase the full Remotely Operated Vehicles (ROV) Market Report (2026 to 2036).

The full report sizes remotely operated vehicles across five vehicle classes, five end-use industries, five commercial models, and seven regions, with vessel cost dependency quantified for every deployment model throughout. Resident system economics are modelled against conventional campaign costs at real water depths and intervention frequencies. Crewing capacity is assessed as a constraint on fleet growth provider by provider. Competitive profiling covers twenty participants on systems under operational management, and residency capability is assessed separately from conventional fleet scale. Regional demand is built from water depth and installed subsea infrastructure rather than production volume.
Vessel cost dependency quantified for every deployment model assessed
Resident system economics modelled against conventional campaign cost baselines
Crewing capacity assessed as a constraint on fleet growth
Installed subsea infrastructure mapped against recurring intervention requirement
Offshore wind inspection demand modelled from operating turbine populations
Fleet utilisation decomposed into vessel, crewing, and demand causes

Built For The People Who Decide

From boardroom strategy to bench-side execution, this report is read cover-to-cover by leaders shaping the next decade of their industry, turning demand scenarios, market dynamics and valuation benchmarks into decisions.
CXOs/ Presidents/ VPs/ Managers
M&A and Corporate Development
Strategy Teams and R&D Heads
Procurement and Product Directors
Regulatory and Compliance Leaders
Investor Relations and Equity Analysts