Market Minds Advisory
Offshore Support Vessels Market Premium Report

Offshore Support Vessels Market Premium Report: A Decade of No Newbuilds Finally Caught Up

Almost nobody ordered a support vessel between 2015 and 2022, and the day rates operators are now enjoying are the delayed consequence of that decision rather than any demand surprise.

Lead Analyst

David Horsley

Published

August 2026

Make Smarter Decisions with Customized Research Insights

Request a free sample report and evaluate market opportunities, growth trends, and competitive dynamics relevant to your business needs.

2025 MARKET VALUE$24.8BMarket Size 2025
2036 FORECAST VALUE$56.1BBase Case , 2026 to 2036
CAGR 2026 TO 20367.7 %Bull 8.9% / Bear 6.5%
INCREMENTAL OPPORTUNITY$29.4BNet 10- year value creation
EXPANSION MULTIPLE2.10x2036 value over 2026 base
Strategic Levers
M&A Pipeline
Regional Outlook
Country Rankings
Competitive Intelligence
Segmental Deep-dive
Call-Us : 91 93563 13602

Executive Snapshot and Market Trajectory

The global support vessel fleet averages 14 years old and roughly 31% of it is older than twenty. Almost nothing was ordered between 2015 and 2022, so today's day rates reflect a decade of deferred capital rather than any sudden change in what operators need.
Growth runs at 7.7% and wind service leads it. Wind farm service operation vessels grow at 11.55%, exactly 1.50 times the market rate, because offshore wind maintenance requires vessels that keep crews at sea for weeks rather than transferring them daily. Western Europe holds the largest share at 31%, on North Sea oil, gas, and wind activity combined. Crew transfer vessels follow at 9.6% wherever daily trips from shore still remain practical for technicians.
Concentration is very low at 23% across the top five measured on vessel days chartered, and it has stayed low through a decade in which consolidation was widely predicted. Owners survived by laying vessels up rather than by merging, and the recovery has rewarded that patience considerably. Asian owners run standard vessel classes at costs Western operators cannot match. Charterers are contracting directly with owners rather than through brokers.
Market Definition
This market covers offshore support vessel chartering and operation serving energy and marine infrastructure, spanning platform supply vessels, anchor handling tug supply vessels, wind farm service operation vessels, crew transfer and personnel logistics vessels, and subsea construction and dive support vessels. Drilling rigs and drillships, heavy lift and installation vessels above support vessel classes, seismic survey vessels, port tugs operating exclusively inshore, and vessel construction and shipbuilding fall outside scope.
Base Year Value
$24.8B in 2025 (MMA Primary Research Dataset, August 2026)
Forecast Period
2026 to 2036, eleven discrete annual values
CAGR
7.7% base case. Bull 8.9%. Bear 6.5%.
Fastest Growth Segment
Wind Farm Service Operation Vessels: 11.6% CAGR
Fastest Growth Country
India: 10.2% CAGR
Fastest Growth Region
South Asia and Pacific: 9.7% CAGR
Largest Region
Western Europe: 31% of 2025 global value
Market Leaders
Tidewater, Edison Chouest Offshore, Bourbon Maritime, Vroon Offshore, DOF Group. Source: MMA Analysis based on company annual reports.
Primary Survey
n=3,800 procurement and R&D decision-makers, Q4 2025, six countries
Methodology
Demand-side build-up, cross-validated against public data, 47 expert interviews

Offshore Support Vessels Market Forecast Scenarios

offshore-support-vessels-market-size-forecast-scenario-1787302743806
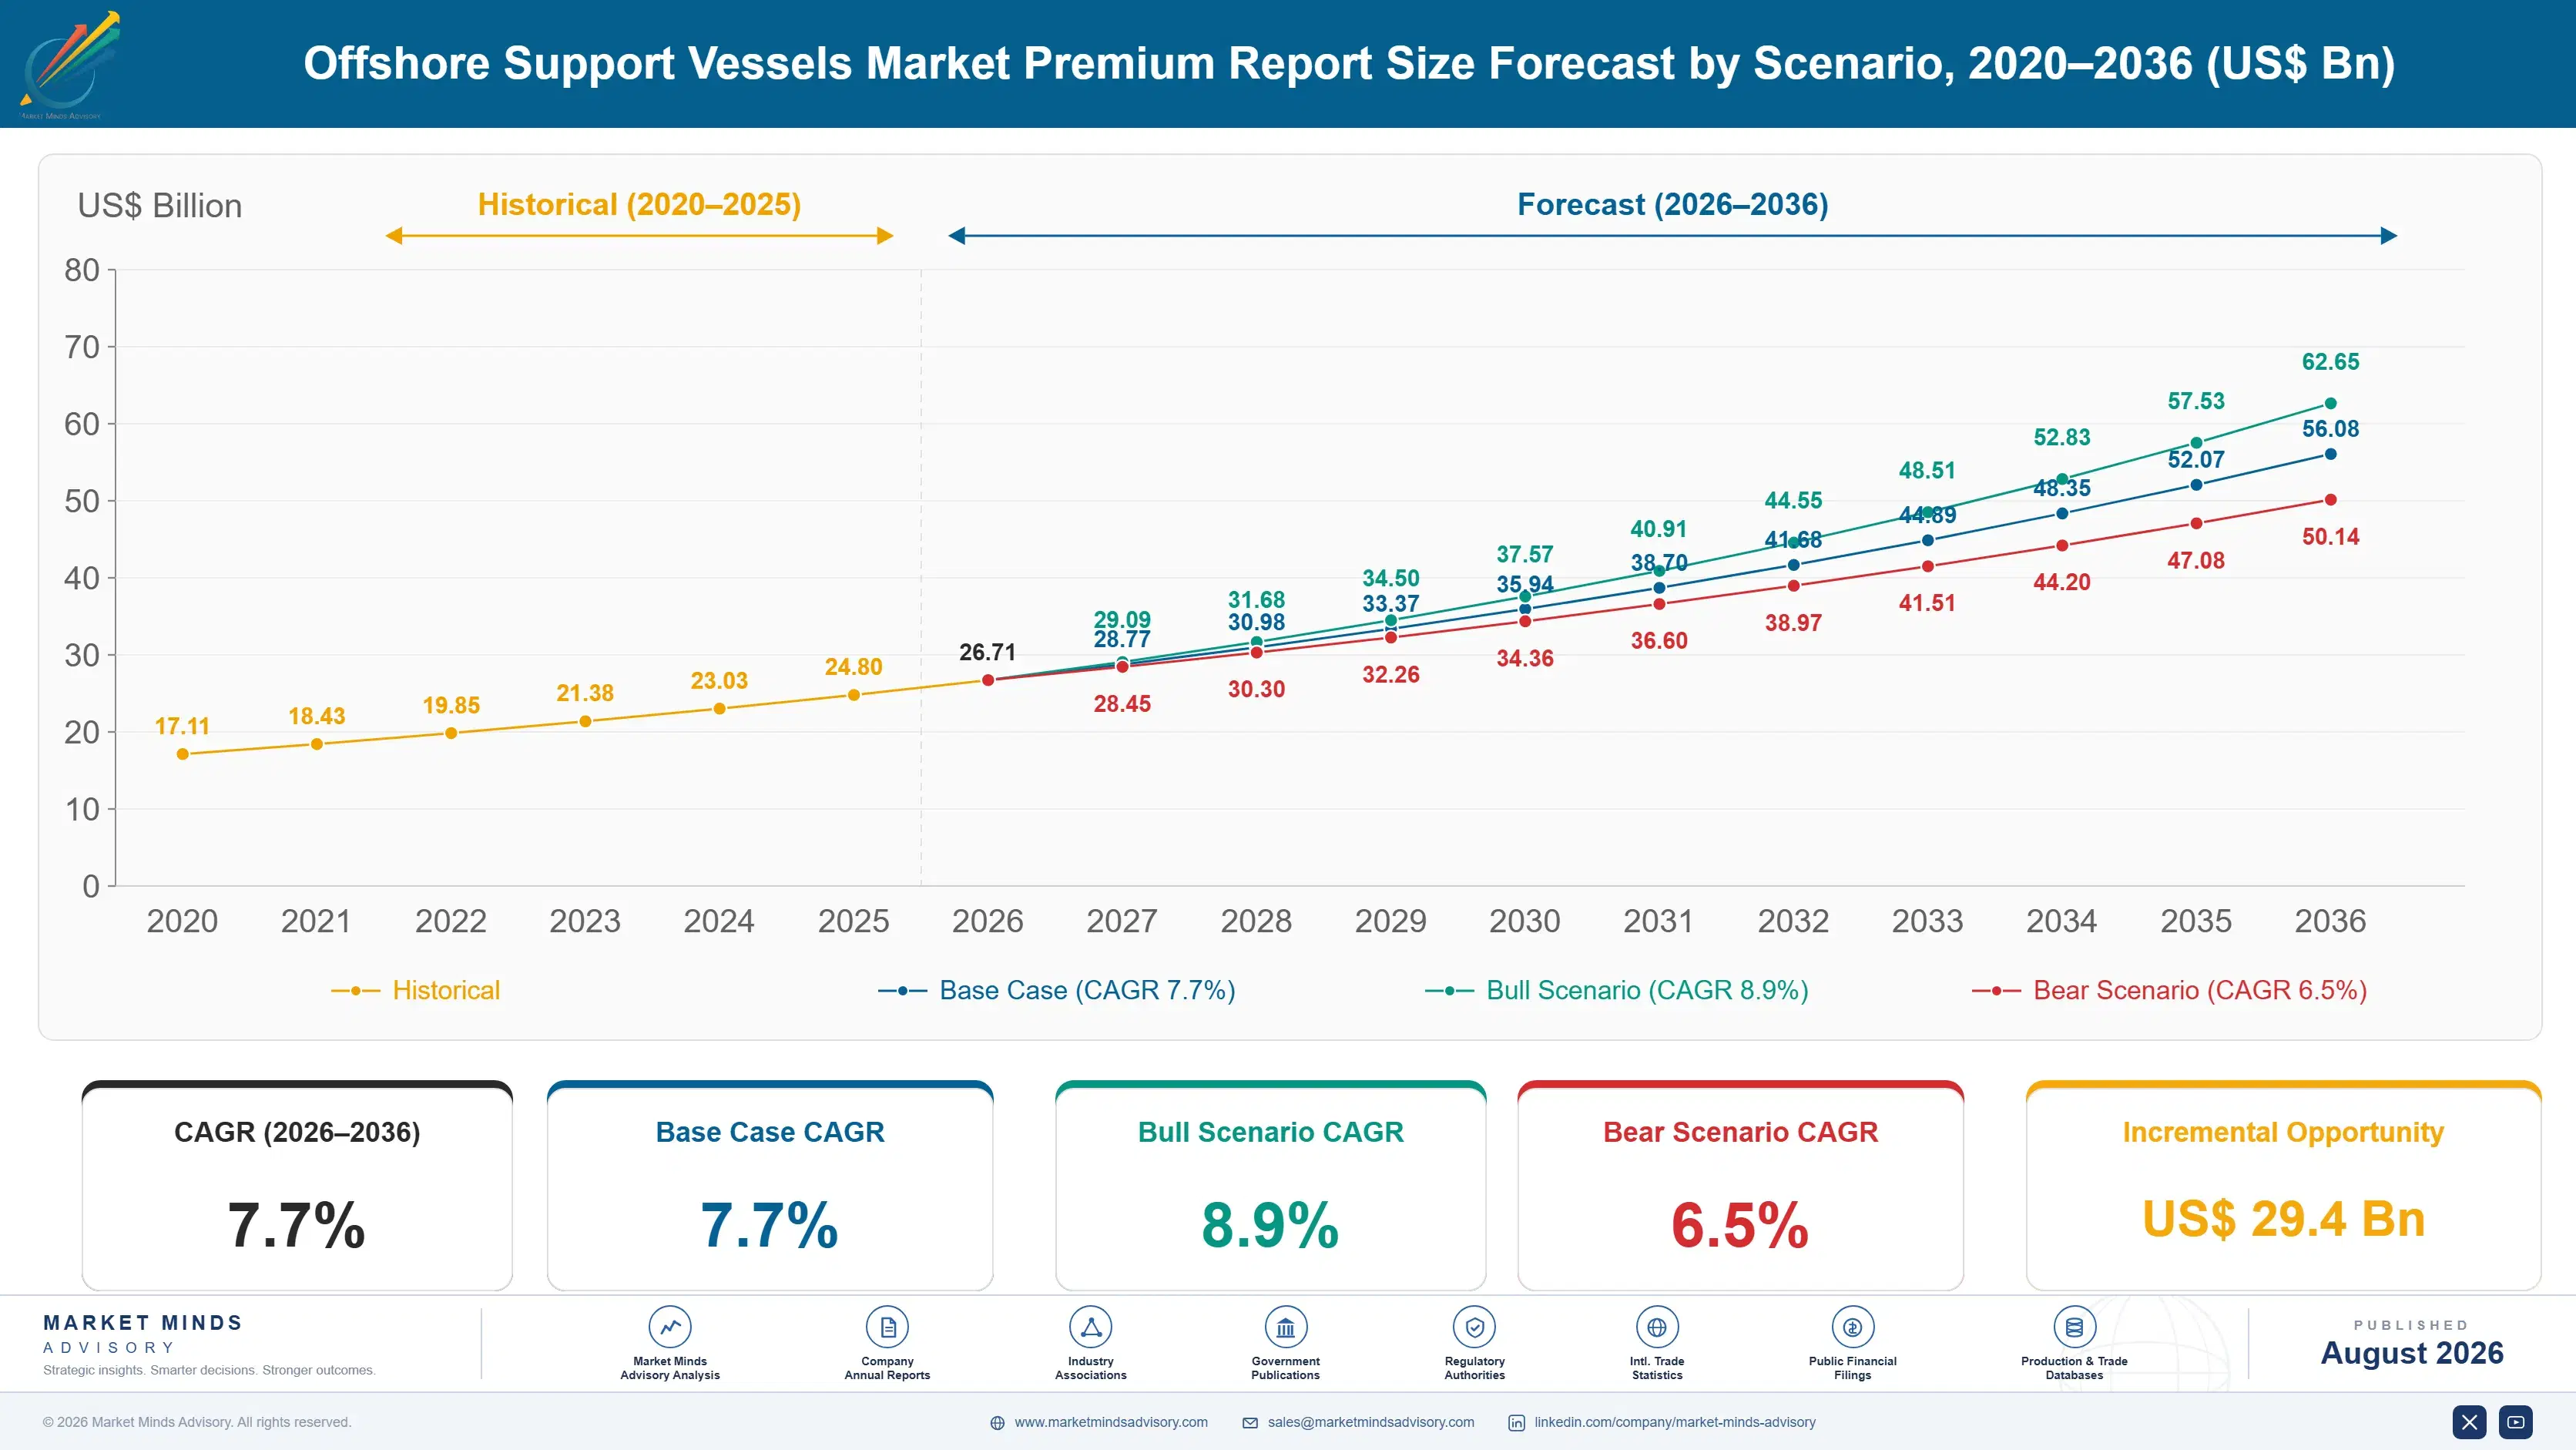
The 2020 to 2025 period ran at 6.3% and the shape of it was brutal at both ends. Day rates collapsed through 2020 as oil demand fell and vessels were stacked, then recovered sharply from 2022 as offshore activity returned to a fleet nobody had renewed. Owners who survived the downturn without selling assets captured most of the upside that followed.
Three mechanisms carry the 7.7% base case. Offshore wind operations and maintenance is the largest, since installed capacity now requires servicing regardless of what happens to new installation. Fleet age is the second, because vessels beyond twenty years face rising maintenance and tightening emissions rules. And deepwater oil and gas activity is the third, which has recovered more than most forecasts allowed for. None of the three depends on oil prices rising from here.
The 8.9% bull case rests on offshore wind maintenance demand scaling with installed capacity while newbuild delivery remains slow, extending a tight market considerably. The 6.5% bear case is a newbuild ordering wave arriving at a shipyard sector with capacity available, which would restore supply on the three-year lag that has always governed this cycle.

The Bill for a Decade of Patience

Between roughly 2015 and 2022 almost nobody ordered an offshore support vessel. The oil price collapse of 2014 left owners overleveraged against assets worth a fraction of their debt, and the survivors spent eight years stacking tonnage, restructuring, and refusing to add capacity. That decision was correct at the time, and the market operators are enjoying now was built entirely by that refusal to add capacity.
AVERAGE FLEET AGE14 yearsAcross the global support vessel fleet in active service
FLEET BEYOND TWENTY YEARS31%Of vessels now operating past their conventional replacement age
NEWBUILD DELIVERY LAG3 yearsFrom order placement to a vessel entering commercial service
TOP FIVE CONCENTRATION23%Very low, after a decade of predicted consolidation
UTILISATION ACROSS FLEET84%Of available vessel days chartered across the active global fleet
FUEL SHARE OF COST27%On term charters where the operator rather than charterer pays
The consequence is visible in the numbers. Average fleet age sits at around 14 years and roughly 31% of vessels are beyond twenty, an age at which maintenance cost rises steeply and emissions compliance becomes genuinely difficult. Utilisation runs near 84% across the active fleet, and day rates have recovered to levels that would have seemed implausible in 2019.
What makes this cycle different is the delivery lag. A vessel ordered today enters service around three years later, so no amount of current profitability changes supply before 2029. Owners know that and have been notably reluctant to order, partly from memory and partly because nobody wants to be the one who breaks a market that finally works. Discipline of that kind holds only while everybody holds it.
"Every owner I speak to says the same thing. They want somebody else to order first. That is a stable position right up until the moment three of them decide simultaneously."
Director, Offshore Marine Services and Energy Logistics Practice · MMA Energy Se

Market Trends

Wind Maintenance Creates A Different Vessel Class

Servicing an offshore wind farm means keeping technicians at sea for two-week rotations with walk-to-work gangways and motion-compensated access, which is a different vessel from anything oil and gas required. Service operation vessels grow at 11.55% against 7.7% for the market. Demand follows installed capacity rather than installation activity, so it continues even where new construction pauses, and long-term charters attached to operating wind farms are considerably more stable than project work. Walk-to-work systems and accommodation standards cannot be retrofitted into conventional support tonnage. That specification gap is what protects the class from cheaper substitution.
Market Impact: Fleet averages 14 years old
Nobody Wants To Order First In This Cycle

Newbuild ordering has stayed remarkably restrained despite day rates that would historically have triggered a wave, because owners remember what the last one did to them and a vessel ordered now arrives in around three years. Roughly 31% of the fleet is beyond twenty years old and being maintained rather than replaced. That discipline holds while it holds, and it collapses the moment enough owners conclude that somebody else is about to break it. Ordering against a contracted charter is how the disciplined owners are adding capacity at all. Speculative ordering in 2013 is what produced the decade that followed.
Market Impact: Utilisation now reaches 84%

Market Opportunities and Growth Drivers

Installed Wind Capacity Demands Servicing Regardless

Every operating offshore wind farm requires scheduled and unscheduled maintenance for its whole twenty-five year life, and that demand is entirely independent of whether new capacity is being installed. Service operation vessels sit on multi-year charters attached to specific wind farms rather than following project work around, which makes the revenue considerably more stable than anything in oil and gas support. Installed capacity keeps rising even where leasing slows. Wind operators also structure charters for twenty-year cost visibility rather than cyclical exposure. That is a fundamentally different commercial relationship from oil and gas chartering.
Market Impact: Some 31% exceed twenty years

Deepwater Activity Recovered Faster Than Forecast

Offshore oil and gas development in Brazil, Guyana, West Africa, and the Gulf of Mexico has proceeded at rates most forecasts underestimated, and deepwater projects consume platform supply and anchor handling capacity intensively throughout drilling and installation. Utilisation near 84% across the active fleet reflects that recovery meeting a fleet nobody expanded. Charterers competing for the same vessels have accepted term commitments they would previously have refused. Brazilian pre-salt and Guyanese development have both grown faster than most forecasts allowed. Term commitments charterers previously refused are now being signed readily. Scarcity rather than pricing produced that shift.
Market Impact: Vessels arrive after 3 years

Market Restraints and Challenges

Ageing Fleet Faces Emissions Rules It Cannot Meet

Roughly 31% of the fleet is beyond twenty years old, and the root cause is that nobody ordered replacements between 2015 and 2022 for entirely rational commercial reasons at the time. Commercial impact is that tightening emissions and efficiency regulation will retire tonnage the market currently depends on. Mitigation runs through retrofit where hull condition justifies it, selective newbuilding into the classes with longest charter visibility, and charterers accepting older vessels where regulation permits. Hull and machinery condition varies enormously across vessels of identical age, and that decides the retrofit economics entirely.
Market Impact: Service vessels growing at 11.55%

A Newbuild Wave Would Repeat The Last Cycle

Day rates now justify newbuilding on paper, and the root cause of everybody's reluctance is that the same arithmetic in 2013 produced the oversupply that destroyed the following decade. A vessel ordered today arrives in around three years, by which point enough others may have done the same. Commercial impact is capital discipline holding uneasily. Mitigation runs through ordering against contracted charters rather than expected rates, and through classes where demand is genuinely visible. Everybody wants somebody else to order first, which is stable until three owners move together. That position has held longer than most observers expected it to.
Market Impact: Delivery lag runs 3 years
3 additional market trends, 4 additional growth drivers, and 2 additional restraints and challenges are covered in the full report. Contact sales@marketmindsadvisory.com to access the complete intelligence.

Segment CAGR and Growth Architecture

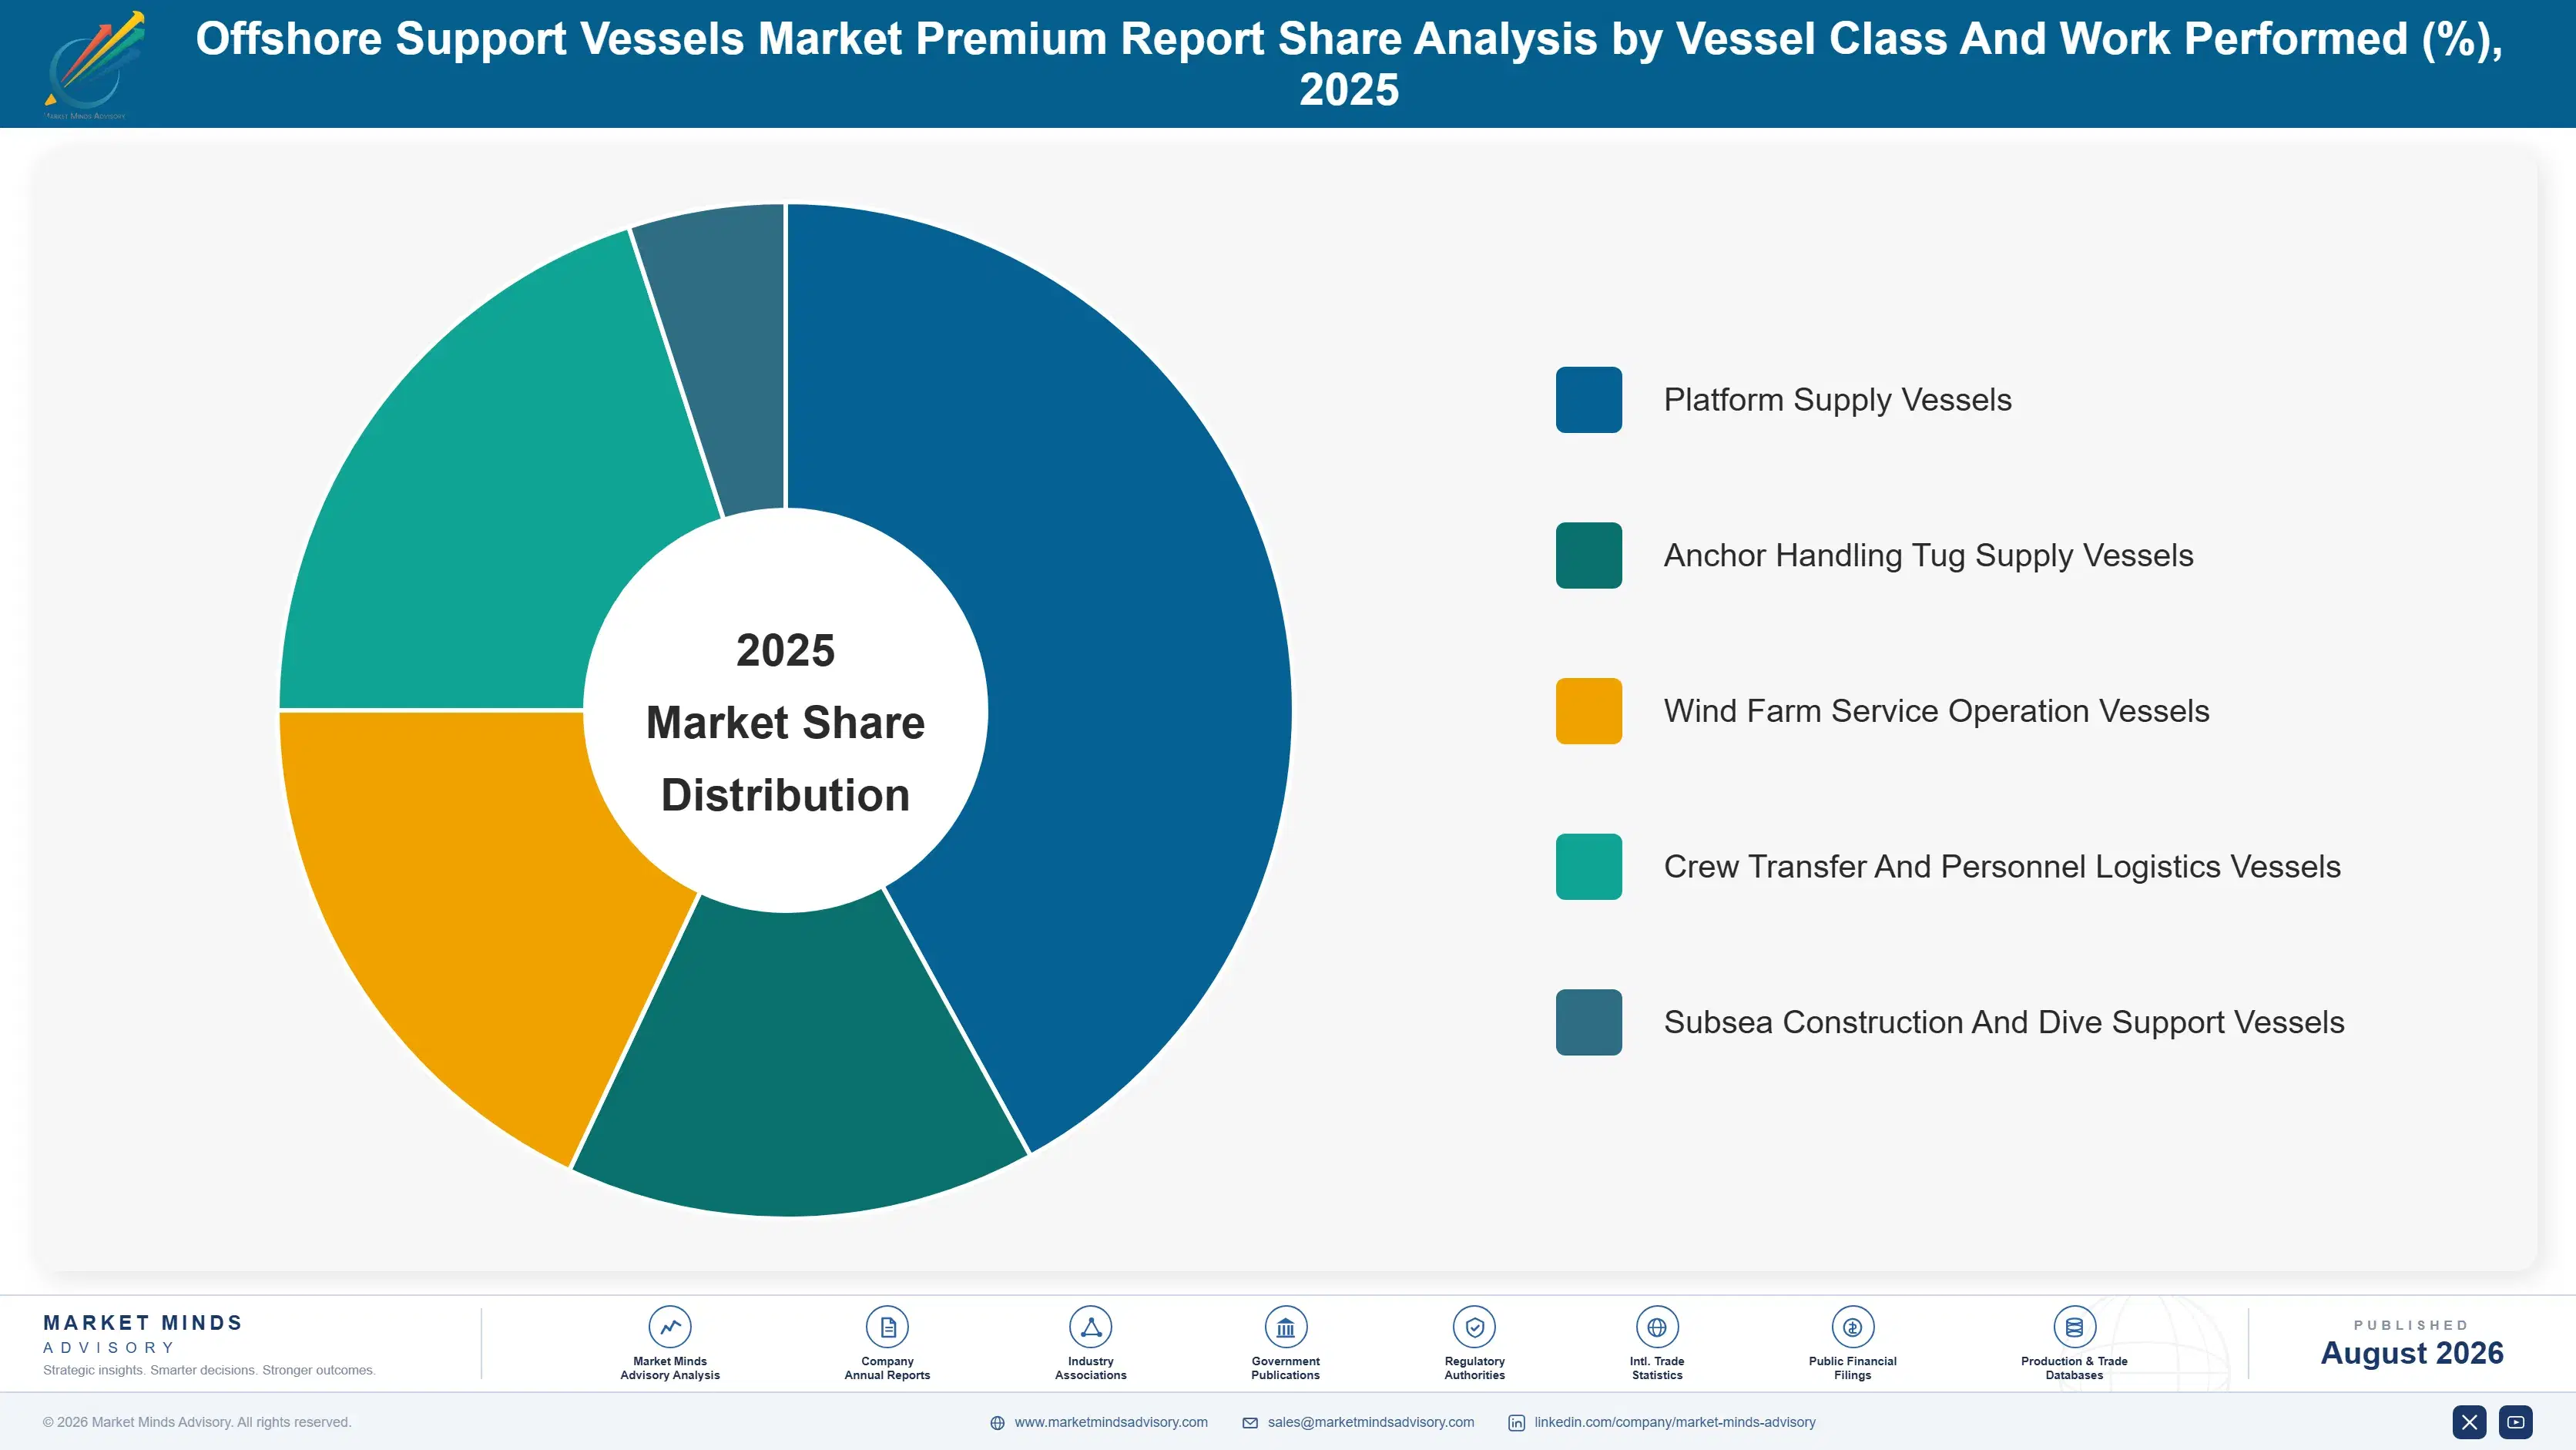
Segmentation follows vessel class and the work it performs, because those determine charter duration, day rate structure, crewing requirements, and which end market the asset can actually serve. Vessel size and propulsion configuration both cut across every class rather than separating them, which makes either a weaker primary dimension here. Vessel class decides charter duration and substitutability together.
offshore-support-vessels-market-market-share-analysis-1787302744390

Wind Farm Service Operation Vessels

The fastest class at 11.55%, exactly 1.50 times the market rate, and genuinely a different vessel from anything oil and gas support required. Walk-to-work gangways, motion compensation, and accommodation for two-week technician rotations define the specification rather than deck cargo or bollard pull. Charters here attach to specific operating wind farms for multiple years at a time, which makes revenue considerably more stable than project-driven oil and gas work. Demand follows installed capacity rather than any installation activity, so it continues even where new construction pauses entirely. Walk-to-work systems cannot be retrofitted into conventional support tonnage at any reasonable cost. Capital intensity is severe and the vessels cannot redeploy into simpler work either.
CAGR 11.6%

Crew Transfer And Personnel Logistics Vessels

Second fastest at 9.6%, carrying technicians to and from offshore wind farms daily where distance from shore permits it, which is considerably cheaper than accommodating them at sea. Vessel cost is a fraction of a service operation vessel and the operating model is entirely different, with day trips rather than rotations. Wind farms further offshore push work toward accommodation vessels instead, so this class grows with nearshore capacity specifically rather than with total installed capacity across every water depth. Charter structures resemble transport contracting more than offshore support work in most respects. Vessel utilisation follows daily technician movement rather than any project schedule. Nearshore capacity growth governs this class specifically.
CAGR 9.6%
Full segment breakdown across 5 segments available in the complete report.

Regional Architecture and Country Demand Map

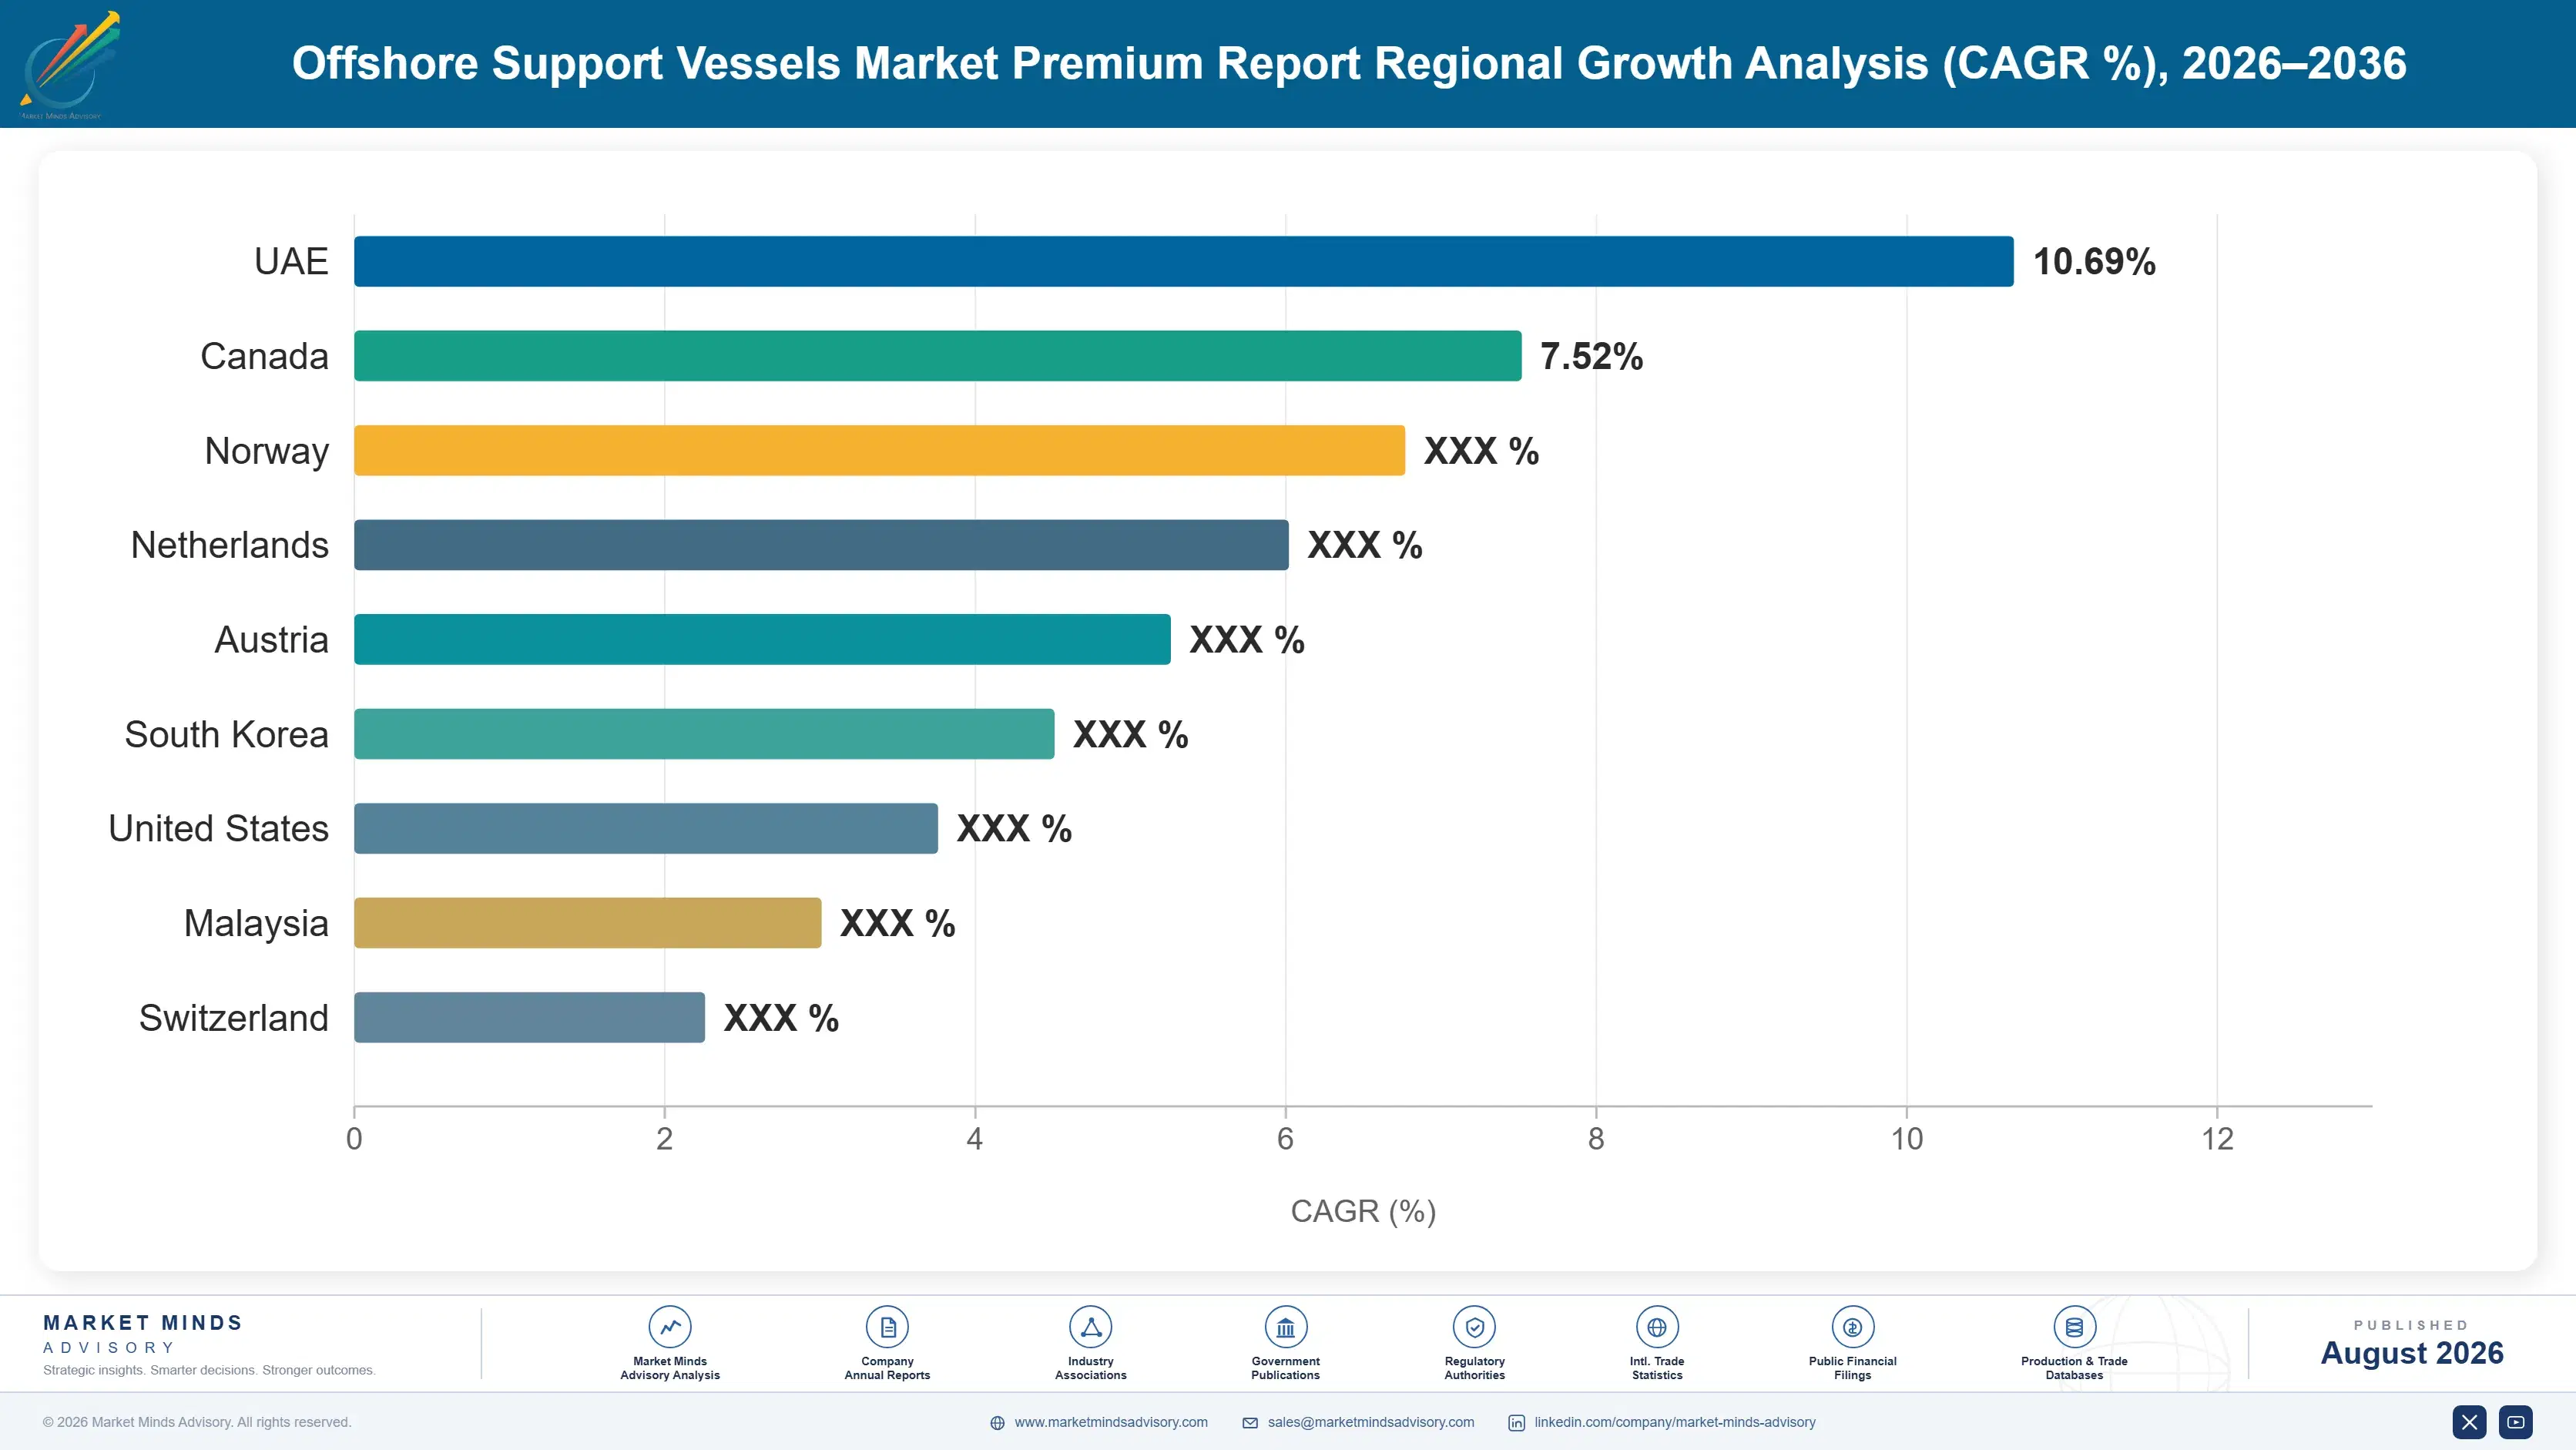
Western Europe leads at 31%, above band, on North Sea oil, gas, and offshore wind activity combined. Middle East and Africa follows on Gulf and West African offshore work. South Asia and Pacific grows fastest. Every share here follows offshore basin geography rather than economy size.

Western Europe

Thirty-one percent, above the framework band, and justified because the North Sea combines mature oil and gas support demand with the world's largest operating offshore wind fleet requiring continuous servicing. Norwegian and British operators hold much of the technically advanced tonnage, particularly in subsea construction and service operation classes. Charter durations here are longer than elsewhere because wind maintenance contracts attach to specific assets. Growth at 6.7% is the slowest of any region, reflecting a mature market rather than any weakness in activity levels. Emissions regulation is also tightest here, which will retire ageing tonnage sooner than elsewhere. Wind service capability is more developed than in any other region. Charter durations here run longer than anywhere else in the sector.
Share: 31% | CAGR: 6.7% (2026 to 2036)

Middle East and Africa

Nineteen percent, above the framework band, and Gulf offshore production support alongside West African deepwater activity accounts for nearly all of it. Saudi and Emirati offshore fields generate steady platform supply demand largely served by regionally based tonnage on long charters. West African deepwater projects consume anchor handling and subsea construction capacity intensively during development phases. Growth at 7.9% runs above the market rate, driven by both Gulf production support and renewed West African development activity. The 19% sits far above the framework band, justified because Gulf and West African offshore basins concentrate vessel demand geographically. Long charters on regionally based tonnage dominate the Gulf specifically. West African development phases consume anchor handling capacity intensively while they run.
Share: 19% | CAGR: 7.9% (2026 to 2036)
Regional intelligence for 5 additional markets available in the complete report: East Asia, Latin America, North America, South Asia and Pacific, Eastern Europe. Contact sales@marketmindsadvisory.com.
offshore-support-vessels-market-country-cagr-analysis-1787302744997

Holding Discipline Through the Upcycle

The fleet averages 14 years, roughly 31% is beyond twenty, newbuilds take three years to arrive, and utilisation runs near 84%. Value comes from ordering against contracted charters, from building into wind service classes, and from retrofitting only where hull condition genuinely justifies it. The three-year delivery lag governs every decision taken in this cycle.

Order Against Contracted Charters Not Expected Rates

A vessel ordered today arrives in roughly three years, by which point enough other owners may have reached the same conclusion from the same day rates. Ordering against a signed multi-year charter removes the timing risk that destroyed the previous cycle, because the asset carries committed work from delivery regardless of where the spot market has gone. Owners who ordered speculatively back in 2013 then spent the following decade proving exactly why that approach fails. Everybody currently wants somebody else to order first, which is stable until three owners move at once.
Market Impact: Newbuilds arrive roughly 3 years af

Build Into Classes With Visible Charter Demand

Wind farm service operation vessels grow at 11.55% against 7.7% for the market, and their charters attach to specific operating assets for multiple years rather than following project work. That visibility is exactly what a newbuild decision needs and exactly what standard platform supply tonnage lacks. Owners adding capacity into classes with contracted demand carry very different risk from those adding vessels into a spot market they cannot forecast three years ahead. Walk-to-work capability also cannot be retrofitted into conventional tonnage at any reasonable cost. That specification barrier is what makes the demand durable.
Market Impact: Wind service vessels are growing at

Retrofit Where Hull Condition Genuinely Justifies It

Roughly 31% of the fleet is beyond twenty years old and facing emissions rules it was never designed for, though hull and machinery condition varies enormously across individual vessels of otherwise identical age. Selective retrofit extends useful life at a small fraction of newbuild cost wherever the underlying asset is genuinely sound. Owners retrofitting indiscriminately spend capital on hulls that will never justify it, while owners retrofitting nothing at all lose tonnage the market still genuinely needs. Assessing hull and machinery condition properly costs survey time and prevents both errors.
Market Impact: Roughly 31% of the fleet exceeds tw

Convert Spot Exposure Into Term While Rates Hold

Utilisation near 84% and recovered day rates give owners negotiating position that did not exist for a decade, and charterers competing for scarce vessels have accepted term commitments they previously refused. Locking multi-year coverage now trades some upside for survival through whatever follows, which is a trade the last cycle taught expensively. Owners who spent 2014 to 2021 on spot exposure learned exactly what an unprotected position costs. Wind operators structure charters for long cost visibility and accept multi-year terms readily. Oil and gas charterers are only now doing the same under scarcity.
Market Impact: Utilisation currently runs at 84% a

Who Controls the Margin Pool

Concentration is very low at 23% across the top five measured on vessel days chartered, and it stayed low through a decade in which consolidation was confidently predicted every year. Owners survived the downturn by stacking vessels and restructuring debt rather than by merging, and lenders holding distressed positions preferred workouts to forced sales. The result is a fragmented sector entering an upcycle with more independent owners than anybody expected.
Competitive activity runs on three fronts. Wind service vessel capability is the first, since that class requires walk-to-work systems and accommodation standards that conventional support tonnage cannot retrofit into. Charter coverage duration is the second, which determines who survives the next downturn rather than who profits from this upturn. And regional positioning is the third, where local content rules and cabotage shape who can compete at all.

Pressure arrives from two directions. Asian owners operate standard vessel classes at cost positions Western operators cannot match. And charterers are contracting directly with owners rather than through brokers, which compresses intermediary margin. Both pressures fall hardest on owners holding standard tonnage rather than specialised classes.

Rankings shift on charter awards rather than on fleet additions.
offshore-support-vessels-market-company-positioning-matrix-1787302745575

Competitive Moat and Risk Dimensions

TIDEWATER

Moat: Fleet scale and global positioning

Operating one of the largest support vessel fleets across multiple regions lets a company serve charterers who need tonnage in several basins and value a single counterparty across them. Scale also provides negotiating position on term charters that smaller owners cannot match. Surviving the downturn with the fleet intact was the decision that created that position.
TIDEWATER

Risk: Fleet age against emissions regulation

A large fleet assembled without newbuilding through a decade carries an age profile that tightening emissions and efficiency rules will eventually retire, and scale multiplies that exposure rather than diluting it. Retrofit addresses part of the fleet and not all of it. Age becomes a liability at precisely the moment the tonnage is most valuable.
DOF GROUP

Moat: Subsea and wind service capability

Holding subsea construction and wind service tonnage rather than only conventional support vessels places the company in the classes with the longest charter visibility and the highest specification requirements. Those vessels cannot be substituted by standard platform supply tonnage regardless of day rate, which insulates the position from the cost competition affecting conventional classes considerably.
DOF GROUP

Risk: Specialised tonnage carries capital intensity

Subsea construction and service operation vessels cost multiples of conventional support tonnage and cannot be redeployed into simpler work if their intended market weakens. Specialisation that protects day rates in a strong market concentrates risk in a soft one. Capital intensity of that kind is unforgiving through any downturn.

Players Tracked

Prominent Players

Tidewater
Edison Chouest Offshore
Bourbon Maritime
Vroon Offshore
DOF Group

Other Key Players

Solstad Offshore
Havila Shipping
Siem Offshore
Maersk Supply Service
SEACOR Marine
Vallianz Holdings
POSH Semco
Nam Cheong
Great Eastern Shipping
Cadeler
Esvagt
North Star Shipping
Louis Dreyfus Armateurs
Rem Offshore
Britoil Offshore Services

Recent Developments

JANUARY 2025

Owner orders service operation vessel against signed charter

An offshore vessel owner ordered a wind farm service operation vessel only after securing a multi-year charter attached to a specific operating wind farm, rather than building speculatively against prevailing day rates. The order was capital expenditure supported by contracted work rather than any joint venture, acquisition, or shipyard partnership.
Signal: Ordering against a signed charter removes
APRIL 2025

Charterer accepts multi-year term after competing for scarce tonnage

An offshore operator agreed a multi-year term charter on vessels it had previously contracted on spot arrangements, after repeatedly failing to secure tonnage during periods of peak activity. The agreement was a commercial charter rather than any joint venture, acquisition, or equity arrangement with the vessel owner.
Signal: Scarcity converts charterers into term cou
AUGUST 2025

Owner retrofits selected vessels rather than the whole fleet

A support vessel owner completed emissions and efficiency retrofits on a subset of its fleet selected by hull and machinery condition, rather than applying the programme uniformly across vessels of similar age. The programme was internal capital expenditure rather than any acquisition, joint venture, or regulatory settlement.
Signal: Hull condition varies enormously across ve

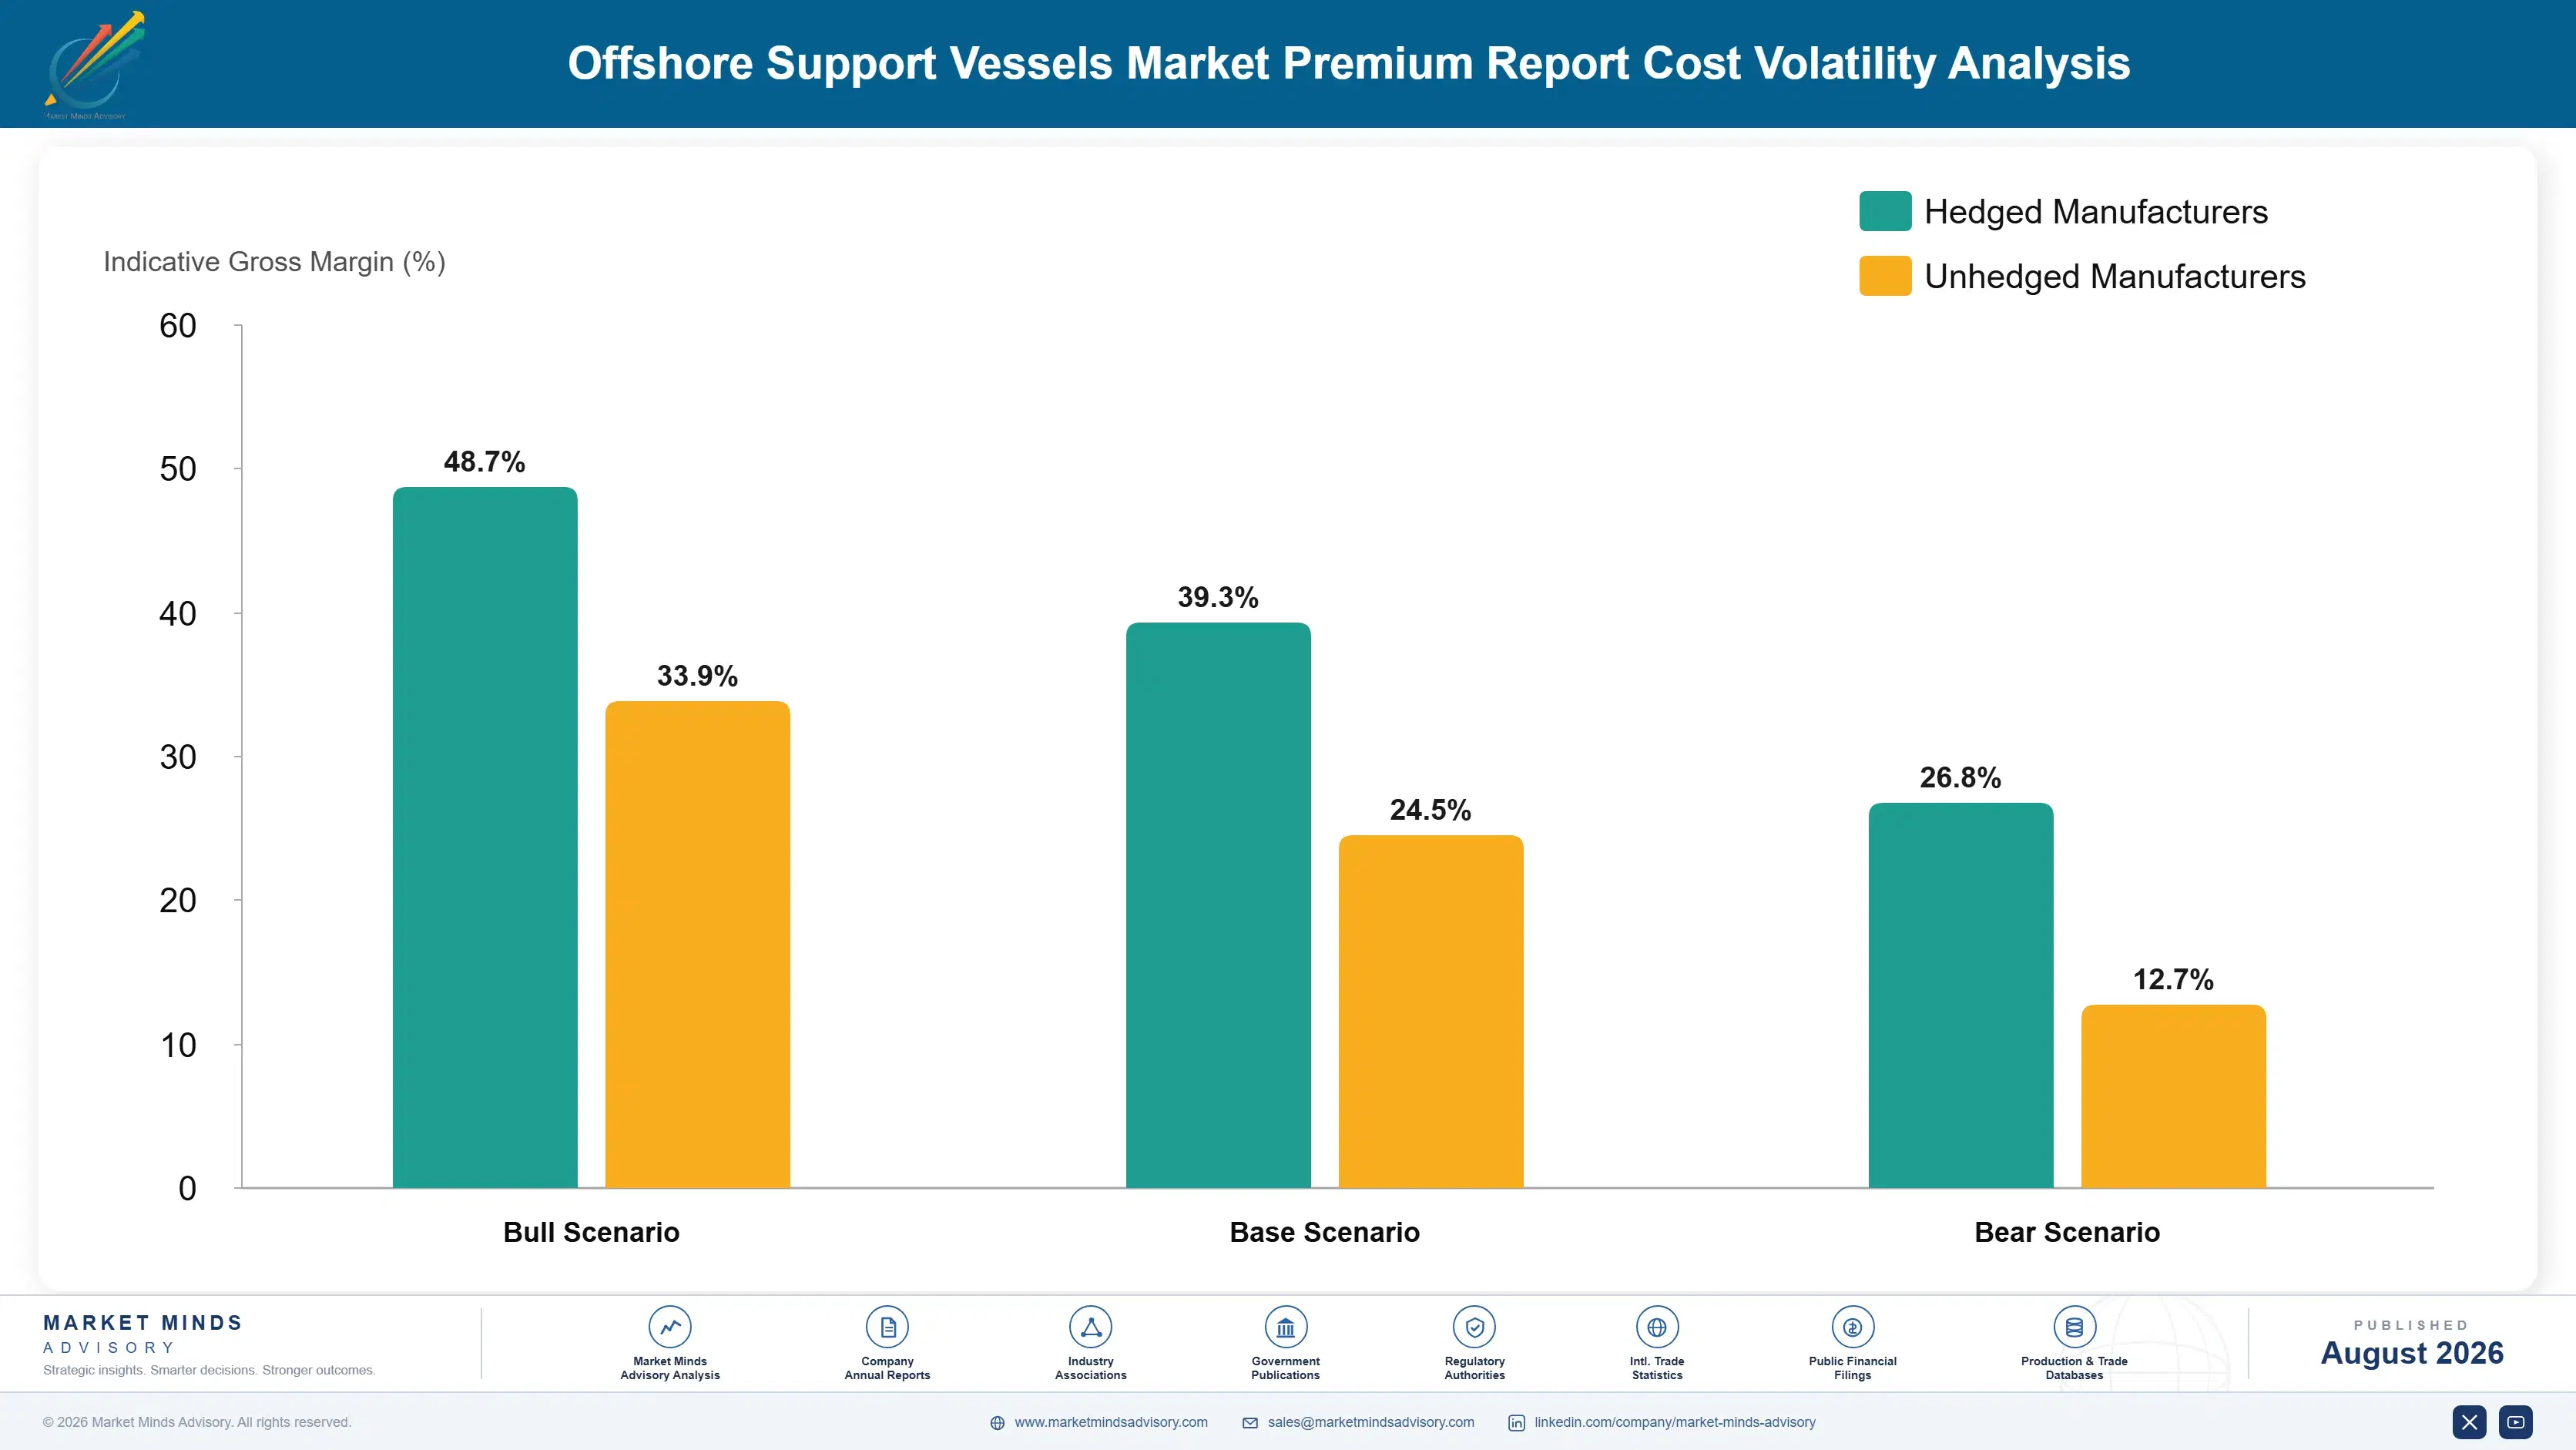
Fuel, Crew and Drydocking

Fuel carries roughly 27% of operating cost on term charters where the owner bears it, crew wages and rotation about 31%, maintenance and spares near 16%, insurance and class around 9%, and drydocking amortisation, management, and overhead the balance. Crew cost has become the dominant variable rather than fuel, which reverses the position that held for most of the previous decade across this sector.
Marine fuel pricing moved sharply through 2022 and several vessel operators disclosed increased bunker cost and charter renegotiation in annual filings covering that year. Offshore crew wages then rose persistently from 2023 as experienced officers and engineers who left during the downturn did not return, and that increase has proved considerably more durable than the fuel movement that preceded it. Wage pressure shows no sign of easing.

The competitive disadvantage mechanism runs through crew availability rather than through fuel purchasing. Experienced offshore crew left the sector through eight years of stacking and redundancy and have not come back, so an owner without retained crew competes for scarce officers at whatever the market demands. Fuel costs broadly the same for everyone; the people to run the vessel emphatically do not.
offshore-support-vessels-market-cost-volatility-analysis-1787302745780

Retain crew through downturns rather than releasing them

Crew wages carry about 31% of total operating cost, and the experienced offshore officers who left during the long 2015 to 2022 stacking period have very largely not returned to the sector at all. Owners who retained their crews through that whole downturn now hold a capability competitors simply cannot buy at any wage.

Structure charters so fuel exposure sits with the charterer

Fuel carries roughly 27% of operating cost where the owner bears it, and bunker pricing moves independently of anything an owner controls or can hedge cheaply. Time charter structures placing fuel with the charterer remove that volatility entirely from the owner's earnings. Charterers resist during soft markets and accept readily when tonnage is scarce, which is exactly now.

Plan drydocking against charter gaps rather than class dates

Drydocking removes a vessel from earning service during a period when utilisation runs near 84% and day rates are strong, so timing it into a charter gap rather than against a class deadline preserves revenue directly. That requires planning class surveys a full year ahead against the charter book rather than treating it technically.

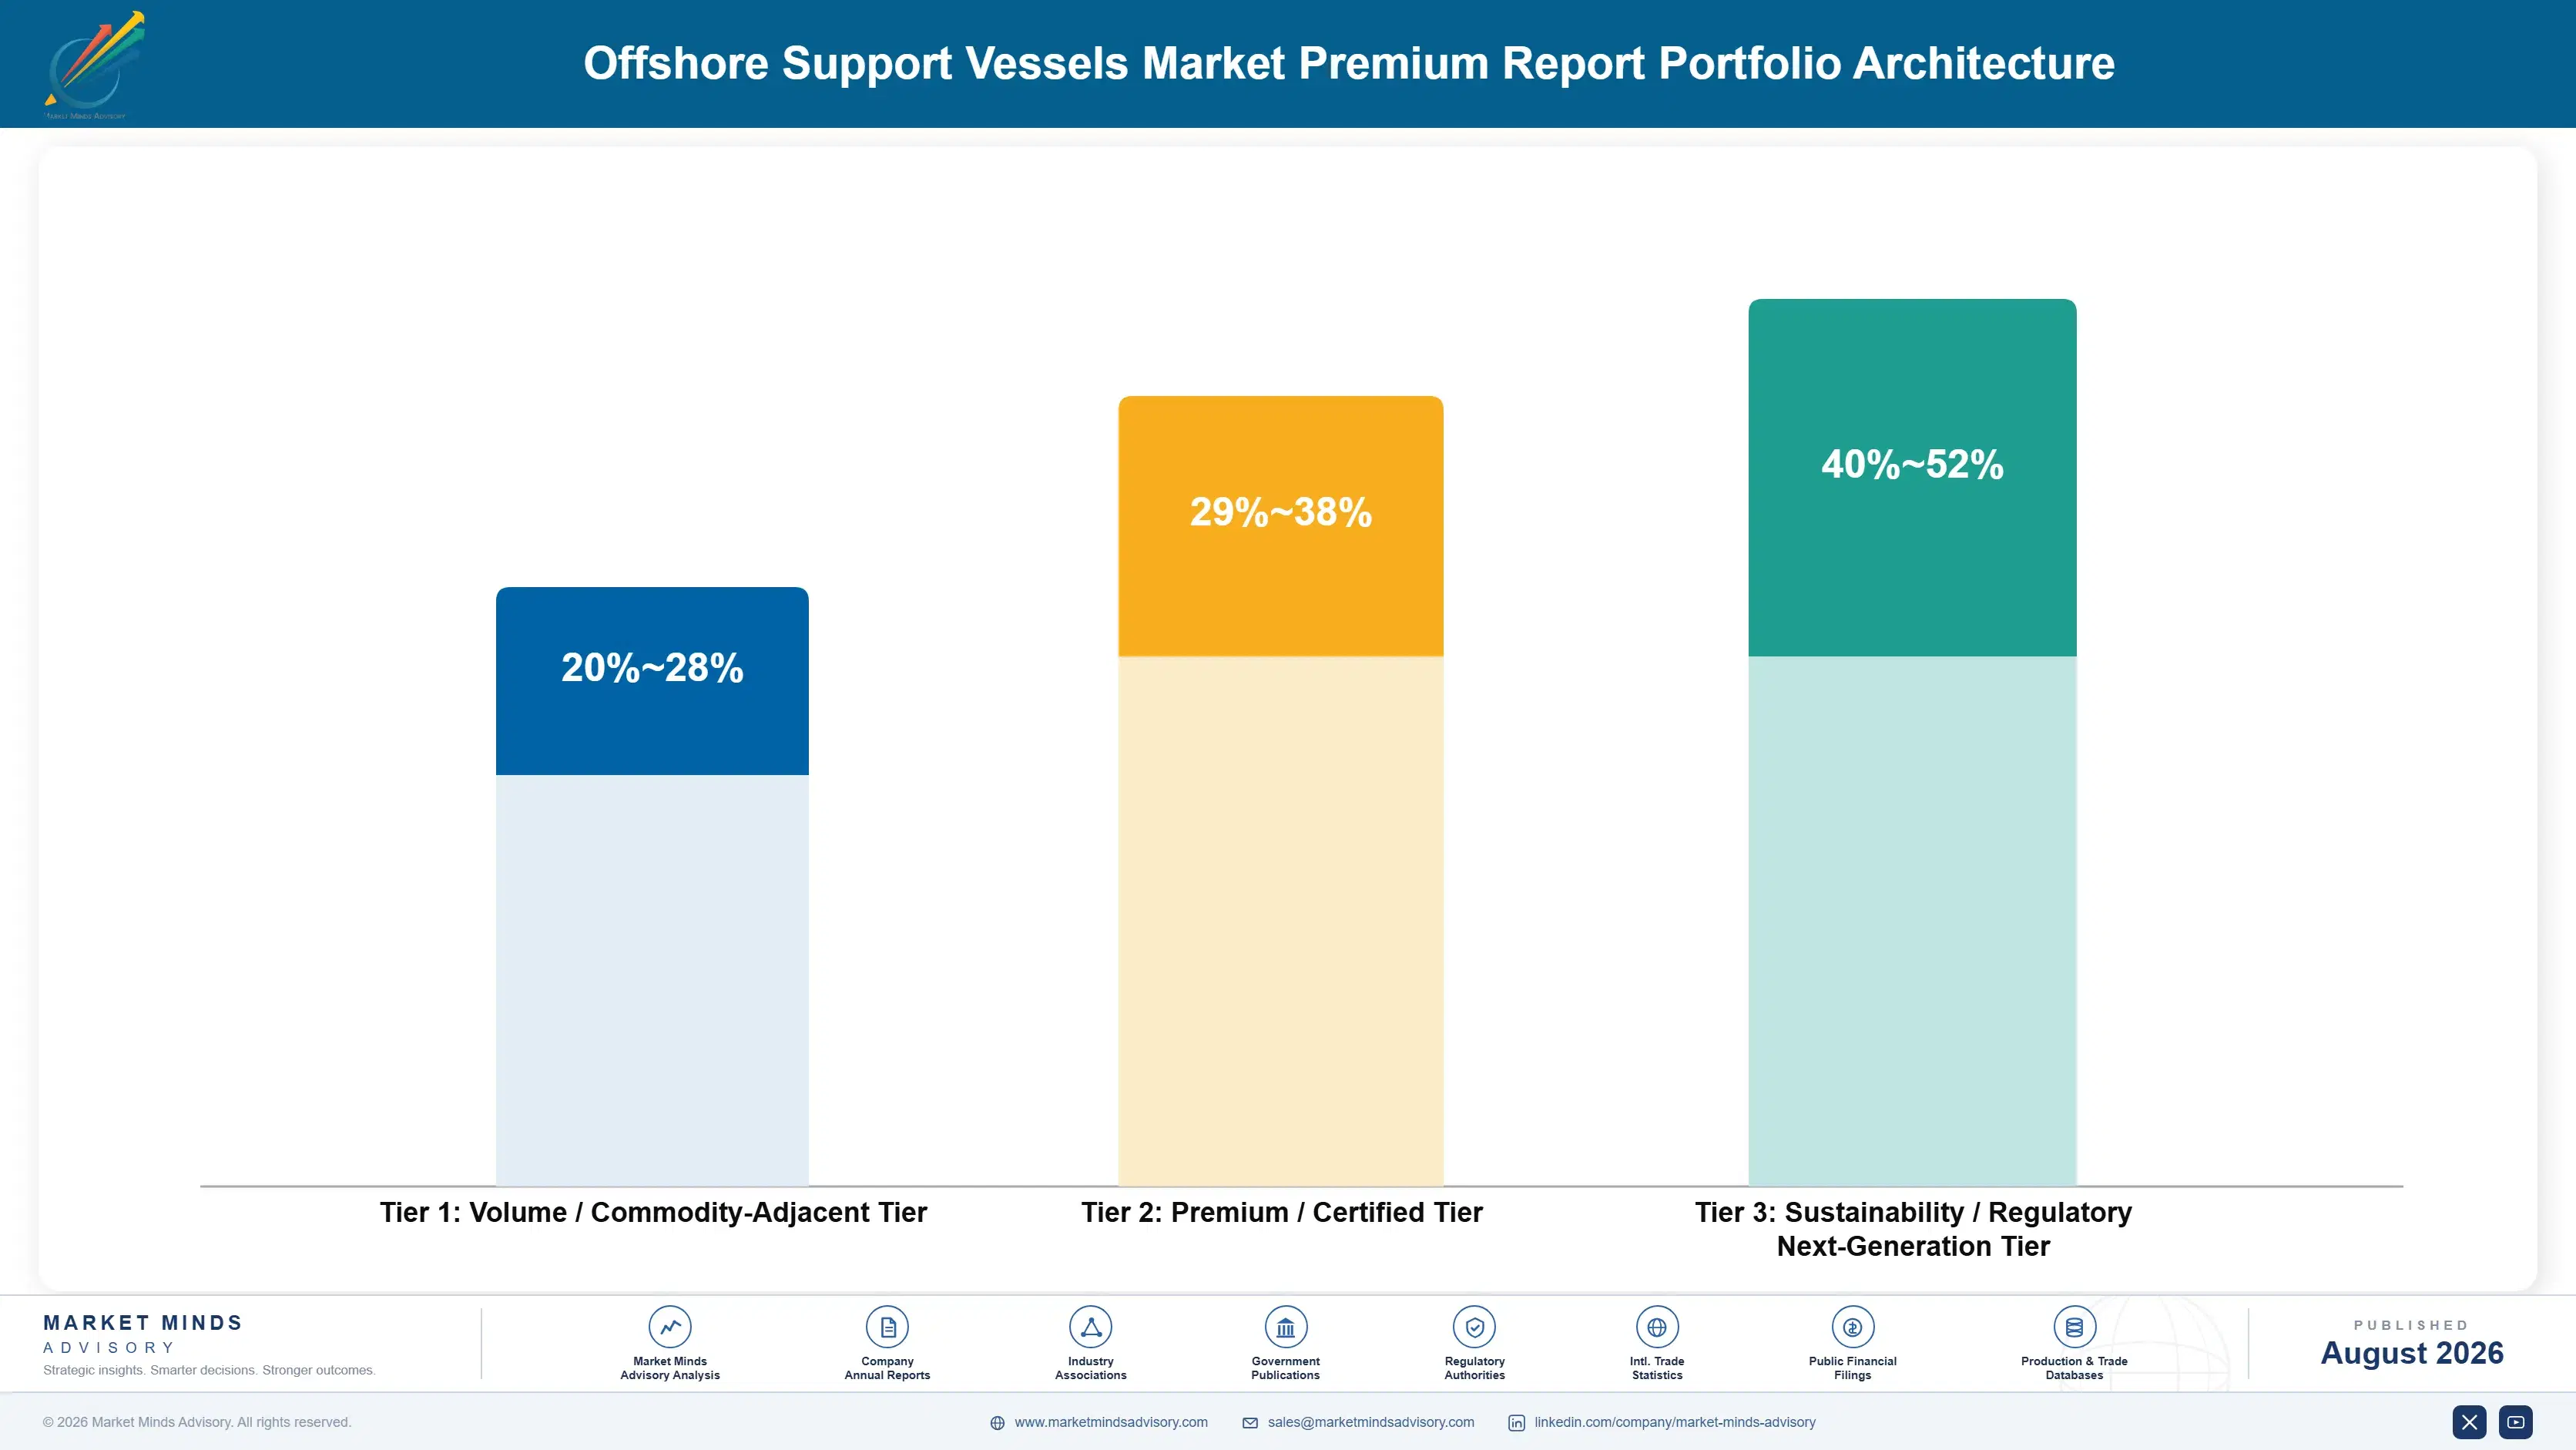
Portfolio Architecture for Margin Defence

Three tiers describe this business and the spread follows specification and charter visibility rather than vessel size. Standard platform supply tonnage sits at the bottom, competing on day rate where Asian owners hold cost positions Western operators cannot match. Anchor handling and larger conventional vessels occupy the middle. Wind service and subsea construction tonnage sits at the top, where specification and multi-year charters both apply.
The tension is that the top tier costs multiples of conventional tonnage and cannot be redeployed into simpler work if its market softens. A specialised vessel protects day rates through a strong market and concentrates risk through a weak one, while a conventional fleet is redeployable and permanently exposed to cost competition. Owners are choosing between two quite different risk profiles rather than between good and bad ones.

High-value pools concentrate where the vessel cannot be substituted. Wind service operation tonnage with walk-to-work access is the clearest case, since no amount of day rate discount makes a standard supply vessel able to do that work. Subsea construction tonnage pools value similarly, since standard supply vessels cannot perform that work at all. Both pools carry capital intensity that conventional classes avoid.

Volume / Commodity-Adjacent Tier

Standard platform supply vessels competing on day rate where Asian owners hold cost positions Western operators cannot match. Redeployable across regions and permanently exposed to whatever the spot market decides in any given quarter.
Gross Margin: 20-28%

Premium / Certified Tier

Anchor handling tug supply and larger conventional tonnage serving deepwater development, where bollard pull and deck capability limit which vessels can compete. Charter durations sit between spot supply work and specialised long-term arrangements.
Gross Margin: 29-38%

Sustainability / Regulatory / Next-Generation Tier

Wind farm service operation and subsea construction vessels where walk-to-work systems and specialised capability cannot be substituted at any day rate. Best margin by a clear distance, with multi-year charters attached to specific operating assets.
Gross Margin: 40-52%
offshore-support-vessels-market-portfolio-architecture-1787302746280

Charters, Cycles and Crews

Demand arrives through spot fixtures, term charters, and multi-year contracts attached to specific assets, and those behave nothing alike. Spot work follows drilling and construction activity and reprices constantly. Term charters run one to three years and reflect a charterer's view of tightness. Wind farm service contracts attach to an operating asset for its maintenance life, which is a fundamentally different commercial relationship from anything oil and gas support generated.
Stickiness follows specification rather than relationship. A service operation vessel fitted to a specific wind farm's access requirements and crewed by technicians who know the site is genuinely difficult to replace mid-contract. Subsea construction tonnage sticks through capability. Standard platform supply vessels stick not at all and are refixed continuously on availability and rate across every basin.

Buyer profiles shifted as offshore wind operators entered a market previously dominated by oil companies. The earlier charterer was an oil and gas operator accustomed to cyclical spot markets and comfortable with them. The current population includes wind operators who want twenty-year cost visibility and structure charters entirely differently as a result. Those charterers negotiate against a maintenance budget spanning decades rather than a drilling programme.
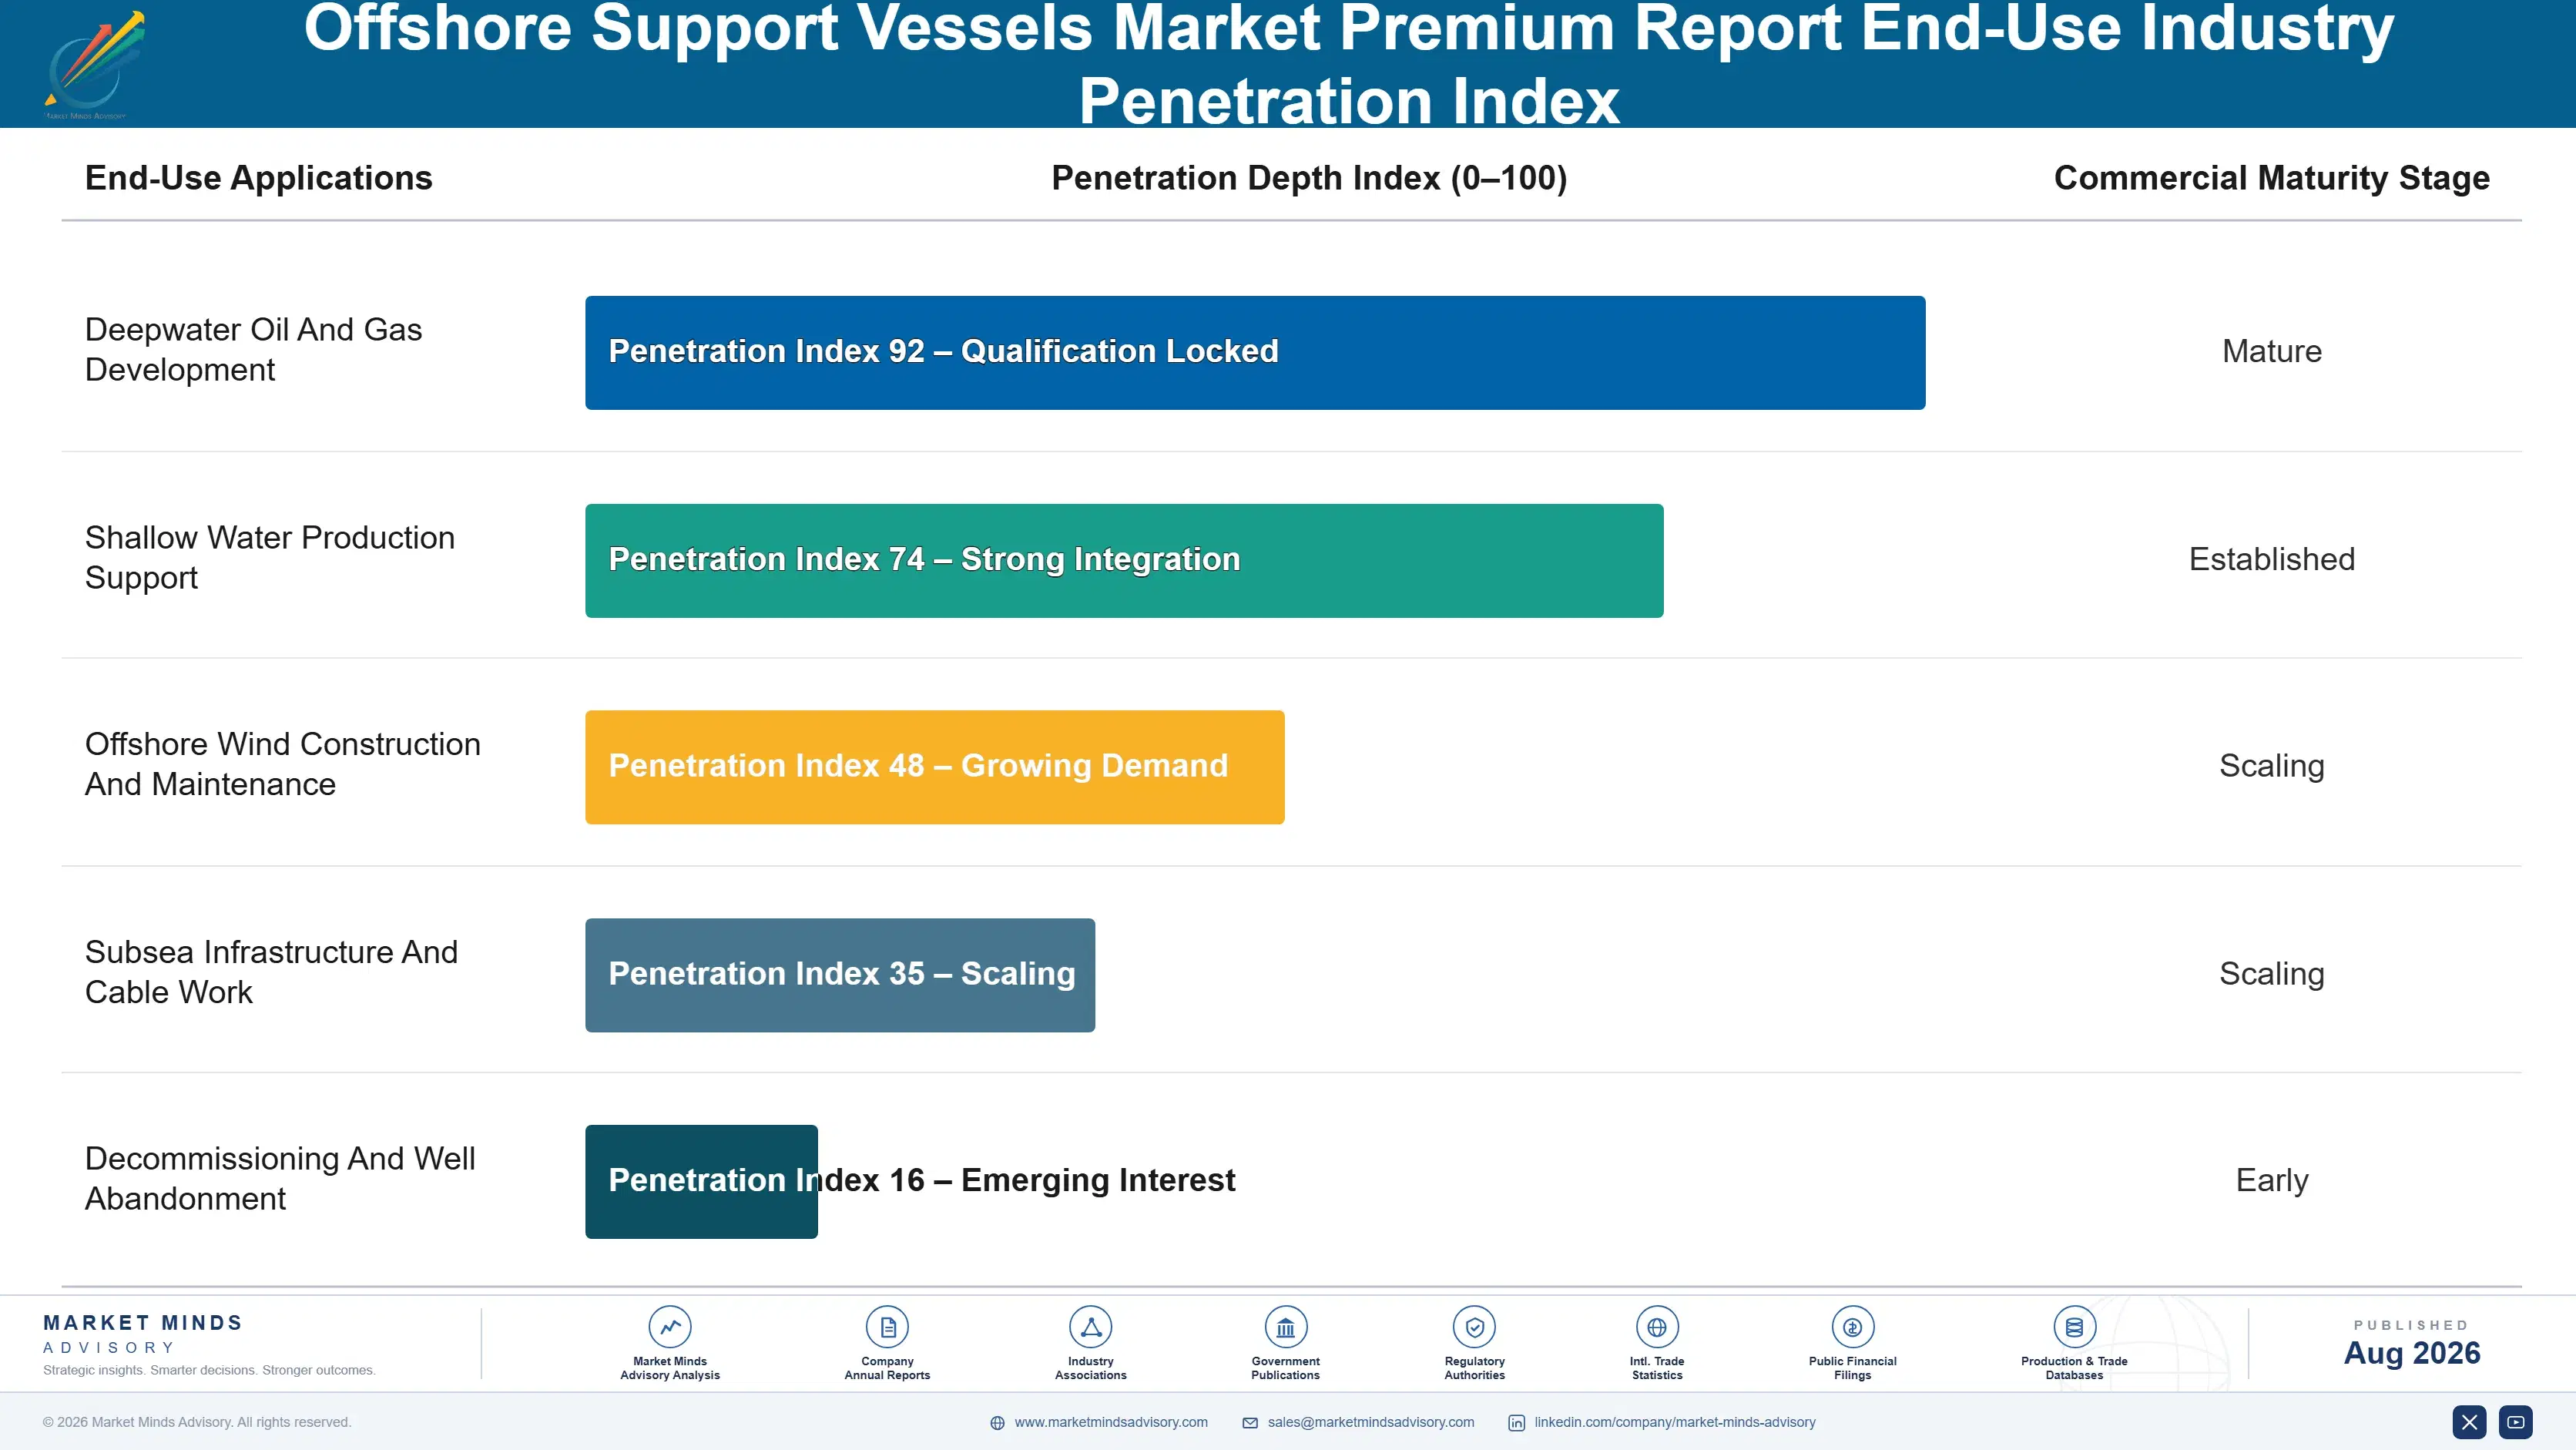
offshore-support-vessels-market-end-use-penetration-index-1787302746774

What We Would Tell a Board

These are among the four positions where our research anticipates prominent divergence between winners and laggards over the coming forecast period. Each is grounded in the demand model, the regulatory perimeter, and the announced capacity pipeline.
01 / NEWBUILD ORDERING DISCIPLINE

Order against a charter or do not order at all

A vessel ordered today enters commercial service in roughly three years, by which point enough other owners may have reached exactly the same conclusion from exactly the same day rates they are seeing now. Ordering against a signed multi-year charter removes entirely the timing risk that destroyed the previous cycle, since the asset then carries committed work from the day of delivery. Owners who ordered speculatively back in 2013 then spent the following decade demonstrating precisely why that particular approach fails.
02 / CLASS SELECTION PRIORITY

Build where the charters are visible three years out

Wind farm service operation vessels are growing at 11.55% against 7.7% for the wider market, and their charters attach to specific operating assets for multiple years rather than following project work between basins. That visibility is exactly what any newbuild decision actually requires, and exactly what standard platform supply tonnage cannot offer anybody at all. Owners adding capacity into classes with genuinely contracted demand carry a completely different risk profile from those adding tonnage into a spot market they cannot forecast.
03 / TERM COVERAGE CONVERSION

Trade some upside now for surviving what follows

Utilisation near 84% and recovered day rates together give owners a negotiating position that simply did not exist for an entire decade, and charterers now competing for genuinely scarce tonnage have accepted term commitments they had previously refused outright. Locking multi-year charter coverage now trades away some of the available upside in exchange for survival through whatever comes next. Owners who spent 2014 through 2021 carrying heavy spot exposure learned in detail exactly what an unprotected position costs a business.
04 / CREW RETENTION VALUE

The people are scarcer than the vessels now

Crew wages carry about 31% of operating cost, and the experienced offshore officers and engineers who left through eight years of stacking and redundancy have very largely not returned to the sector. An owner without any retained crew competes for genuinely scarce officers at whatever the market currently demands, and no amount of capital resolves that situation quickly. Owners who held onto their crews through the whole downturn now hold a capability that competitors simply cannot purchase at any price.

Engagement Snapshot From the Field

A live engagement with an industry participant carrying material or product regulatory and market exposure ahead of a defining policy shift, showing how our research translates into a defensible multi-year portfolio strategy.
MARKET MINDS ADVISORY · CLIENT ENGAGEMENT SUMMARY
Offshore Support Vessels Premium Report Producer Strategic Portfolio Review and Transition Roadmap 2026·Investment Scenario on Offshore Support Vessels Premium Report Exposure Evaluation 2025-26
CLIENT PROFILE
An offshore support vessel owner with approximately 310 million dollars in annual revenue (client-reported, unverified by MMA), operating platform supply and anchor handling tonnage across two regions with an average fleet age above the sector norm. Charter coverage was heavily spot-weighted, no wind service capability existed, and management had proposed a substantial newbuild programme against current day rates.
STRATEGIC CHALLENGE
The board was uneasy about committing to newbuilds on the same reasoning that had produced the previous oversupply, and wanted an independent view on class selection and contracting approach before approving capital against a three-year delivery lag. Charter coverage had never been benchmarked against peers. Hull condition was assumed uniform.
MMA APPROACH
We modelled newbuild economics under several rate scenarios at delivery rather than at order. Charter coverage was analysed by duration and vessel class against comparable owners. Hull and machinery condition was assessed across the existing fleet to identify retrofit candidates, and wind service charter structures were benchmarked against conventional support arrangements.
KEY FINDINGS
  1. Newbuild economics were positive only under rate scenarios that assumed no meaningful ordering by other owners, which the client had no basis to expect.
  2. Charter coverage was substantially shorter than at comparable owners, leaving the fleet exposed to a rate correction the newbuild programme would arrive into.
  3. Hull condition varied widely across similarly aged vessels, and a meaningful subset justified retrofit at a fraction of newbuild cost. Age alone had guided assumptions.
  4. Wind service charters attached to operating assets offered visibility that no conventional support class in the client's fleet could match at all.
CLIENT PROFILE
An offshore support vessel owner with approximately 310 million dollars in annual revenue (client-reported, unverified by MMA), operating platform supply and anchor handling tonnage across two regions with an average fleet age above the sector norm. Charter coverage was heavily spot-weighted, no wind service capability existed, and management had proposed a substantial newbuild programme against current day rates.
STRATEGIC CHALLENGE
The board was uneasy about committing to newbuilds on the same reasoning that had produced the previous oversupply, and wanted an independent view on class selection and contracting approach before approving capital against a three-year delivery lag. Charter coverage had never been benchmarked against peers. Hull condition was assumed uniform.
MMA APPROACH
We modelled newbuild economics under several rate scenarios at delivery rather than at order. Charter coverage was analysed by duration and vessel class against comparable owners. Hull and machinery condition was assessed across the existing fleet to identify retrofit candidates, and wind service charter structures were benchmarked against conventional support arrangements.
KEY FINDINGS
  1. Newbuild economics were positive only under rate scenarios that assumed no meaningful ordering by other owners, which the client had no basis to expect.
  2. Charter coverage was substantially shorter than at comparable owners, leaving the fleet exposed to a rate correction the newbuild programme would arrive into.
  3. Hull condition varied widely across similarly aged vessels, and a meaningful subset justified retrofit at a fraction of newbuild cost. Age alone had guided assumptions.
  4. Wind service charters attached to operating assets offered visibility that no conventional support class in the client's fleet could match at all.
RECOMMENDED STRATEGY
Phase 1: Phase 1 (months one to nine): defer the speculative newbuild programme, convert spot exposure to term charters while tonnage remains scarce. Phase 2: Phase 2 (months nine to twenty-four): retrofit the identified subset of vessels and retire tonnage where hull condition cannot justify investment. Phase 3: Phase 3 (months twenty-four to forty-two): enter wind service classes only against signed multi-year charters attached to operating assets. and not before that.
OUTCOME
The speculative programme was deferred. Term charter coverage improved materially within three quarters while rates remained strong, the retrofit subset was funded, and a first wind service vessel was ordered only once a multi-year charter had been signed (client-reported, unverified by MMA). Speculative capital was preserved entirely.

Frequently Asked Questions

Foundational context covering the market sizes, CAGR, scope, country, region and competition that inform every finding below. This section is provided to cover basics and most often pre-purchase conversations, answered from the MMA Primary Research Dataset.

What is the current size of the Offshore Support Vessels Market?

The market is valued at USD 24.8 billion in 2025, rising to USD 26.71 billion in 2026. Scope covers support vessel chartering and operation, not drilling rigs, installation vessels, seismic vessels, or shipbuilding.

How large will the Offshore Support Vessels Market be by 2036?

MMA forecasts USD 56.09 billion by 2036, an increase of USD 29.38 billion over the 2026 base. That represents an expansion multiple of 2.10 times across the forecast period.

What is the CAGR for the Offshore Support Vessels Market 2026 to 2036?

The base case CAGR is 7.7%, with a bull case of 8.9% and a bear case of 6.5%. The historical rate from 2020 to 2025 was 6.3%, spanning a collapse and a sharp recovery.

Which segment is growing fastest?

Wind farm service operation vessels at 11.55%, exactly 1.50 times the market rate. Their charters attach to specific operating wind farms for multiple years rather than following project work.

Who are the major companies in the Offshore Support Vessels Market?

Tidewater, Edison Chouest Offshore, Bourbon Maritime, Vroon Offshore, and DOF Group lead on vessel days chartered. The top five hold only 23%, after a decade in which predicted consolidation never arrived.

Which country is growing fastest?

India at 10.2%, where offshore wind leasing is beginning while oil and gas support demand continues. Domestic tonnage is limited, so international owners serve much of the requirement currently.

Report Segmentation Architecture

The full report scope spans multiple orthogonal segmentation dimensions, with cross-tabulated demand data provided for each dimension pair. Coverage extends further to regional breakdowns, trend trajectories, and the competitive detail needed to support segment-level decision-making.

By Vessel Class And Work Performed

  • Platform Supply Vessels
  • Anchor Handling Tug Supply Vessels
  • Wind Farm Service Operation Vessels
  • Crew Transfer And Personnel Logistics Vessels
  • Subsea Construction And Dive Support Vessels

By End-Use Industry

  • Deepwater Oil And Gas Development
  • Shallow Water Production Support
  • Offshore Wind Construction And Maintenance
  • Subsea Infrastructure And Cable Work
  • Decommissioning And Well Abandonment

By Commercial Model

  • Spot And Short-Term Fixtures
  • Term Charters Of One To Three Years
  • Multi-Year Asset-Attached Service Contracts
  • Bareboat And Vessel Leasing Arrangements
  • Vessel Management For Third Party Owners

By Region

  • Western Europe
  • Middle East and Africa
  • East Asia
  • Latin America
  • North America
  • South Asia and Pacific
  • Eastern Europe

Scope, Methodology, and Coverage

Every figure in this report is reproducible from documented input assumptions. The scope below maps the historical period, the forecast horizon, the segmentation dimensions, and the countries covered, alongside the underlying primary and qualitative methodology.
Historical Period
2020 to 2025
Forecast Period
2026 to 2036
Base Year
2025 (USD billions; MMA Primary Research Dataset, August 2026)
Market Definition
This market comprises the chartering and commercial operation of offshore support vessels serving energy production, offshore wind, and marine infrastructure activity, measured at charter and operating revenue across spot, term, and long-term contract structures. Coverage spans platform supply vessels, anchor handling tug supply vessels, wind farm service operation vessels, crew transfer and personnel logistics vessels, and subsea construction and dive support vessels within support vessel classes. Drilling rigs, drillships and jack-up units, heavy lift and turbine installation vessels above support vessel classes, seismic survey vessels, port and harbour tugs operating exclusively inshore, cable laying vessels, and vessel construction and shipbuilding activity fall outside scope.
Quantitative Units
USD billions (current prices); vessel days chartered annually; fleet size and average age by class; utilisation and day rates by region
Segmentation Dimensions
By Vessel Class And Work Performed; By End-Use Industry; By Commercial Model; By Region
Regions Covered
Western Europe, Middle East and Africa, East Asia, Latin America, North America, South Asia and Pacific, Eastern Europe
Countries Covered
Norway, United Kingdom, Netherlands, Denmark, Germany, France, Saudi Arabia, United Arab Emirates, Qatar, Nigeria, Angola, Ghana, China, Malaysia, Vietnam, Indonesia, Brazil, Guyana, Mexico, United States, India, Australia, Singapore, Poland, and additional markets relevant to this sector
Key Companies Profiled
Tidewater, Edison Chouest Offshore, Bourbon Maritime, Vroon Offshore, DOF Group, Solstad Offshore, Havila Shipping, Siem Offshore, Maersk Supply Service, SEACOR Marine, Vallianz Holdings, POSH Semco, Nam Cheong, Great Eastern Shipping, Cadeler, Esvagt, North Star Shipping, Louis Dreyfus Armateurs, Rem Offshore, Britoil Offshore Services
Quantitative Methodology
Primary survey, n=3,800 respondents, Q4 2025, six countries; demand-side model with trade association cross-validation
Qualitative Methodology
47 expert interviews, Q4 2025; applied to validate demand model assumptions, identify emerging dynamics, and assess competitive positioning
Report Format
PDF and XLSX data workbook (Word format preview document)
Publisher
Market Minds Advisory
Report Code
MMA-2026-ENE-749
Published
August 2026
Contact
sales@marketmindsadvisory.com | www.marketmindsadvisory.com

Purchase the full Offshore Support Vessels Market Premium Report Report (2026 to 2036).

The full report sizes offshore support vessels across five vessel classes, five end-use industries, five commercial models, and seven regions, with fleet age and composition analysed by class and owner throughout. Newbuild ordering is tracked against delivery lag and charter coverage, since the three-year gap between order and service governs every cycle this sector has experienced. Charter duration is compared across oil and gas and wind operators. Competitive profiling covers twenty owners on vessel days chartered, and crew availability is assessed against operating cost exposure.
Fleet age and composition analysed by vessel class and owner
Newbuild ordering tracked against delivery lag and charter coverage
Charter duration compared across oil, gas, and wind operators
Crew availability assessed against operating cost and wage exposure
Retrofit economics modelled against hull condition rather than vessel age
Regional cabotage and local content rules mapped by market

Built For The People Who Decide

From boardroom strategy to bench-side execution, this report is read cover-to-cover by leaders shaping the next decade of their industry, turning demand scenarios, market dynamics and valuation benchmarks into decisions.
CXOs/ Presidents/ VPs/ Managers
M&A and Corporate Development
Strategy Teams and R&D Heads
Procurement and Product Directors
Regulatory and Compliance Leaders
Investor Relations and Equity Analysts