Market Minds Advisory
Offshore EPC Services Market

Offshore EPC Services Market: Lump Sum Contracting Against Costs Nobody Controls

Contractors are signing fixed price offshore work on schedules stretching past three years, against vessel rates, steel prices, and yard slots that none of them can lock in for anything close to that long.

Lead Analyst

David Horsley

Published

August 2026

Make Smarter Decisions with Customized Research Insights

Request a free sample report and evaluate market opportunities, growth trends, and competitive dynamics relevant to your business needs.

2025 MARKET VALUE$72.0BMarket Size 2025
2036 FORECAST VALUE$154.7BBase Case , 2026 to 2036
CAGR 2026 TO 20367.2 %Bull 8.5% / Bear 6.0%
INCREMENTAL OPPORTUNITY$77.5BNet 10- year value creation
EXPANSION MULTIPLE2.00x2036 value over 2026 base
Strategic Levers
M&A Pipeline
Regional Outlook
Country Rankings
Competitive Intelligence
Segmental Deep-dive
Call-Us : 91 93563 13602

Executive Snapshot and Market Trajectory

Roughly 58% of offshore awards are lump sum, and the average project runs 42 months from award to first production. Contractors are therefore holding fixed prices against vessel rates, steel costs, and yard availability across a period none of them can hedge properly. Negotiating positions have moved accordingly.
Growth runs at 7.2% and offshore wind leads it. Foundation and substation EPC grows at 10.8%, exactly 1.50 times the market rate, and renewables now account for around 23% of awards rather than being a side business. Middle East and Africa holds 26%, far outside band, because Saudi and Emirati offshore programmes are the largest single source of fixed platform work anywhere in the world.
Concentration is low at 34% across the top five measured on awarded contract value, and regional yards hold strong local positions that global contractors cannot dislodge on price. Fabrication capacity rather than engineering capability is the binding constraint now, with qualified yards running above 80% utilisation and clients queuing for slots that were freely available five years ago. Several contractors wrote off entire projects learning this, and the lesson has not held.
Market Definition
This market covers engineering, procurement, construction, and installation services delivered for offshore energy assets, spanning fixed platform EPC, floating production systems EPC, subsea infrastructure and pipeline EPC, offshore wind foundation and substation EPC, and decommissioning and removal. Onshore terminals and processing facilities, drilling services and rigs, vessel chartering contracted separately from EPC scope, offshore wind turbine supply, subsea equipment manufactured for third-party integration, and operations and maintenance contracts fall outside scope.
Base Year Value
$72.0B in 2025 (MMA Primary Research Dataset, August 2026)
Forecast Period
2026 to 2036, eleven discrete annual values
CAGR
7.2% base case. Bull 8.5%. Bear 6.0%.
Fastest Growth Segment
Offshore Wind Foundations and Substations EPC: 10.8% CAGR
Fastest Growth Country
India: 9.8% CAGR
Fastest Growth Region
South Asia and Pacific: 9.2% CAGR
Largest Region
Middle East and Africa: 26% of 2025 global value
Market Leaders
Saipem, TechnipFMC, Subsea7, McDermott International, Aker Solutions. Source: MMA Analysis based on company annual reports.
Primary Survey
n=3,800 procurement and R&D decision-makers, Q4 2025, six countries
Methodology
Demand-side build-up, cross-validated against public data, 47 expert interviews

Offshore EPC Services Market Forecast Scenarios

offshore-epc-services-market-size-forecast-scenario-1787302729127
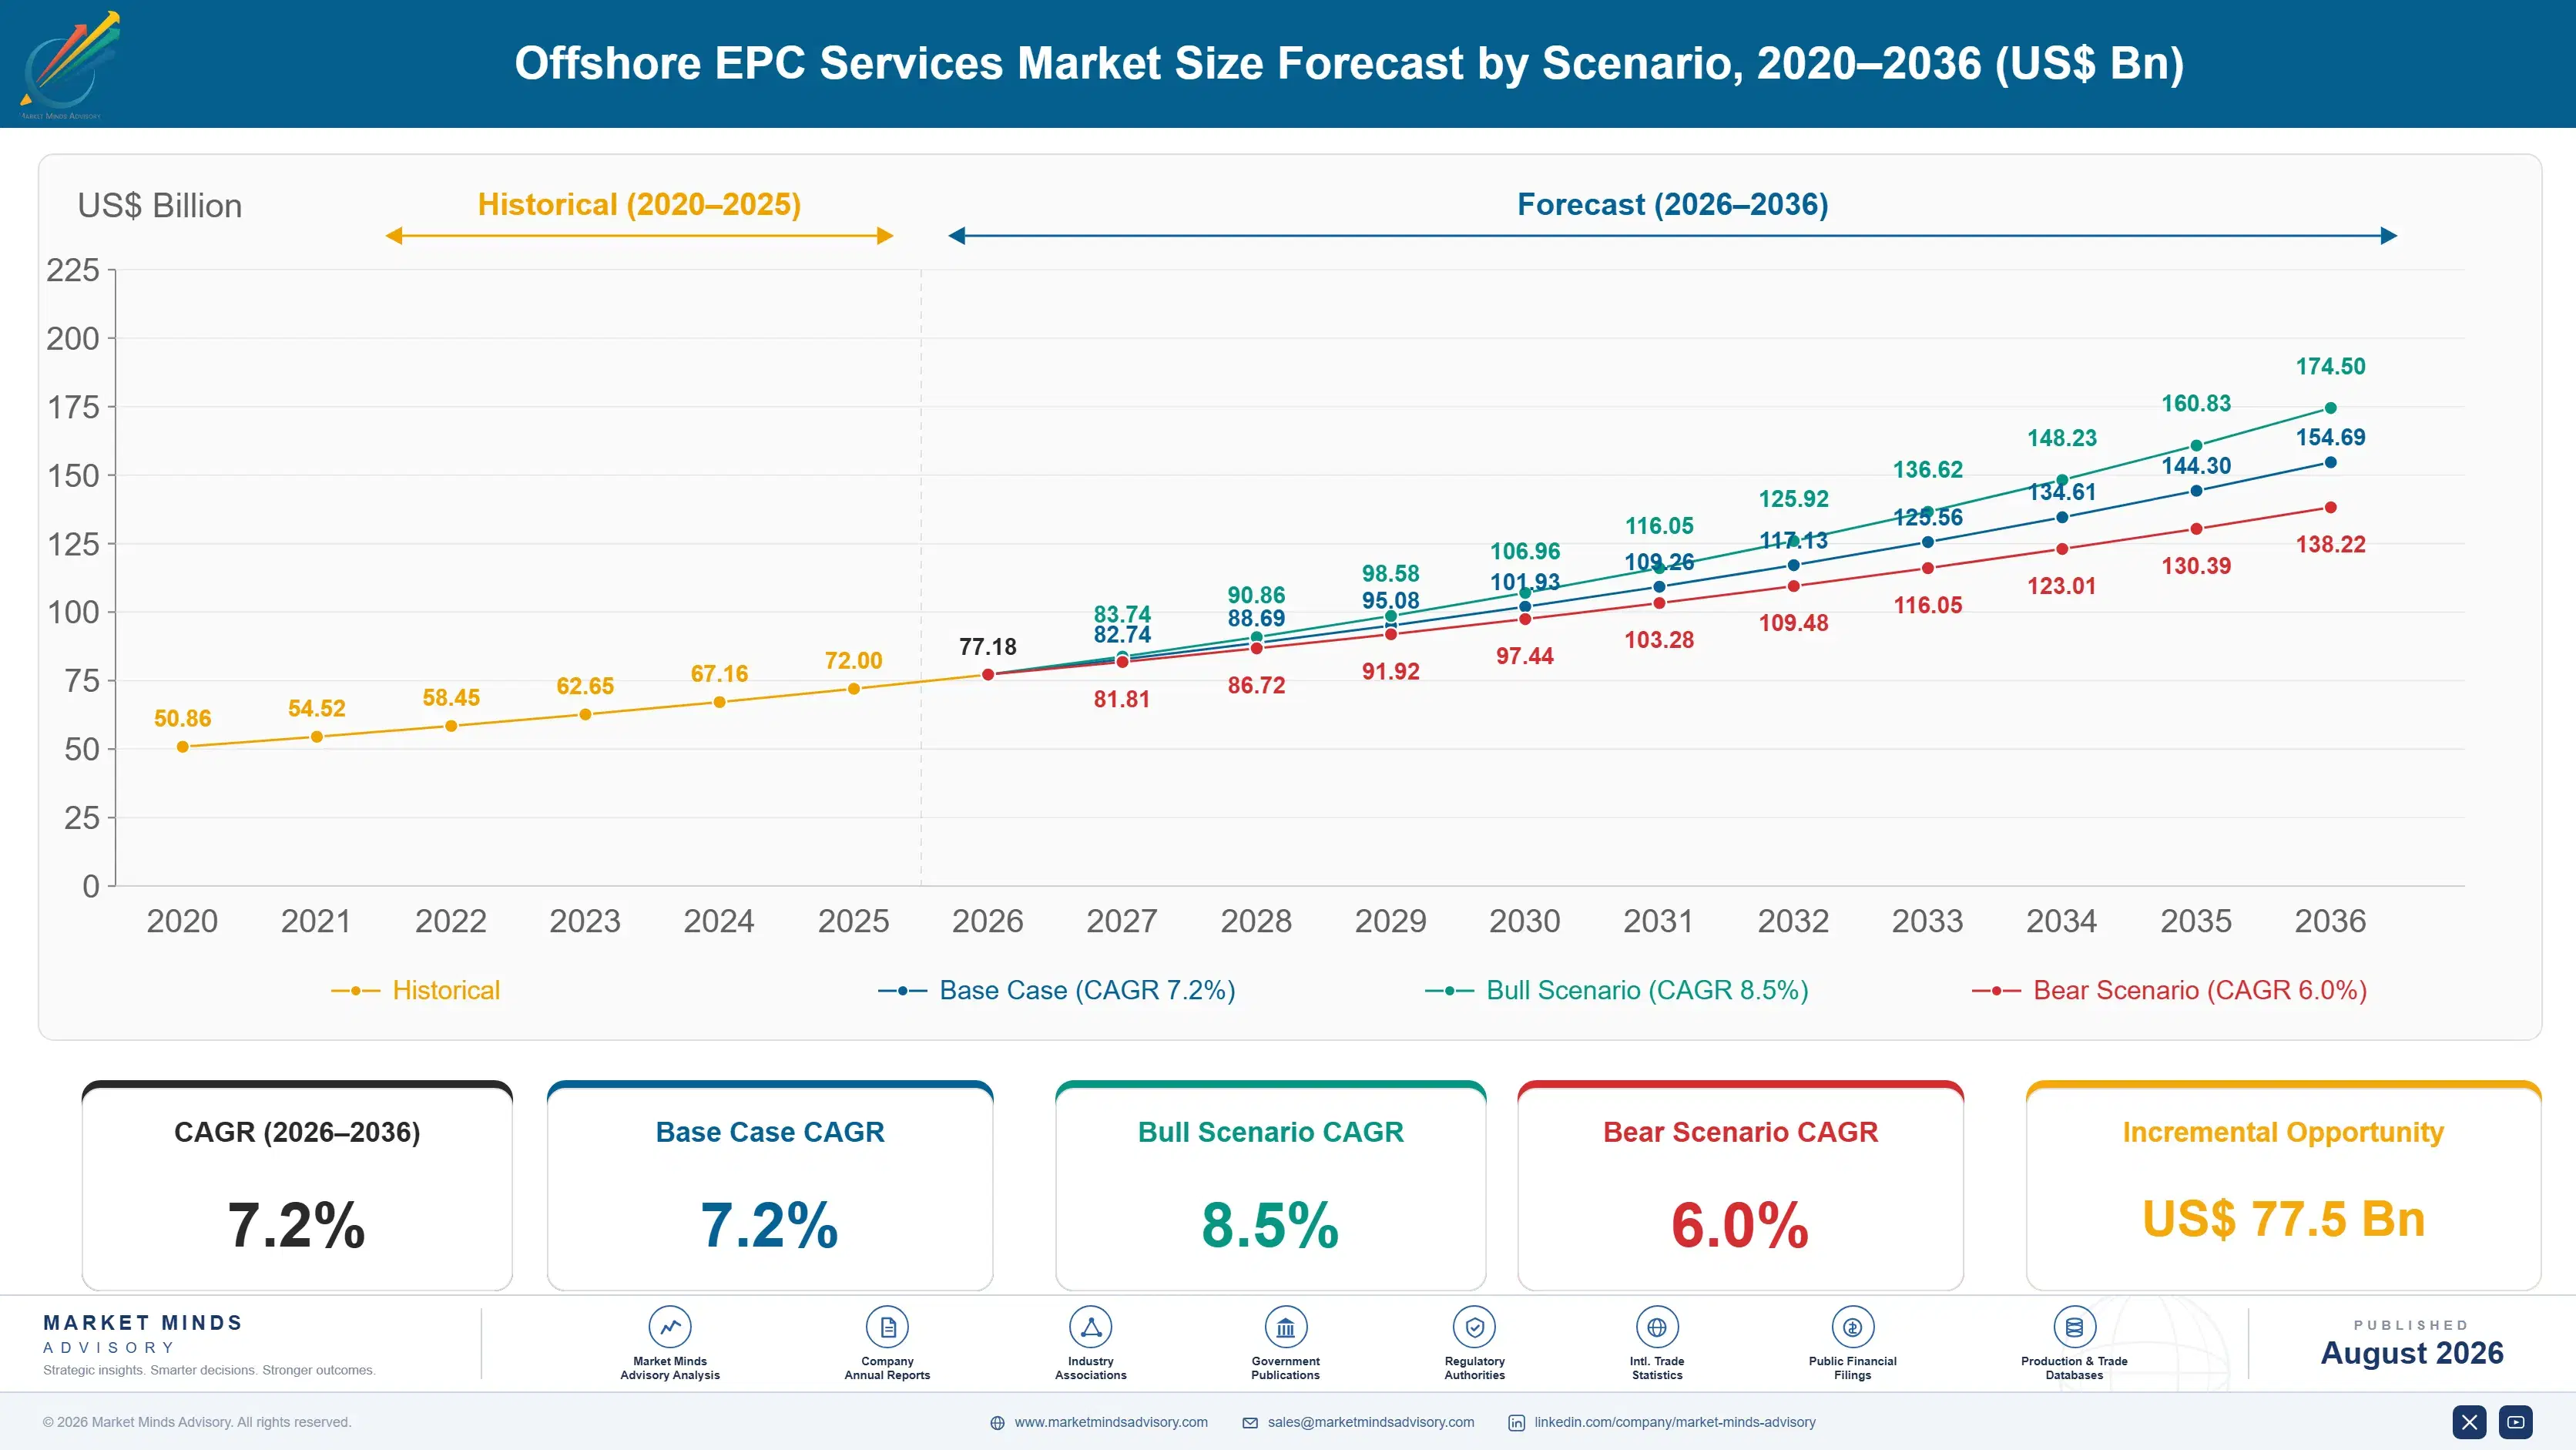
The 2020 to 2025 period ran at 5.9% and the composition changed more than the rate suggests. Offshore oil and gas awards collapsed in 2020 and 2021, then recovered strongly from 2022 as Middle Eastern and Brazilian programmes committed. Offshore wind grew throughout, though several developers cancelled or repriced projects in 2023 and 2024 when interest rates and turbine costs moved against them.
Three mechanisms carry the 7.2% base case. Middle Eastern offshore expansion is the largest, since Saudi and Emirati programmes are funded through the forecast period rather than sanctioned project by project. Brazilian floating production is the second, with a pipeline of units that yards have already been contracted against. And offshore wind foundation work is the third, growing at 10.8% as European and Asian buildouts proceed. Decommissioning adds scope beneath all three.
The 8.5% bull case rests on floating offshore wind reaching commercial scale, which would add foundation and mooring work to a supply base already tight on fabrication. The 6.0% bear case is a sustained oil price fall deferring sanction across several national programmes at once, since offshore projects are the first capital deferred and the slowest to restart afterwards.

Fixed Prices, Moving Costs

Offshore EPC is a business of holding prices against costs nobody controls. Roughly 58% of awards are lump sum, projects average 42 months from award to first production, and the contractor absorbs vessel rates, steel pricing, subcontractor labour, and weather across the whole of it. Clients like the risk transfer, and the industry has repeatedly proven it cannot price the risk it accepts.
TOP FIVE CONCENTRATION34%Fragmented, with regional yards holding strong local award positions
LUMP SUM CONTRACT SHARE58%Of awards carrying full cost overrun exposure for contractors
TYPICAL PROJECT DURATION42 monthsFrom award through to first production or grid connection
FABRICATION YARD UTILISATION81%Across the qualified yards able to take large work
OFFSHORE WIND AWARD SHARE23%Of total awards now coming from renewables rather than hydrocarbons
VESSEL RATE INDEX2.4 timesAbove the trough recorded during the last downturn period
The binding constraint shifted from engineering to fabrication. Qualified yards capable of taking large jackets, hulls, or topsides run above 80% utilisation, and clients now queue for slots that were freely available five years ago. That has changed negotiating positions considerably: a contractor with secured yard capacity holds something the client genuinely needs, which was not true through the previous decade at all.
Concentration at 34% understates how differently the segments behave. Regional yards win local fixed platform work on cost and proximity, and global contractors cannot dislodge them. Deepwater subsea installation and floating production integration are different: vessel fleets, engineering depth, and track record narrow the field considerably, and that is where the leaders actually earn their positions. Prequalification lists there are the shortest in the industry and rarely reopened.
"The industry keeps signing lump sum contracts and then discovering it cannot price weather, vessel availability, or steel three years out. Everybody knows this. They sign anyway, because the client asked and somebody else would have."
Director, Offshore Energy and Marine Construction Practice · MMA Energy Engineer

Market Trends

Offshore Wind Becomes A Core Rather Than Adjacent Business

Foundation, substation, and cable installation work for offshore wind now accounts for around 23% of awards and grows at 10.8% against 7.2% for the market. Contractors that treated it as diversification are finding it competes directly for the same vessels, yards, and engineering staff as oil and gas work. Several have had to choose between the two on specific projects, which was not a decision anybody expected to face this early. Utility and infrastructure fund clients contract differently from oil companies too. Financing structure shapes the schedule. Weather windows come second.
Market Impact: Programmes span more than 5 years
Fabrication Capacity Replaces Engineering As Binding Constraint

Qualified yards run above 80% utilisation and clients queue for slots that were freely available five years ago, which reverses the negotiating position that held through the previous decade. A contractor with secured yard capacity now holds something the client genuinely needs. Yard expansion is slow, capital intensive, and nobody wants to build it against a cycle that has burned investors twice before, so the tightness persists. Option payments for slot reservation are small against liquidated damages for late delivery. That calculation has reversed completely. Few bid teams have adjusted.
Market Impact: Projects run about 42 months

Market Opportunities and Growth Drivers

Middle Eastern Programmes Are Funded Through The Decade

Saudi Aramco and ADNOC offshore expansion is committed and funded across multi-year programmes rather than sanctioned field by field, which gives contractors visibility that no other region provides. Those programmes issue work in packages on published schedules, and the volume of fixed platform and pipeline EPC involved exceeds any other single source globally. National content requirements shape who wins it, but the spending itself is considerably more predictable than elsewhere. Package sequencing lets contractors plan vessel and engineering deployment years ahead. Nowhere else offers that. Field-by-field sanctioning never has. Visibility of that kind is rare.
Market Impact: Lump sum is 58% of awards

Brazilian Floating Production Pipeline Is Already Contracted

Petrobras and its partners have a sequence of floating production units contracted against yard slots years in advance, which turns a project business into something closer to a production programme. Hull fabrication, topside integration, and subsea tie-back work all follow on schedules published well ahead. That predictability is unusual offshore and it lets contractors plan vessel and engineering deployment rather than chasing awards reactively. Guyana has added deepwater subsea and floating production work at pace since first oil, extending the same regional pipeline further. Yard slots there are contracted well into the next decade.
Market Impact: Vessel rates sit 2.4 times higher

Market Restraints and Challenges

Lump Sum Exposure Destroys Contractor Margin Repeatedly

Roughly 58% of awards are lump sum across projects averaging 42 months, and the root cause is that clients transfer cost risk the contractor cannot hedge, since vessel rates, steel, and weather have no forward market at that horizon. Commercial impact is write-offs large enough to consume several years of profit on a single project. Mitigation runs through reimbursable and hybrid contract structures, escalation clauses tied to published indices, and simply declining work priced below defensible risk. Order book pressure makes that discipline hardest exactly when it matters most. Competitors declining the same tenders is a pricing signal.
Market Impact: Wind is 23% of awards

Vessel Availability Constrains Installation Scheduling Badly

Heavy lift and cable installation vessel day rates sit around 2.4 times their downturn trough, and the root cause is a fleet built for the previous cycle now serving both oil and gas and offshore wind simultaneously. Commercial impact is schedule risk on projects where the contractor carries liquidated damages. Mitigation runs through long-term vessel charters taken before award, alliances with vessel owners, and sequencing campaigns so one mobilisation serves several projects. Fleet expansion is slow and nobody wants to build against a cycle that has burned investors twice. Tightness therefore persists. Rates have not returned to trough levels.
Market Impact: Yards run above 81% utilisation
4 additional market trends, 3 additional growth drivers, and 2 additional restraints and challenges are covered in the full report. Contact sales@marketmindsadvisory.com to access the complete intelligence.

Segment CAGR and Growth Architecture

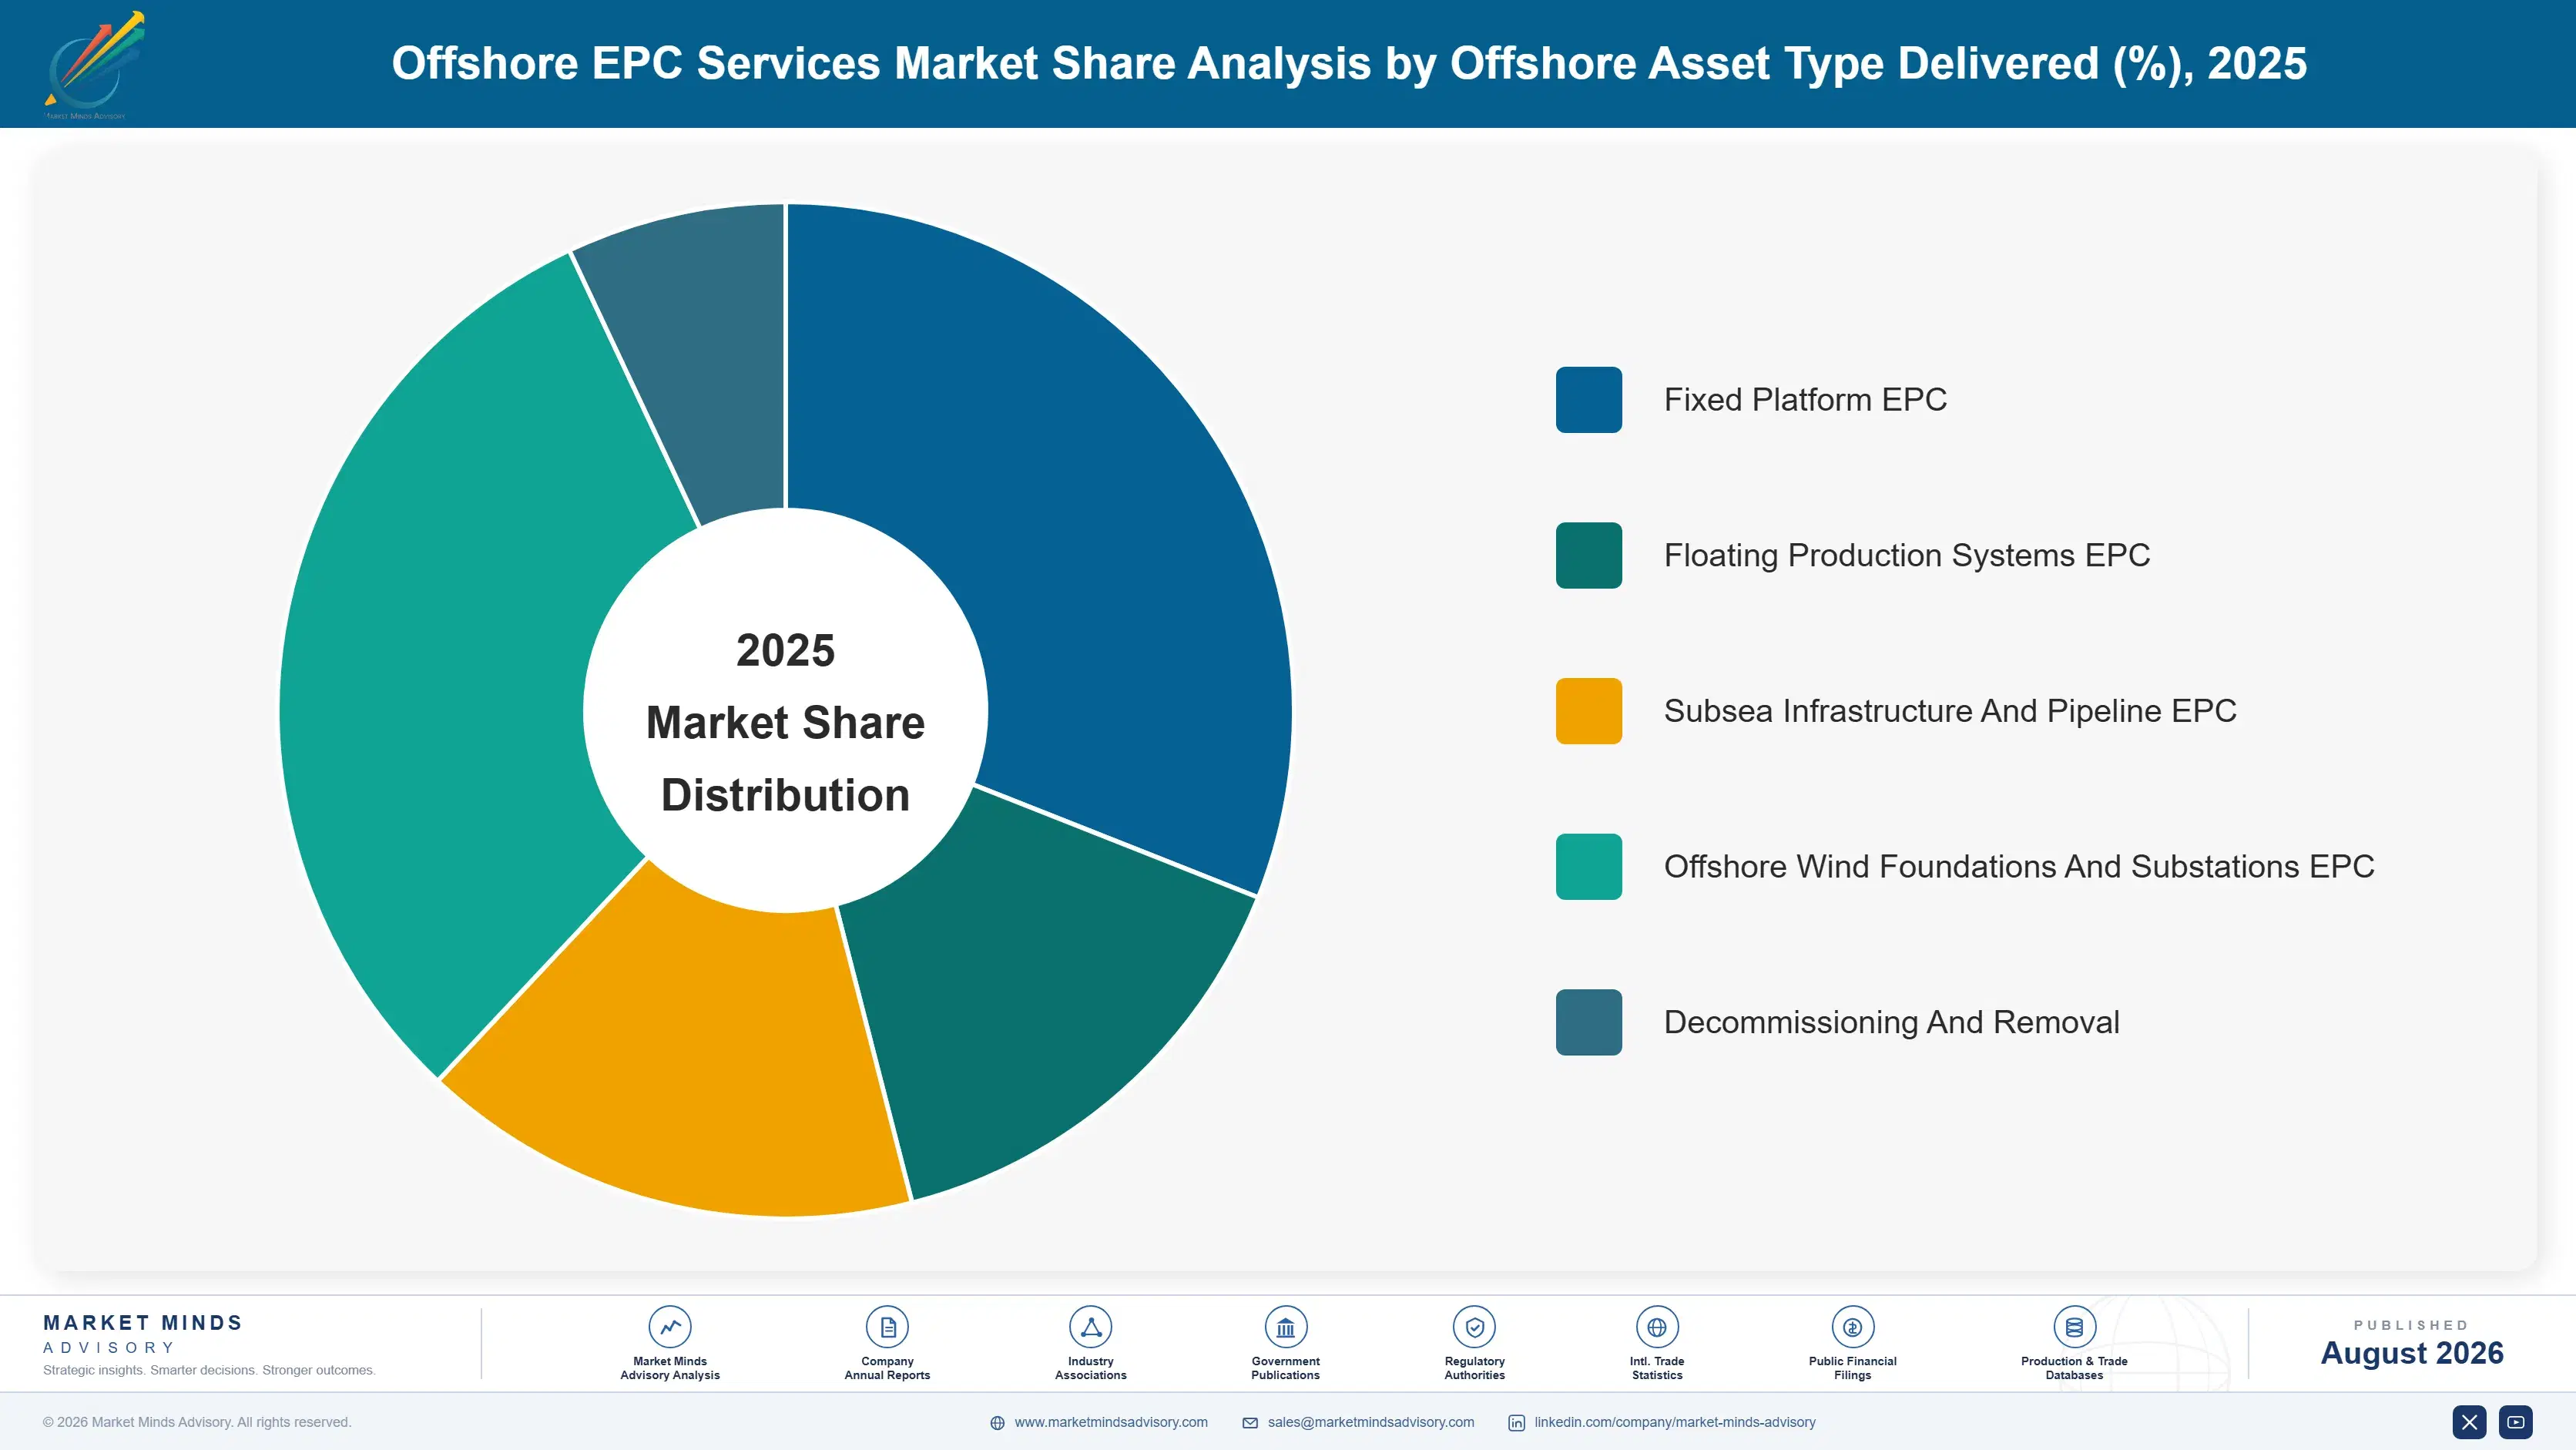
Segmentation follows the offshore asset type delivered, because that determines engineering scope, fabrication requirement, vessel spread, and which contractors can credibly bid the work at all. Water depth and client type both cut across every asset type rather than separating them cleanly, which makes either a weaker primary dimension for this market. Asset type is what the client actually tenders.
offshore-epc-services-market-market-share-analysis-1787302729739

Offshore Wind Foundations And Substations EPC

The fastest asset type at 10.8%, exactly 1.50 times the market rate, covering monopile and jacket foundation fabrication and installation alongside offshore substation platforms. Around 23% of awards now come from this work rather than hydrocarbons. The engineering is simpler than floating production and the volumes are far larger, which suits yards more than it suits engineering-led contractors. Installation vessel availability is the practical constraint, since the same heavy lift and cable spreads serve oil and gas work and the fleet was built for neither at this volume. Utility and infrastructure fund clients dominate the tendering here, and their contracting philosophy is considerably less settled than an oil company's. Financing structure shapes the schedule.
CAGR 10.8%

Floating Production Systems EPC

Second fastest at 8.9%, covering hull fabrication, topside modules, and integration for floating production, storage, and offloading units. Brazil dominates the current order book, with units contracted against yard slots years ahead, which makes this the most predictable offshore work anywhere. Integration is where projects fail: topside modules built across several yards must fit a hull built somewhere else entirely, and interface management is what separates contractors who deliver on schedule from those explaining delays. Margins are better than fixed platform work and the execution risk is considerably higher. Clients pay for a contractor that has demonstrably completed the integration before rather than one that says it can. Track record does most of the selling.
CAGR 8.9%
Full segment breakdown across 5 segments available in the complete report.

Regional Architecture and Country Demand Map

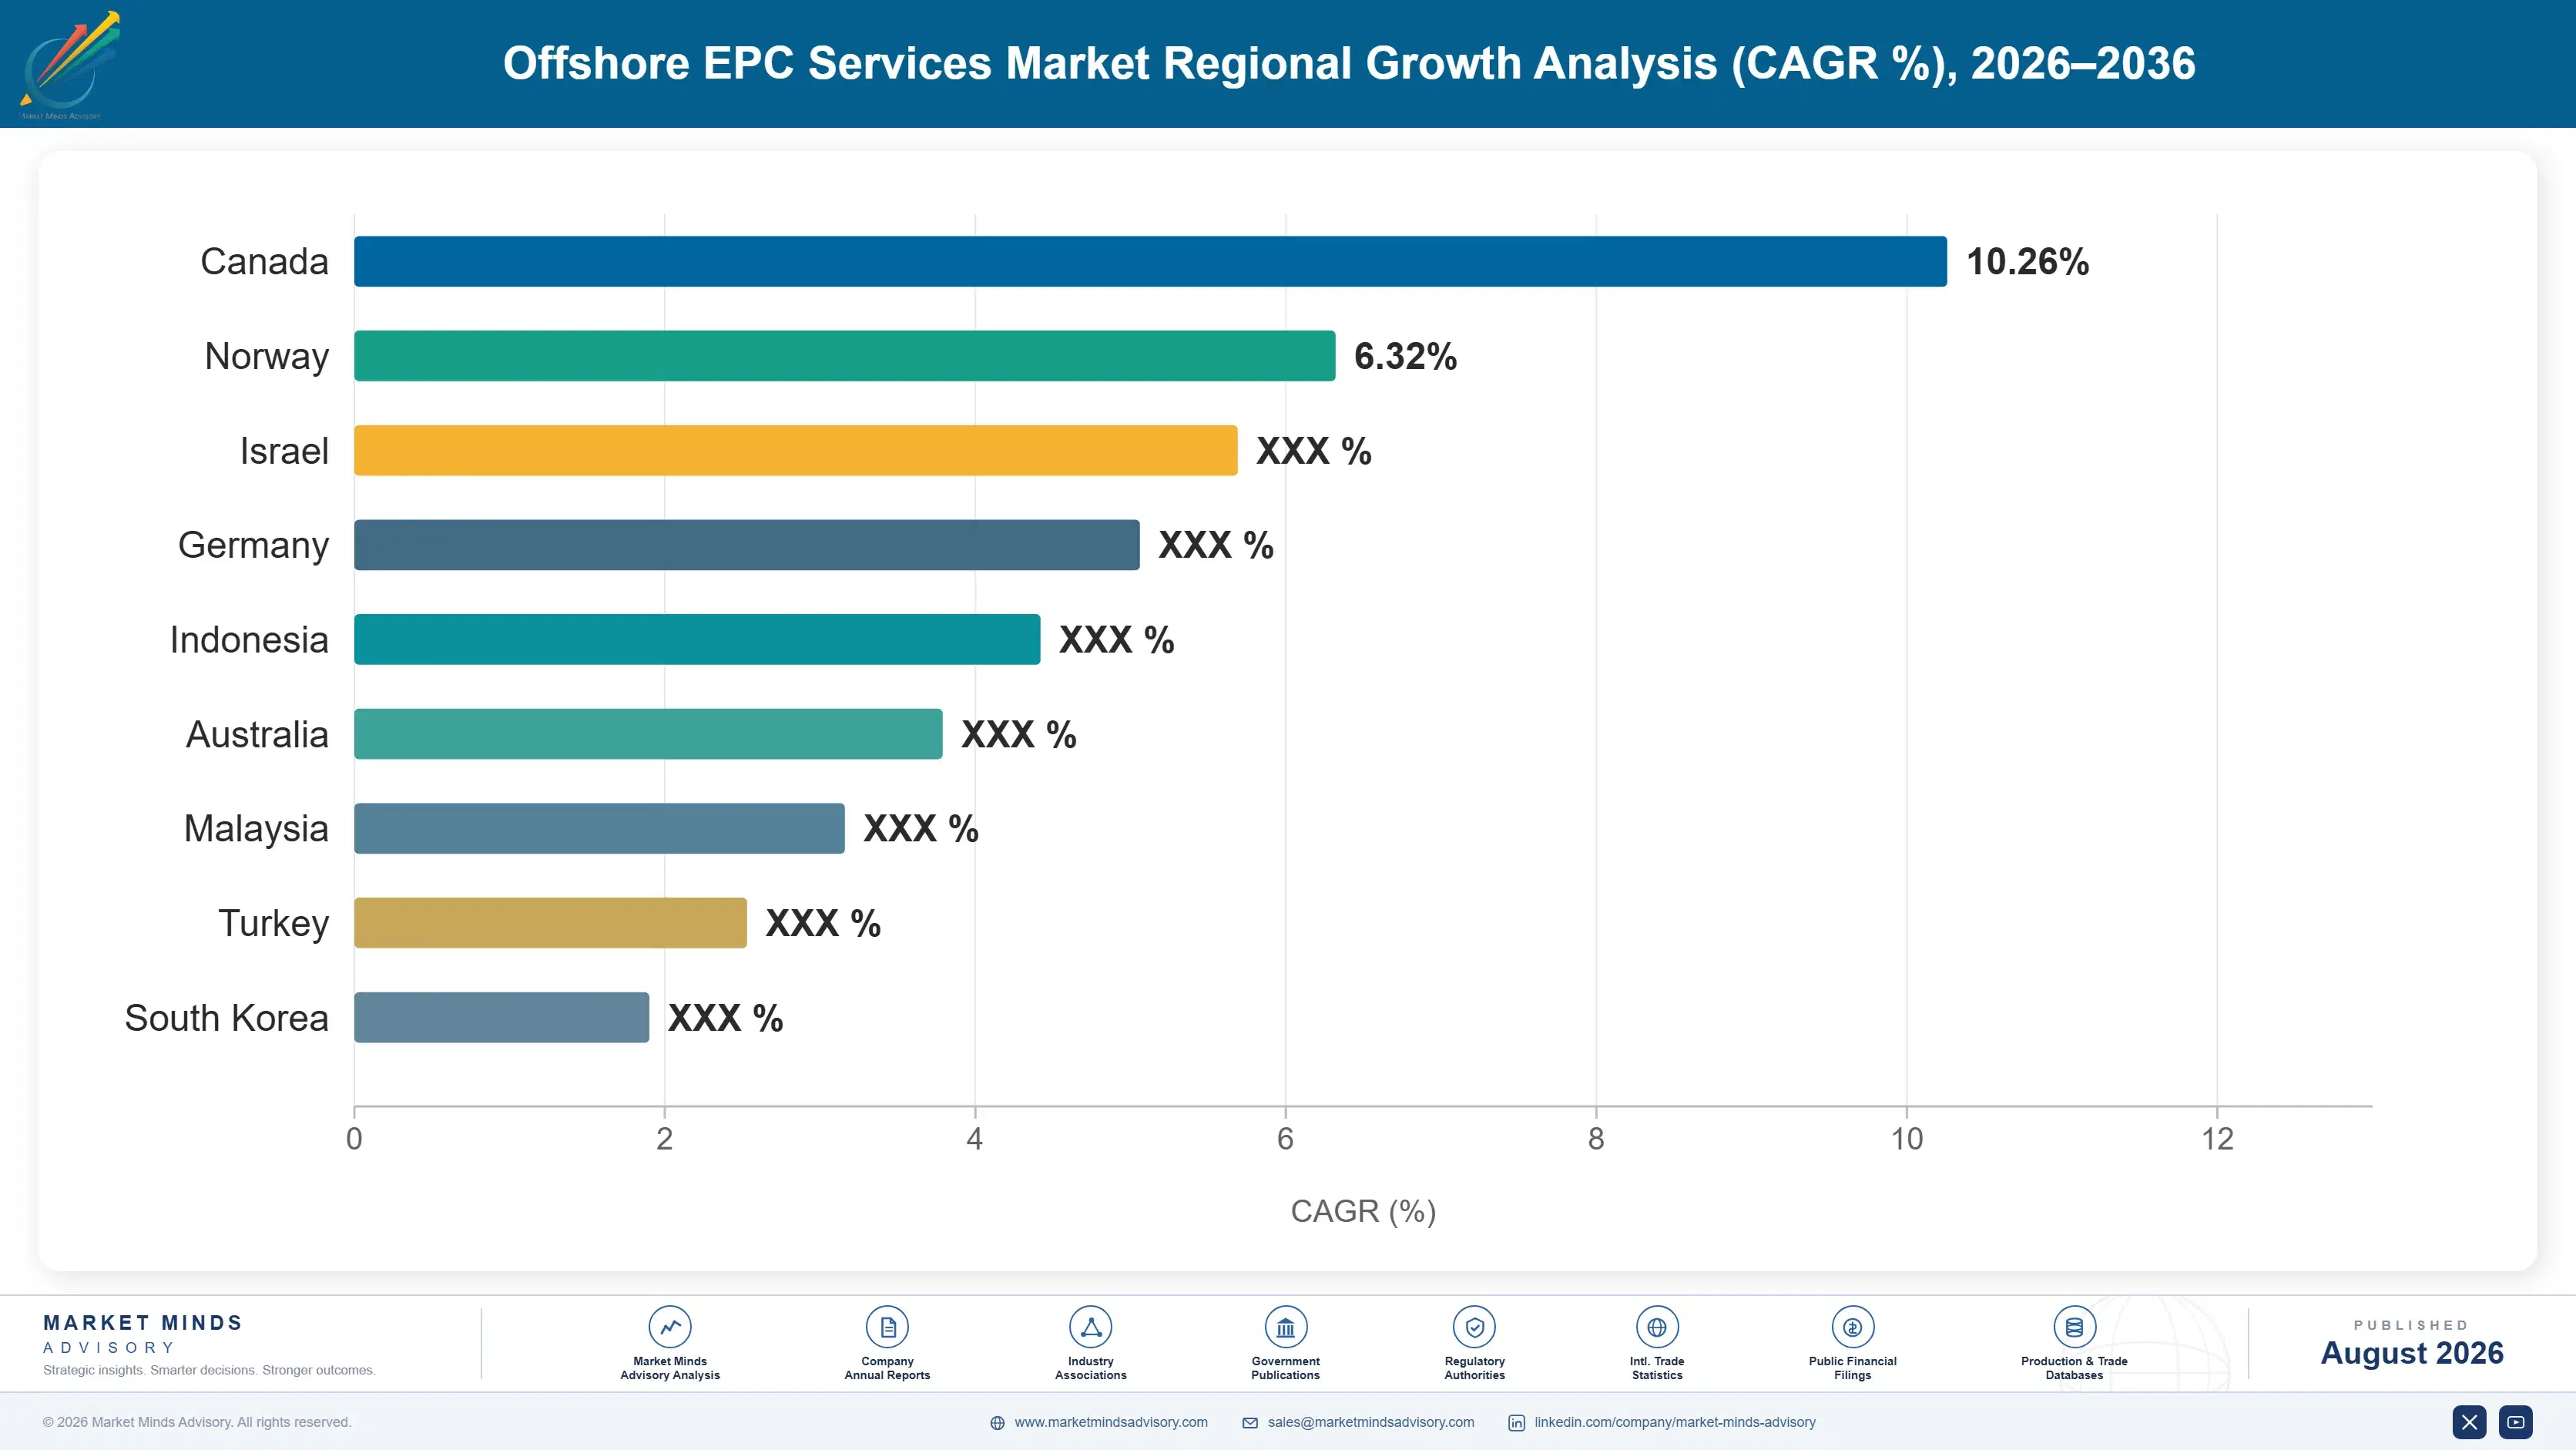
Middle East and Africa leads at 26%, far outside band, because Saudi and Emirati offshore programmes are the largest source of fixed platform work anywhere. East Asia and Latin America follow. India grows fastest. Five regional shares sit outside their framework bands. Offshore basin geography explains every one.

Middle East and Africa

Twenty-six percent, far outside the framework band, and justified because Saudi Aramco and ADNOC offshore expansion together represent the largest committed fixed platform and pipeline programme anywhere in the world. Those programmes issue packaged work on published multi-year schedules, which gives contractors visibility no other region offers. West African deepwater in Angola and Nigeria adds technically harder work at lower volume, and Mozambique gas is beginning to contribute. Growth at 7.5% sits close to the market rate, reflecting a programme that is large and steady rather than accelerating. National content requirements shape who wins the work more than technical differentiation does, which favours contractors with established local fabrication and joint operating arrangements. Global contractors bid through those arrangements.
Share: 26% | CAGR: 7.5% (2026 to 2036)

East Asia

Twenty percent, below the framework band because offshore work follows basins rather than industrial output, and Chinese offshore wind alongside CNOOC's Bohai and South China Sea development carries nearly all of it. China installs more offshore wind foundation capacity annually than any other country, served almost entirely by domestic yards and vessels. Korean and Japanese yards fabricate for export rather than for domestic offshore work. Growth at 8.5% runs above the market rate, driven by offshore wind buildout more than by hydrocarbon development. Chinese contractors rarely bid outside the region, so the domestic scale does not translate into global award share the way the tonnage might suggest. Vessel fleets there are largely domestic too.
Share: 20% | CAGR: 8.5% (2026 to 2036)
Regional intelligence for 5 additional markets available in the complete report: Latin America, Western Europe, South Asia and Pacific, North America, Eastern Europe. Contact sales@marketmindsadvisory.com.
offshore-epc-services-market-country-cagr-analysis-1787302730259

Contract Structure Beats Bid Price

Lump sum contracting covers 58% of awards, projects run 42 months, yards operate above 80% utilisation, and offshore wind is 23% of work. Value comes from contract structure discipline, from secured fabrication and vessel capacity, and from choosing which work to decline. Bid price decides considerably less than any of them. All three compound together.

Decline Lump Sum Work Priced Below Defensible Risk

Roughly 58% of awards are lump sum across projects averaging 42 months, and vessel rates, steel, and weather have no forward market at that horizon. Contractors have written off more than a year of group profit on single projects taken at prices that looked competitive at bid. The discipline to decline work is worth more than any estimating improvement, and it is the hardest thing to hold when the order book looks thin. Two competitors declining the same tender is a pricing signal rather than competitive weakness. It is almost always read as the latter.
Market Impact: Lump sum covers roughly 58% of all

Secure Yard Slots Before Bidding Rather Than After

Qualified yards run above 80% utilisation and clients now queue for capacity, which reverses the position that held through the previous decade entirely. A contractor bidding without a secured slot is bidding a schedule it cannot control, and the liquidated damages sit on its own balance sheet rather than the yard's. Securing capacity ahead costs option money and buys the ability to bid credibly on schedule rather than only on price. Option payments for reservation are small against what late delivery actually costs on a large award. The calculation has reversed since the previous decade.
Market Impact: Qualified yards now operate above 8

Charter Installation Vessels Ahead Of Award Decisions

Heavy lift and cable installation day rates sit around 2.4 times their downturn trough because one fleet now serves both oil and gas and offshore wind. Spot chartering at bid stage prices a cost the contractor discovers later at whatever the market asks. Long-term charters and vessel owner alliances carry utilisation risk and remove the single largest uncontrolled cost in an installation campaign, which is the exposure that has destroyed the most margin. Vessel owner alliances achieve much of the same effect with considerably less balance sheet commitment involved. Either structure beats spot chartering at execution.
Market Impact: Vessel day rates run around 2.4 tim

Build Offshore Wind Capability Without Cannibalising Existing Work

Offshore wind is 23% of awards and grows at 10.8% against 7.2% for the market, but it competes for the same vessels, yards, and engineers as hydrocarbon work rather than using spare capacity. Contractors treating it as diversification have found themselves choosing between the two on specific projects. Capability has to be added rather than reallocated, and the contractors who understood that early are the ones bidding both without conflict. Foundation work is roughly 23% of awards and the vessels serving it are the same ones serving subsea campaigns. Spare capacity does not exist to absorb it.
Market Impact: Wind now covers about 23% of total

Who Controls the Margin Pool

Concentration is low at 34% across the top five measured on awarded contract value, and that headline hides two quite different competitive situations. Regional yards win local fixed platform and shallow water work on cost, proximity, and national content requirements that global contractors cannot overcome on price alone. Deepwater subsea installation and floating production integration are contested by a much narrower field, where vessel fleets and track record genuinely restrict who can bid.
Competitive activity runs on three fronts. Secured fabrication and vessel capacity is the first, and it now decides schedule credibility more than engineering depth does. Contract structure discipline is the second, since the contractors that survived the last cycle are those that declined work rather than those that estimated better. And offshore wind capability is the third, being built while hydrocarbon work still fills the order book.

Pressure arrives from two directions. Asian yards have moved from fabrication subcontracting into full EPC bidding, competing on cost with capability that is no longer materially behind. And clients are pushing more risk into lump sum structures as their own capital discipline tightens. Rankings shift on execution outcomes rather than on award volume.
offshore-epc-services-market-company-positioning-matrix-1787302730782

Competitive Moat and Risk Dimensions

SAIPEM

Moat: Owned installation vessel fleet

A large owned fleet of heavy lift, pipelay, and construction vessels removes the single largest uncontrolled cost in offshore installation and lets the contractor bid schedule with genuine confidence. Day rates sitting around 2.4 times their trough make that ownership considerably more valuable than it was through the previous decade. Fleet utilisation across projects compounds the advantage further.
SAIPEM

Risk: Historic lump sum loss exposure

Large lump sum projects have produced write-offs substantial enough to reshape the balance sheet, and roughly 58% of awards still carry that structure. Vessel ownership removes one cost risk while leaving steel, subcontractor labour, and weather fully exposed. Order book pressure makes declining underpriced work difficult precisely when discipline matters most.
TECHNIPFMC

Moat: Integrated subsea delivery model

Combining subsea equipment manufacture with installation lets a single contractor take integrated scope that would otherwise require managing interfaces between separate suppliers, which is where offshore projects most often fail. Clients pay for that interface removal because they have watched it go wrong. The manufacturing position also gives cost visibility that pure installation contractors do not hold.
TECHNIPFMC

Risk: Concentration in deepwater subsea

Weighting toward deepwater subsea ties the order book to a segment growing more slowly than offshore wind foundations, and sanction decisions there follow oil prices with little warning. Contractors spread across fixed platform and renewables work absorb that variation. Building offshore wind capability requires vessels and yards the subsea model does not already carry.

Players Tracked

Prominent Players

Saipem
TechnipFMC
Subsea7
McDermott International
Aker Solutions

Other Key Players

Petrofac
HD Hyundai Heavy Industries
Samsung Heavy Industries
Seatrium
COOEC
Larsen and Toubro
National Petroleum Construction Company
Van Oord
Boskalis
DEME
Jan De Nul
Allseas
Heerema Marine Contractors
Sapura Energy
Wood

Recent Developments

FEBRUARY 2025

Contractor declines offshore wind tender on pricing grounds

An offshore installation contractor withdrew from a large foundation installation tender, stating that the lump sum structure and schedule offered did not support defensible pricing against vessel and weather exposure. The withdrawal was a commercial bid decision rather than any dispute, disqualification, or capability constraint on the contractor's part.
Signal: Bid discipline is returning after a cycle
MAY 2025

Asian yard wins full EPC scope on regional platform

A Southeast Asian fabrication yard secured full engineering, procurement, and construction scope on an offshore platform award rather than the fabrication subcontract it would previously have taken. The award was a competitive tender outcome rather than any joint venture, acquisition, or partnership with an established EPC contractor.
Signal: Asian yards are moving up the value chain
AUGUST 2025

Contractor charters installation vessels ahead of award

An offshore contractor committed to multi-year heavy lift vessel charters before securing the projects those vessels would serve, accepting utilisation risk to remove day rate exposure from future bids. The commitment was a chartering decision rather than any vessel acquisition, joint venture, or alliance with the vessel owner.
Signal: Vessel cost exposure is now being removed

Vessels, Steel and Yard Hours

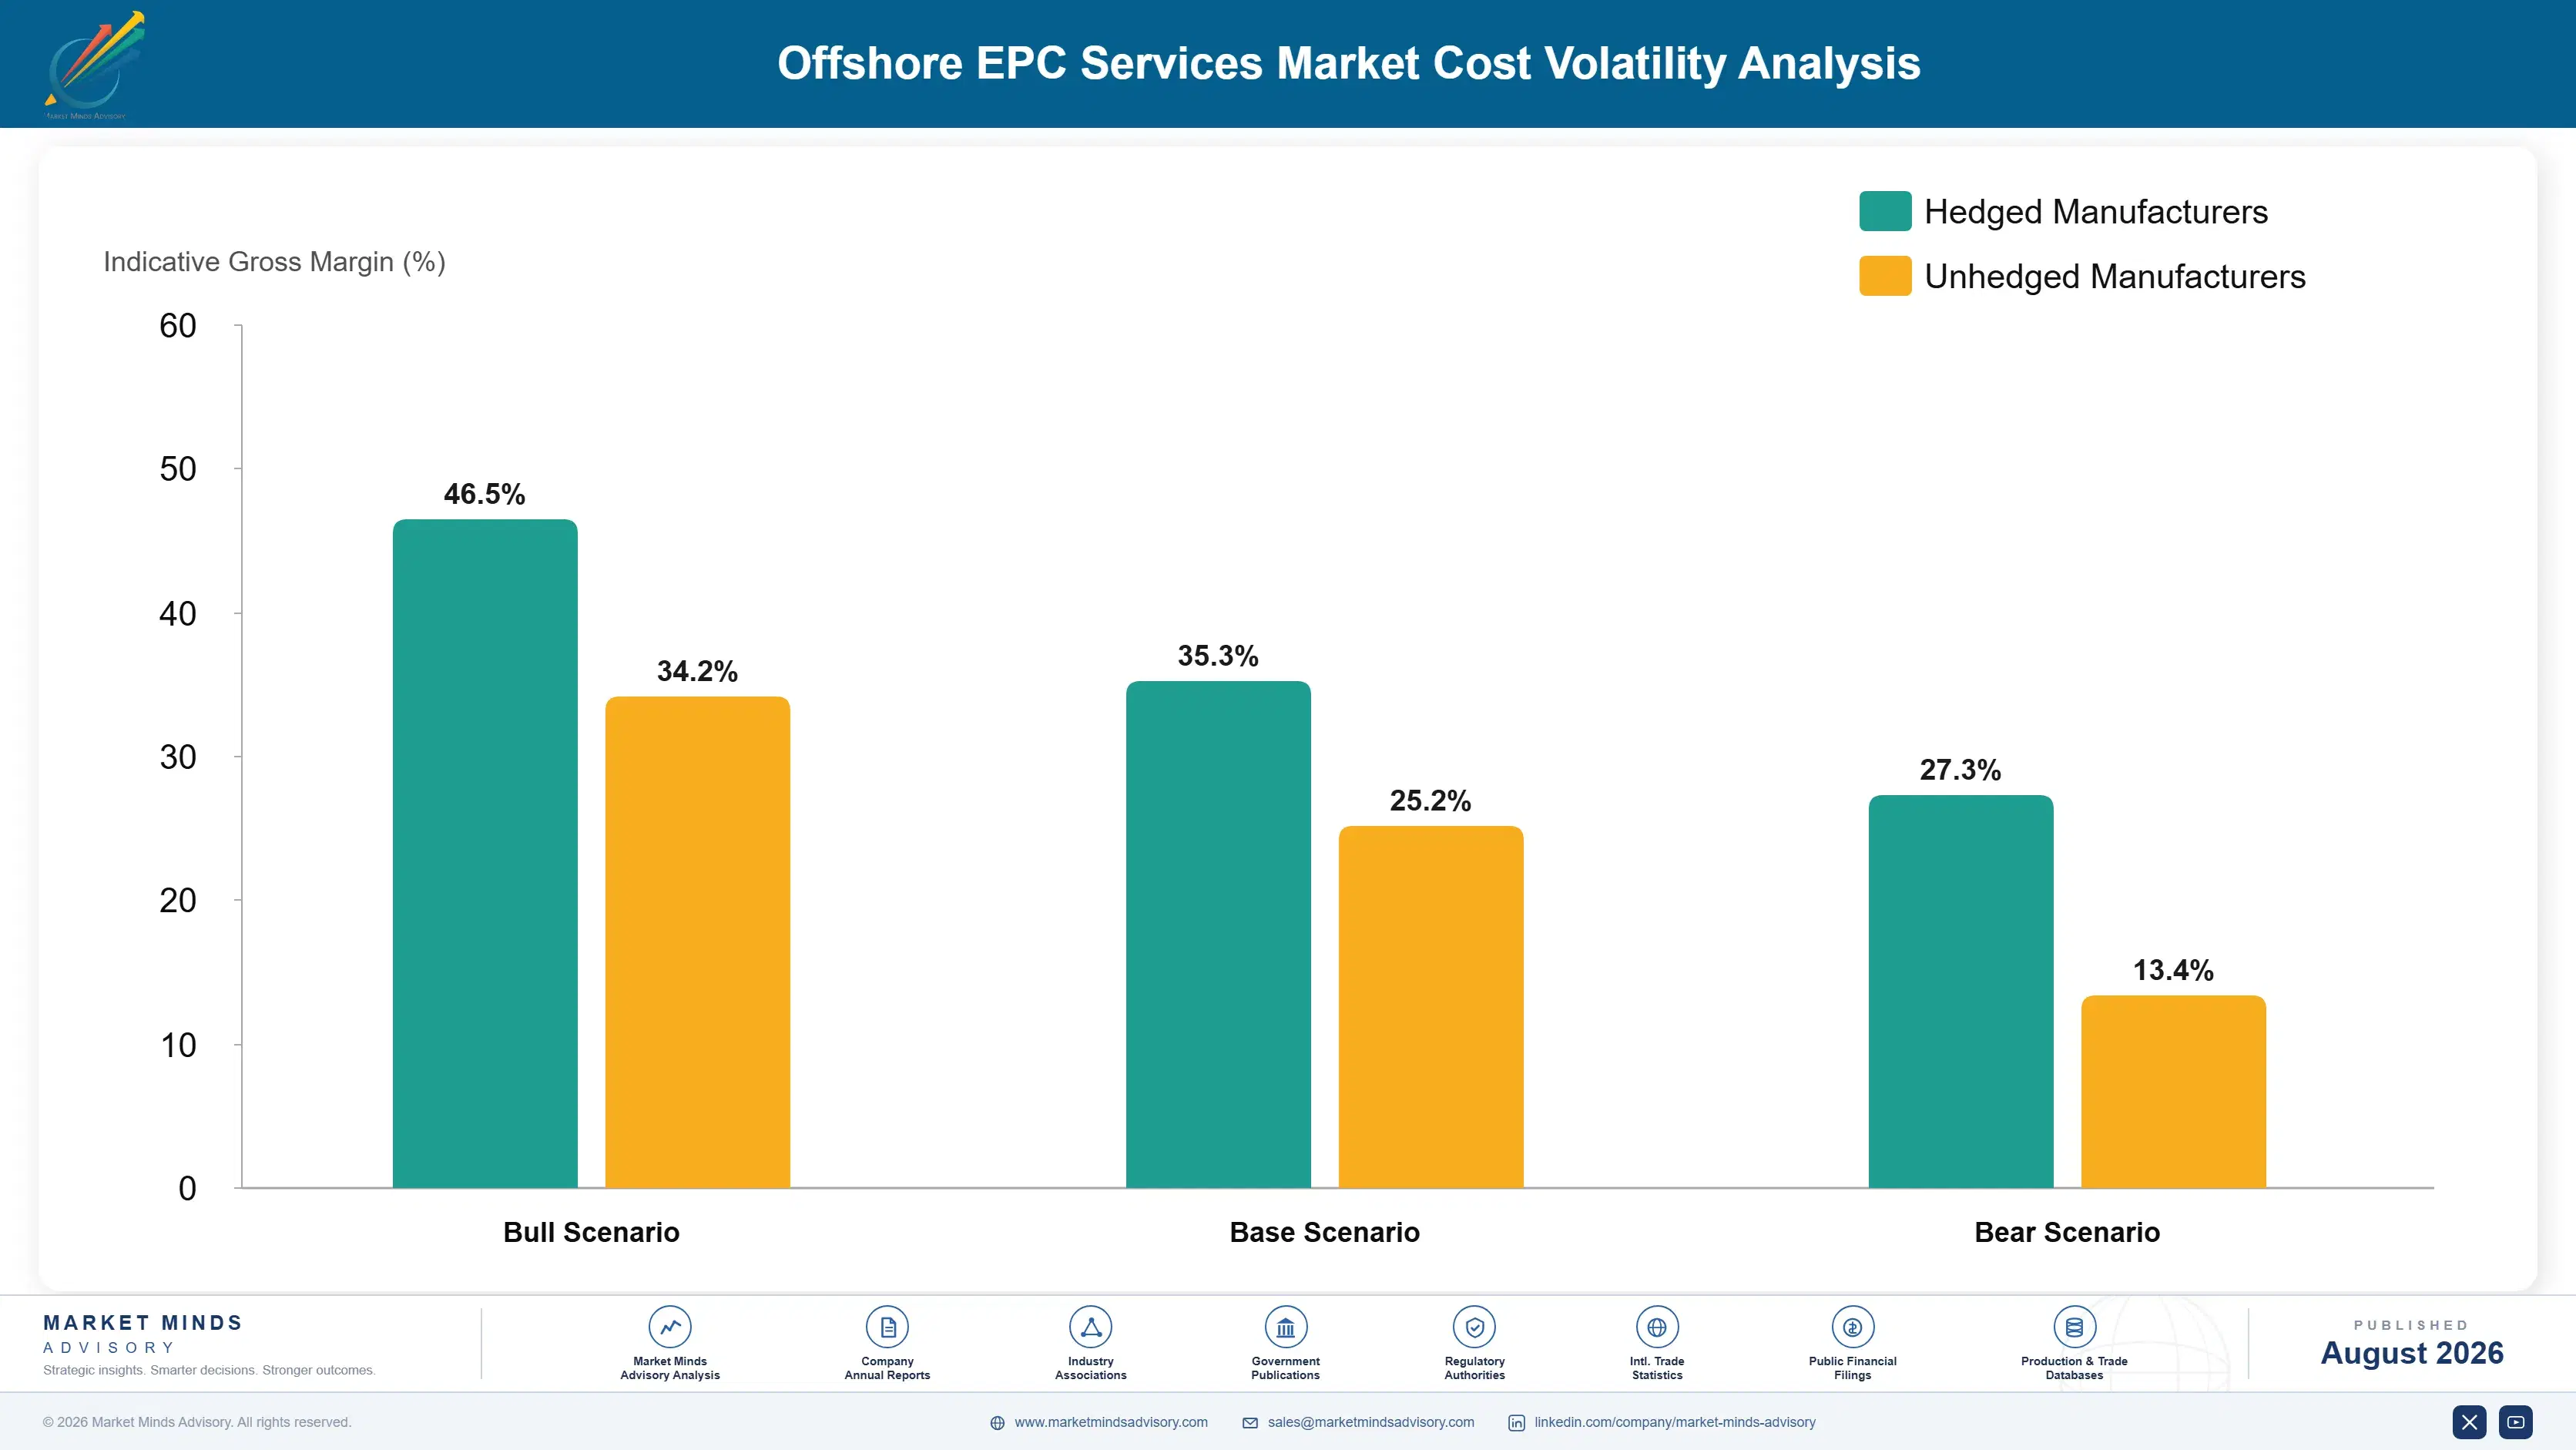
Project cost divides between fabrication labour and yard hours at roughly 31%, steel and bulk materials near 24%, installation vessel spread around 22%, engineering and project management about 14%, and subsea equipment, logistics, and contingency the balance. Vessel and steel exposure both sit outside the contractor's control, and both move on cycles shorter than the 42 months a typical project runs.
Steel plate pricing moved sharply through 2021 and 2022 as energy costs pushed European and Asian mill economics, and several offshore contractors disclosed material cost overruns on lump sum projects in filings covering those years. Vessel day rates rose separately from 2022 as offshore wind demand met a fleet built for the previous hydrocarbon cycle. Neither exposure had a workable hedge at project duration. Both exposures sit outside the contractor's control entirely.

The competitive disadvantage mechanism runs through asset ownership rather than through purchasing. Steel pricing is broadly common and large contractors buy only modestly better, while a contractor owning its installation fleet removes an exposure that a spot charterer carries in full. Yard access works the same way: a contractor with committed capacity bids schedule credibly, and one without is bidding a timeline somebody else controls entirely.
offshore-epc-services-market-cost-volatility-analysis-1787302730977

Write escalation clauses tied to published steel and fuel indices

Steel and bulk materials carry roughly 24% of project cost and move on cycles far shorter than the 42 months a project runs, with no forward market at that horizon. Escalation clauses tied to published indices shift the exposure to the client, who can absorb it across a portfolio. Clients resist them and accept them more readily when

Commit vessel capacity through long-term charter rather than spot

Installation vessel spread carries around 22% of project cost at day rates roughly 2.4 times their downturn trough, and spot chartering at execution prices whatever the market asks by then. Long-term charters carry utilisation risk and remove the largest uncontrolled cost in an installation campaign. Vessel owner alliances achieve much of the same effect with less balance sheet commitment involved.

Reserve fabrication slots before bidding on schedule-critical scopes

Yard hours carry roughly 31% of project cost and qualified yards run above 80% utilisation, so a contractor bidding without secured capacity is bidding a schedule somebody else controls. Option payments for slot reservation are small against liquidated damages for late delivery. That calculation has changed completely since the previous decade, when yard capacity was freely available to anyone.

Portfolio Architecture for Margin Defence

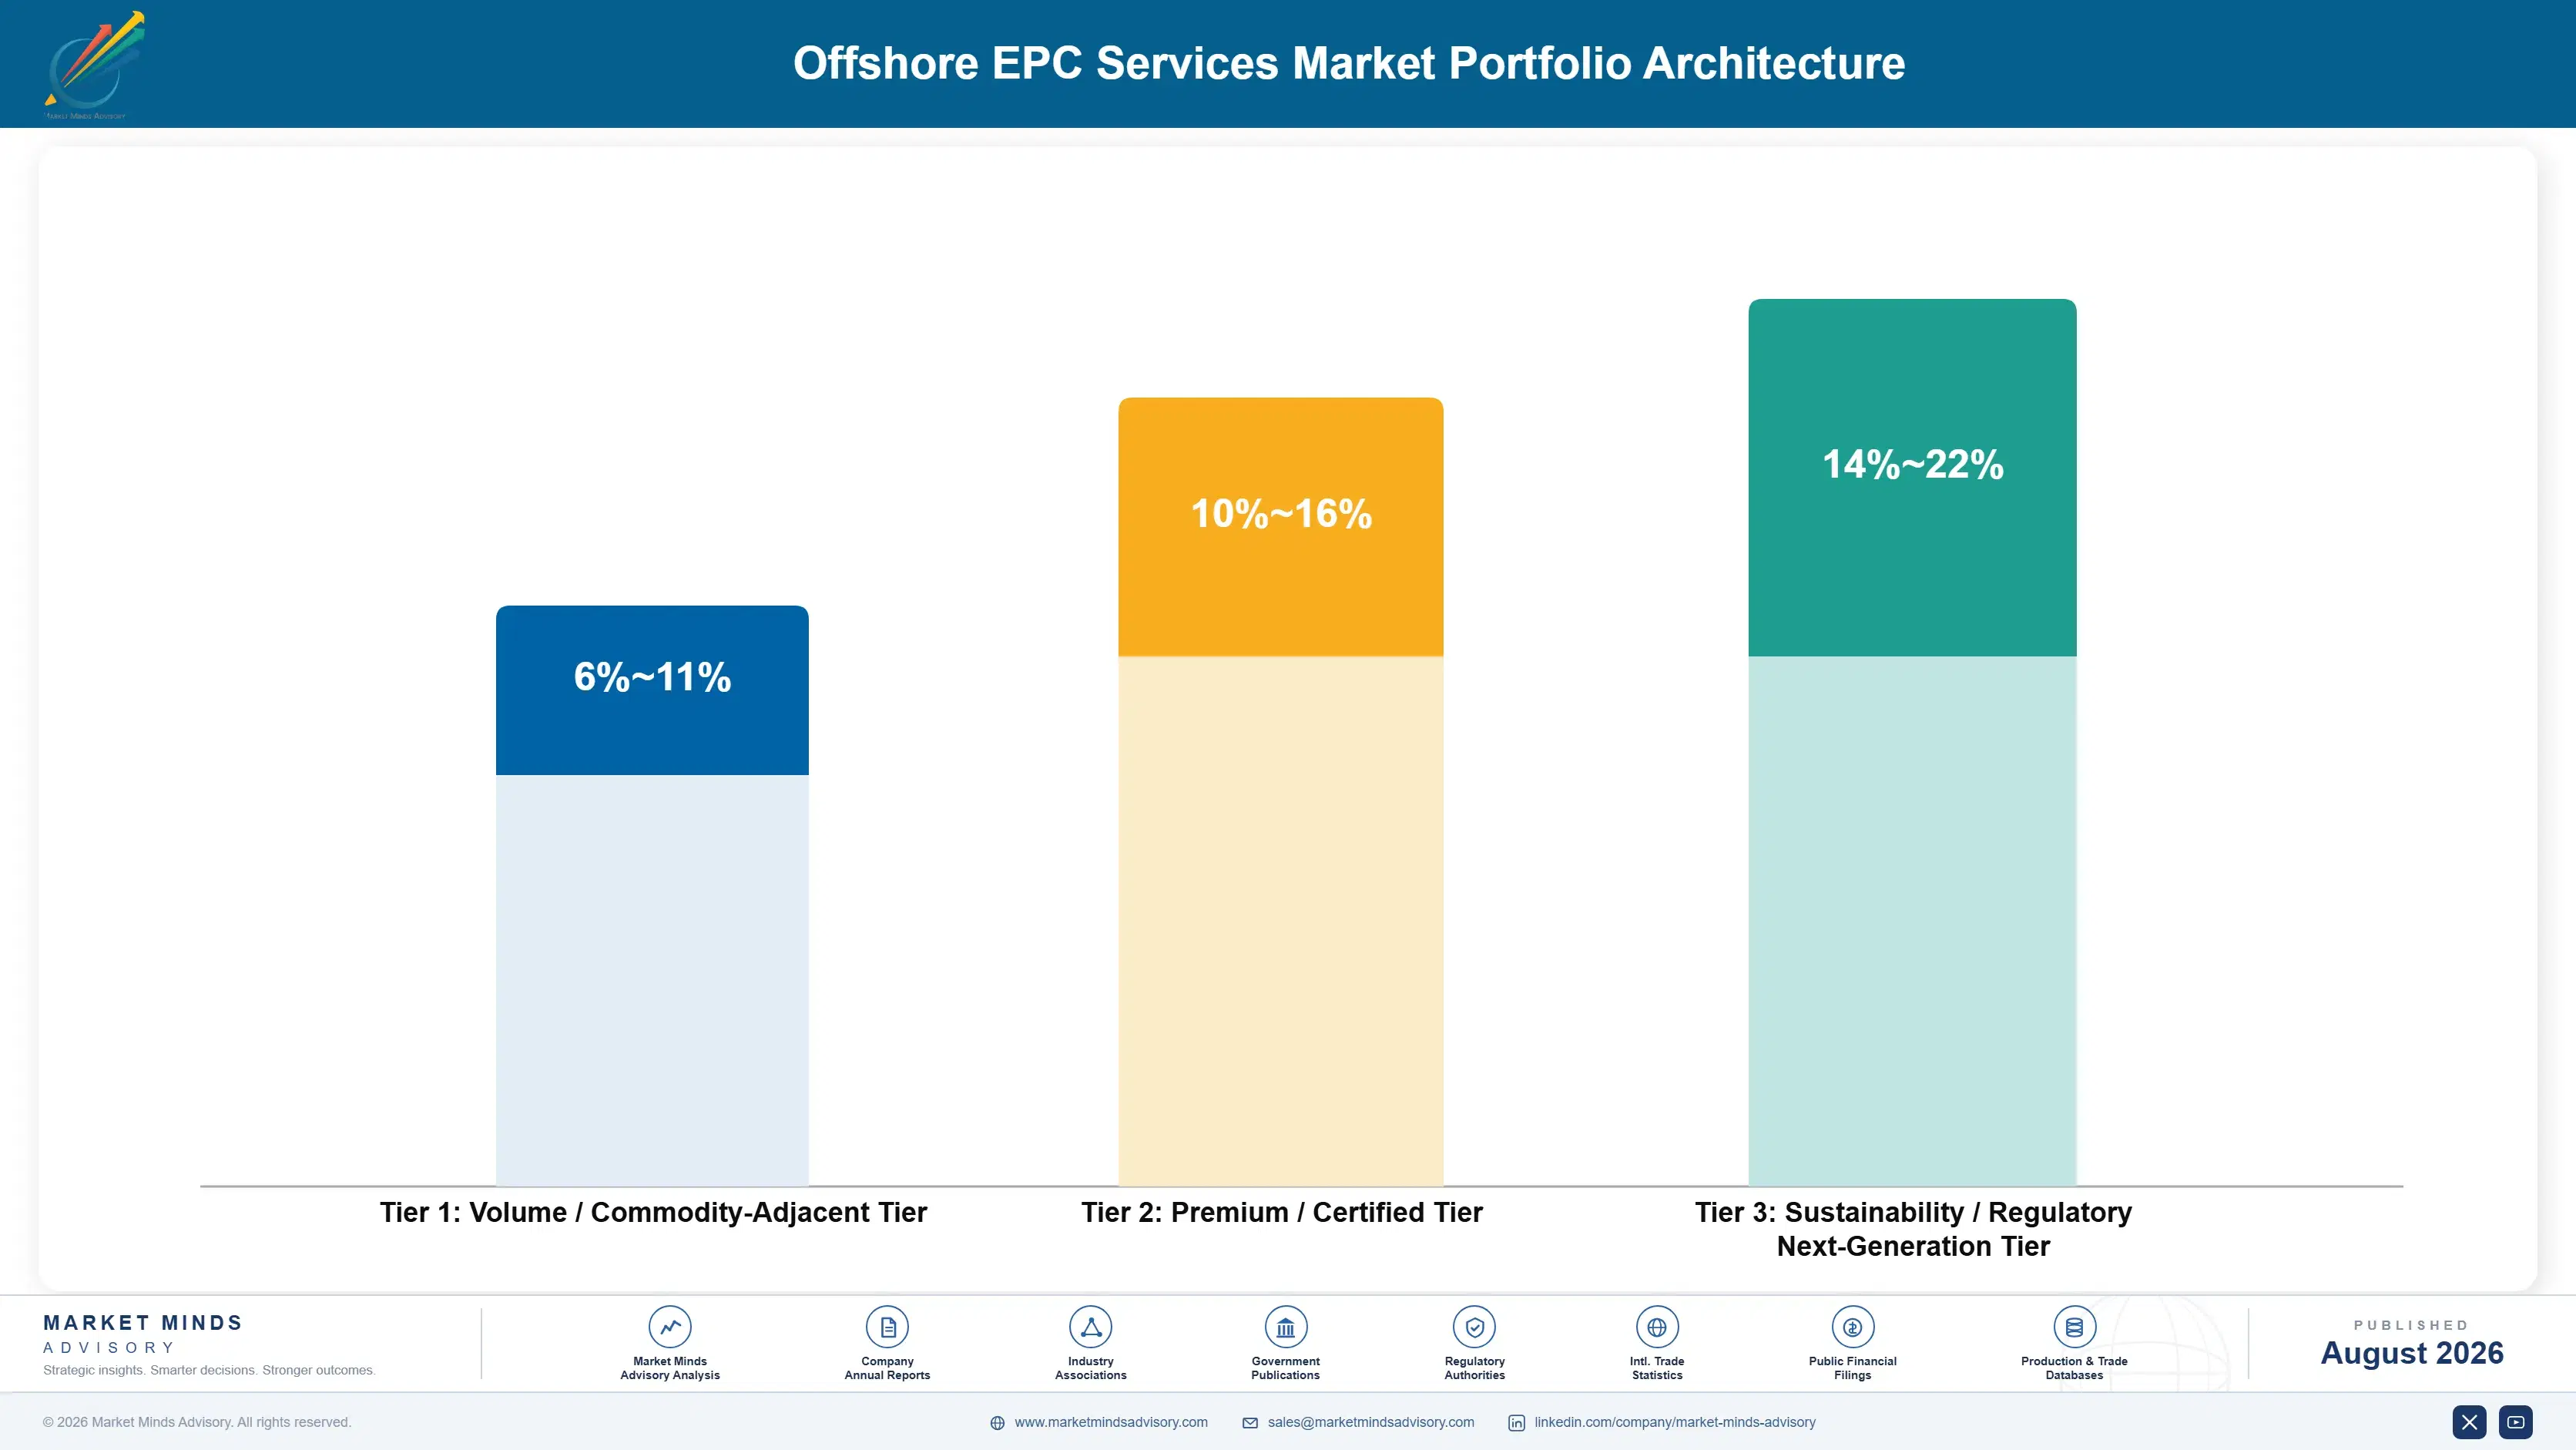
Three tiers describe this business and the spread follows execution risk rather than contract size. Fixed platform and shallow water fabrication sits at the bottom, where regional yards compete hard on cost and the engineering is well understood. Offshore wind foundations and subsea tie-backs occupy the middle. Floating production integration and deepwater subsea sit at the top, where interface management and vessel capability both apply.
The tension is that the top tier carries the best margin and the execution risk that has produced every large write-off in this industry. A contractor weighted there is one interface failure away from losing several years of profit. One weighted toward regional fabrication competes against yards with lower cost bases and national content advantages it cannot match, in work where differentiation barely exists.

High-value pools concentrate where interfaces are hardest to manage. Floating production integration is the clearest case, since topside modules built across several yards must fit a hull built elsewhere, and clients pay for a contractor who has demonstrably done it before rather than one who says it can. Deepwater subsea is the second such pool, where prequalification lists are the shortest in the industry and rarely reopened.

Volume / Commodity-Adjacent Tier

Fixed platform fabrication and shallow water installation where regional yards compete on cost, proximity, and national content requirements. Engineering is well understood and differentiation between credible bidders is genuinely limited.
Gross Margin: 6-11%

Premium / Certified Tier

Offshore wind foundations, substations, and subsea tie-back work where vessel capability and installation scheduling decide outcomes. Volumes are large and the engineering is simpler than floating production integration. Installation scheduling decides most outcomes here.
Gross Margin: 10-16%

Sustainability / Regulatory / Next-Generation Tier

Floating production integration, deepwater subsea, and decommissioning where interface management and demonstrated track record restrict the bidding field. Best margin available and the execution risk that produces every large write-off.
Gross Margin: 14-22%
offshore-epc-services-market-portfolio-architecture-1787302731471

Programmes, Awards and Campaigns

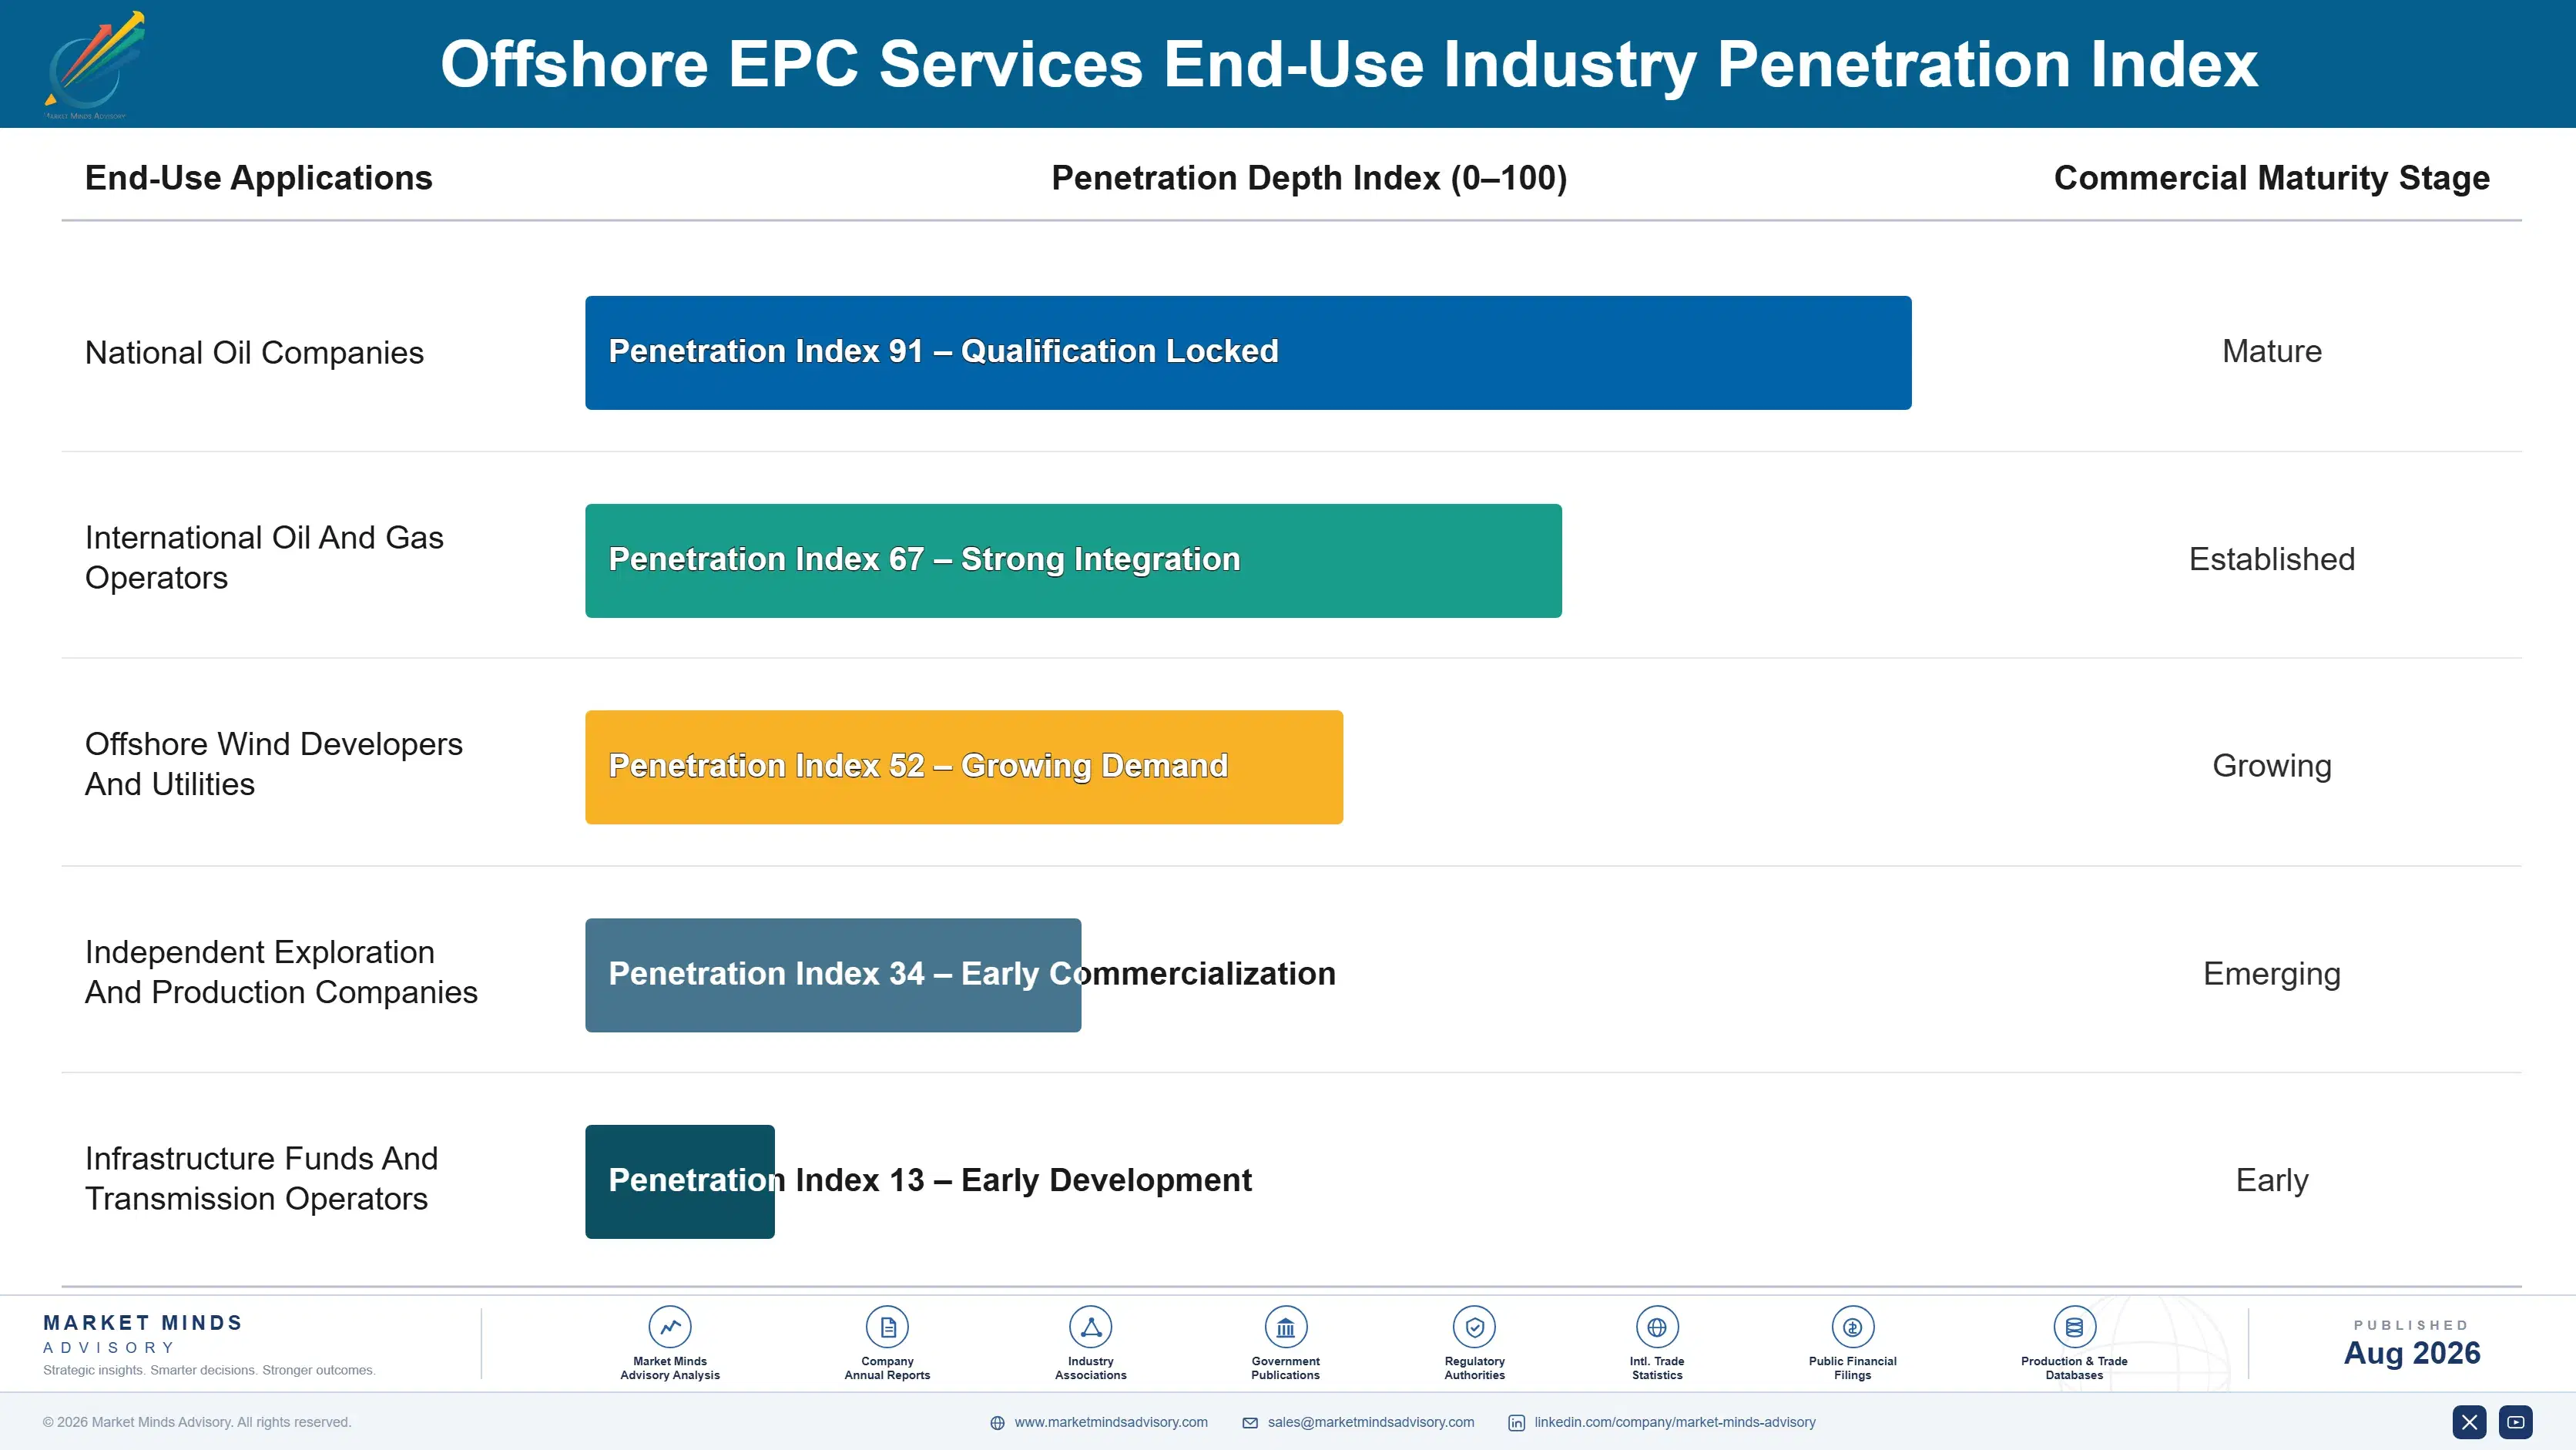
Revenue arrives in large discrete awards rather than as any annuity, which makes this business fundamentally different from most industrial markets and considerably harder to plan. National programmes are the exception: Saudi, Emirati, and Brazilian work is issued in packages against published schedules, giving contractors forward visibility that field-by-field sanctioning never provides. Those programmes are worth disproportionate effort to position for.
Stickiness runs through prequalification and demonstrated delivery rather than through any commercial relationship. Clients maintain approved bidder lists that take years to enter and are rarely reopened, and a contractor removed after a failed project waits a long time to return. Floating production and deepwater subsea lists are the shortest. Fixed platform and shallow water lists are longer and national content requirements shape them more than track record does.

Buyer profiles shifted as offshore wind grew. The earlier client was a national or international oil company with decades of offshore procurement experience and a settled contracting philosophy. The current tender is as likely to come from a utility or an infrastructure fund whose offshore experience is short, whose risk appetite is unclear, and whose financing structure shapes the contract more than engineering does.
offshore-epc-services-market-end-use-penetration-index-1787302731958

What We Would Tell a Board

These are among the four positions where our research anticipates prominent divergence between winners and laggards over the coming forecast period. Each is grounded in the demand model, the regulatory perimeter, and the announced capacity pipeline.
01 / BID DISCIPLINE ENFORCEMENT

The best decision available is declining bad work

Roughly 58% of awards remain lump sum across projects averaging 42 months, and vessel rates, steel pricing, and weather have no forward market anywhere near that horizon at all. Contractors have written off more than a year of group profit on single projects that looked competitively priced on the day they were bid. Estimating improvement helps only at the margin, while declining underpriced work is the thing that actually protects the balance sheet through a cycle nobody in this industry forecasts well.
02 / CAPACITY SECURING PRIORITY

Secure yards and vessels before you bid

Qualified yards run above 80% utilisation and installation vessel day rates sit around 2.4 times their downturn trough, which reverses the position that held right through the previous decade entirely. A contractor bidding without secured capacity is bidding a schedule that somebody else entirely controls, while carrying every pound of the liquidated damages on its own balance sheet. Option payments for slot reservation and long-term charter commitments are small indeed against what late delivery actually costs on a large award, and that calculation has reversed completely.
03 / RENEWABLES CAPABILITY ADDITION

Add wind capability; do not reallocate it

Offshore wind is around 23% of awards and grows at 10.8% against 7.2% for the wider market, which makes it core business rather than any form of diversification now. It competes for exactly the same vessels, yards, and engineering staff as hydrocarbon work rather than drawing on spare capacity anywhere in the business. Contractors that reallocated capacity instead of adding it have found themselves choosing between two live projects, which is a conversation no client wants to be part of at all.
04 / CLIENT MIX ASSESSMENT

Utility clients contract differently from oil companies

Offshore wind tenders increasingly come from utilities and infrastructure funds whose offshore procurement experience is short and whose financing structure shapes the contract more than engineering ever does. Their risk appetite is harder to read than a national oil company's settled contracting philosophy, and the schedules they commit to are frequently set by financing rather than by weather windows. Bid assessment has to account for that difference explicitly rather than treating every offshore client as though it contracted the way national oil companies have always done.

Engagement Snapshot From the Field

A live engagement with an industry participant carrying material or product regulatory and market exposure ahead of a defining policy shift, showing how our research translates into a defensible multi-year portfolio strategy.
MARKET MINDS ADVISORY · CLIENT ENGAGEMENT SUMMARY
Offshore EPC Services Producer Strategic Portfolio Review and Transition Roadmap 2026·Investment Scenario on Offshore EPC Services Exposure Evaluation 2025-26
CLIENT PROFILE
An offshore engineering and installation contractor with approximately 2.1 billion dollars in annual revenue (client-reported, unverified by MMA), operating a partly owned vessel fleet and bidding fixed platform, subsea, and early offshore wind work across three regions. Two lump sum projects had produced write-offs in the preceding three years, and the board had lost confidence in the bid review process entirely.
STRATEGIC CHALLENGE
The board wanted to understand whether the write-offs reflected estimating failure or the acceptance of risk that could not be priced at all, and what a defensible bid policy would exclude from an order book that already looked thin against fixed overhead. Fixed overhead coverage was the constraint everybody kept returning to.
MMA APPROACH
We decomposed both write-offs into cost categories and traced each overrun to its original bid assumption. Contract structures across the wider order book were assessed for hedgeable and unhedgeable exposure. Vessel and yard commitments were tested against bid schedules, and comparable contractor outcomes were benchmarked across the same period. Declined tenders were reviewed alongside won ones.
KEY FINDINGS
  1. Neither write-off traced to estimating error; both traced to vessel and steel exposure across durations where no hedging instrument or forward market existed at all.
  2. Roughly 40% of the current order book carried the same unhedgeable structure, concentrated in the projects with the longest schedules and thinnest bid margins.
  3. Bids submitted without secured yard slots had overrun on schedule in four of five cases, and liquidated damages accounted for a substantial share of both losses.
  4. Two competitors had declined the same tenders the client won, which had been read internally as competitive weakness rather than as a pricing signal worth examining.
CLIENT PROFILE
An offshore engineering and installation contractor with approximately 2.1 billion dollars in annual revenue (client-reported, unverified by MMA), operating a partly owned vessel fleet and bidding fixed platform, subsea, and early offshore wind work across three regions. Two lump sum projects had produced write-offs in the preceding three years, and the board had lost confidence in the bid review process entirely.
STRATEGIC CHALLENGE
The board wanted to understand whether the write-offs reflected estimating failure or the acceptance of risk that could not be priced at all, and what a defensible bid policy would exclude from an order book that already looked thin against fixed overhead. Fixed overhead coverage was the constraint everybody kept returning to.
MMA APPROACH
We decomposed both write-offs into cost categories and traced each overrun to its original bid assumption. Contract structures across the wider order book were assessed for hedgeable and unhedgeable exposure. Vessel and yard commitments were tested against bid schedules, and comparable contractor outcomes were benchmarked across the same period. Declined tenders were reviewed alongside won ones.
KEY FINDINGS
  1. Neither write-off traced to estimating error; both traced to vessel and steel exposure across durations where no hedging instrument or forward market existed at all.
  2. Roughly 40% of the current order book carried the same unhedgeable structure, concentrated in the projects with the longest schedules and thinnest bid margins.
  3. Bids submitted without secured yard slots had overrun on schedule in four of five cases, and liquidated damages accounted for a substantial share of both losses.
  4. Two competitors had declined the same tenders the client won, which had been read internally as competitive weakness rather than as a pricing signal worth examining.
RECOMMENDED STRATEGY
Phase 1: Phase 1 (months one to six): introduce a bid policy excluding lump sum work above thirty months without escalation clauses tied to published indices. Phase 2: Phase 2 (months six to twenty-four): secure yard slots and vessel charters ahead of bidding on all schedule-critical scopes. Accept option costs as bid overhead. Phase 3: Phase 3 (months twenty-four to forty-eight): rebuild the order book toward reimbursable and hybrid structures, accepting lower volume deliberately. Measure margin rather than award value.
OUTCOME
The bid policy was adopted and three tenders were declined in the following two quarters. Order book value fell by roughly a fifth while forecast margin rose, and the board accepted a smaller book as the intended outcome rather than a shortfall (client-reported, unverified by MMA). Two vessel charters were committed ahead of the following bidding round.

Frequently Asked Questions

Foundational context covering the market sizes, CAGR, scope, country, region and competition that inform every finding below. This section is provided to cover basics and most often pre-purchase conversations, answered from the MMA Primary Research Dataset.

What is the current size of the Offshore EPC Services Market?

The market is valued at USD 72.0 billion in 2025, rising to USD 77.18 billion in 2026. Scope covers offshore engineering, procurement, construction, and installation services, not drilling, turbine supply, or operations and maintenance.

How large will the Offshore EPC Services Market be by 2036?

MMA forecasts USD 154.68 billion by 2036, an increase of USD 77.50 billion over the 2026 base. That represents an expansion multiple of 2.00 times across the forecast period.

What is the CAGR for the Offshore EPC Services Market 2026 to 2036?

The base case CAGR is 7.2%, with a bull case of 8.5% and a bear case of 6.0%. The historical rate from 2020 to 2025 was 5.9%, depressed by the 2020 and 2021 award collapse.

Which segment is growing fastest?

Offshore wind foundations and substations EPC at 10.8%, exactly 1.50 times the market rate. Renewables now account for around 23% of awards rather than being a side business.

Who are the major companies in the Offshore EPC Services Market?

Saipem, TechnipFMC, Subsea7, McDermott International, and Aker Solutions lead on awarded contract value. The top five hold just 34%, since regional yards hold strong local award positions.

Which country is growing fastest?

India at 9.8%, driven by offshore development and the first serious offshore wind tenders. Indian yards now compete for regional awards rather than only domestic ones.

Report Segmentation Architecture

The full report scope spans multiple orthogonal segmentation dimensions, with cross-tabulated demand data provided for each dimension pair. Coverage extends further to regional breakdowns, trend trajectories, and the competitive detail needed to support segment-level decision-making.

By Offshore Asset Type Delivered

  • Fixed Platform EPC
  • Floating Production Systems EPC
  • Subsea Infrastructure And Pipeline EPC
  • Offshore Wind Foundations And Substations EPC
  • Decommissioning And Removal

By End-Use Industry

  • National Oil Companies
  • International Oil And Gas Operators
  • Offshore Wind Developers And Utilities
  • Independent Exploration And Production Companies
  • Infrastructure Funds And Transmission Operators

By Commercial Model

  • Lump Sum Turnkey Contracts
  • Reimbursable And Target Cost Contracts
  • Engineering Only Or Front End Scope
  • Fabrication Subcontract Supply
  • Alliance And Framework Agreements

By Region

  • Middle East and Africa
  • East Asia
  • Latin America
  • Western Europe
  • South Asia and Pacific
  • North America
  • Eastern Europe

Scope, Methodology, and Coverage

Every figure in this report is reproducible from documented input assumptions. The scope below maps the historical period, the forecast horizon, the segmentation dimensions, and the countries covered, alongside the underlying primary and qualitative methodology.
Historical Period
2020 to 2025
Forecast Period
2026 to 2036
Base Year
2025 (USD billions; MMA Primary Research Dataset, August 2026)
Market Definition
This market comprises engineering, procurement, construction, and installation services delivered for offshore energy assets, measured at contractor revenue across lump sum, reimbursable, engineering-only, subcontract, and framework agreement channels. Coverage spans fixed platform EPC, floating production storage and offloading systems EPC, subsea infrastructure and pipeline EPC, offshore wind foundation and substation EPC, and offshore decommissioning and removal. Onshore terminals and gas processing facilities, drilling rigs and drilling services, vessel chartering contracted separately from EPC scope, offshore wind turbine nacelle and blade supply, subsea production equipment manufactured for third-party integration, marine survey services, and offshore operations and maintenance contracts fall outside scope.
Quantitative Units
USD billions (current prices); awarded contract value; project duration in months; fabrication yard hours consumed
Segmentation Dimensions
By Offshore Asset Type Delivered; By End-Use Industry; By Commercial Model; By Region
Regions Covered
Middle East and Africa, East Asia, Latin America, Western Europe, South Asia and Pacific, North America, Eastern Europe
Countries Covered
Saudi Arabia, United Arab Emirates, Qatar, Angola, Nigeria, Mozambique, China, South Korea, Japan, Brazil, Guyana, Mexico, United States, United Kingdom, Norway, Netherlands, Denmark, Germany, India, Australia, Malaysia, Indonesia, Vietnam, Poland, Romania, and additional markets relevant to this sector
Key Companies Profiled
Saipem, TechnipFMC, Subsea7, McDermott International, Aker Solutions, Petrofac, HD Hyundai Heavy Industries, Samsung Heavy Industries, Seatrium, COOEC, Larsen and Toubro, National Petroleum Construction Company, Van Oord, Boskalis, DEME, Jan De Nul, Allseas, Heerema Marine Contractors, Sapura Energy, Wood
Quantitative Methodology
Primary survey, n=3,800 respondents, Q4 2025, six countries; demand-side model with trade association cross-validation
Qualitative Methodology
47 expert interviews, Q4 2025; applied to validate demand model assumptions, identify emerging dynamics, and assess competitive positioning
Report Format
PDF and XLSX data workbook (Word format preview document)
Publisher
Market Minds Advisory
Report Code
MMA-2026-ENE-784
Published
August 2026
Contact
sales@marketmindsadvisory.com | www.marketmindsadvisory.com

Purchase the full Offshore EPC Services Market Report (2026 to 2036).

The full report sizes offshore EPC across five asset types, five client categories, five commercial models, and seven regions, with lump sum exposure quantified by project duration and contract structure throughout. Fabrication yard capacity and installation vessel availability are assessed as separate constraints, since both now decide schedule credibility more than engineering depth does. Award pipelines are mapped against national programme schedules. Competitive profiling covers twenty contractors on awarded contract value, and offshore wind capability is assessed separately from hydrocarbon delivery experience. Regional demand is built from basin geography rather than from any industrial output measure.
Lump sum exposure quantified by project duration and contract structure
Fabrication yard capacity assessed as a distinct scheduling constraint
Installation vessel availability mapped against committed project campaigns
Award pipelines built from published national programme schedules
Offshore wind capability assessed separately from hydrocarbon delivery experience
Write-off history decomposed into hedgeable and unhedgeable cost exposure

Built For The People Who Decide

From boardroom strategy to bench-side execution, this report is read cover-to-cover by leaders shaping the next decade of their industry, turning demand scenarios, market dynamics and valuation benchmarks into decisions.
CXOs/ Presidents/ VPs/ Managers
M&A and Corporate Development
Strategy Teams and R&D Heads
Procurement and Product Directors
Regulatory and Compliance Leaders
Investor Relations and Equity Analysts