Market Minds Advisory
Next Generation Packaging Technology Market

Next Generation Packaging Technology Market: Active, Intelligent, and Sustainable Substrate Systems

Consumer brands are racing to embed sensors, freshness indicators, and recyclable substrates into everyday packaging as e-commerce volume, food safety regulation, and extended producer responsibility mandates reshape converting lines across every major packaging category worldwide.

Lead Analyst

Bilal Shaikh

Published

August 2026

Make Smarter Decisions with Customized Research Insights

Request a free sample report and evaluate market opportunities, growth trends, and competitive dynamics relevant to your business needs.

2025 MARKET VALUE$38.6BMarket Size 2025
2036 FORECAST VALUE$103.6BBase Case , 2026 to 2036
CAGR 2026 TO 20369.4 %Bull 10.6% / Bear 8.2%
INCREMENTAL OPPORTUNITY$61.4BNet 10- year value creation
EXPANSION MULTIPLE2.46x2036 value over 2026 base
Strategic Levers
M&A Pipeline
Regional Outlook
Country Rankings
Competitive Intelligence
Segmental Deep-dive
Call-Us : 91 93563 13602

Executive Snapshot and Market Trajectory

Packaging has stopped being passive. Brand owners now specify sensors, freshness indicators, and connectivity directly into substrates, turning every carton and pouch into a data channel that retailers, regulators, and consumers all read differently, and none of them read the same way twice this early in the shift.
Intelligent and smart packaging is expanding fastest, pulled by pharmaceutical serialization mandates, cold-chain food logistics, and retailers demanding real-time shelf-life data, and it is growing roughly 36% faster than the category average. Converting capacity is concentrating in East Asia, where contract manufacturers already run the printing, laminating, and RFID-tagging lines that Western brand owners increasingly outsource rather than build in-house, given the capital intensity of smart-label integration.
Competitive intensity now centers on materials science rather than print quality. Amcor, Sealed Air, and Avery Dennison are racing smaller specialists to patent recyclable mono-material barrier films and printed sensor circuits before extended producer responsibility fees make legacy multi-layer laminates unworkable. Regulatory pressure from the EU Packaging and Packaging Waste Regulation, plus similar rules in California and Asia, is compressing the timeline brand owners have to requalify packaging formats across portfolios.
Market Definition
The Next Generation Packaging Technology market covers active, intelligent, and connected packaging systems, including oxygen scavengers, freshness indicators, printed sensors, RFID and NFC tagging, and recyclable barrier substrates sold to brand owners and contract packagers. It excludes standard rigid and flexible packaging that carries no embedded technology, sensing, or functional barrier innovation beyond conventional printing and lamination.
Base Year Value
$38.6B in 2025 (MMA Primary Research Dataset, August 2026)
Forecast Period
2026 to 2036, eleven discrete annual values
CAGR
9.4% base case. Bull 10.6%. Bear 8.2%.
Fastest Growth Segment
Intelligent and Smart Packaging: 12.8% CAGR
Fastest Growth Country
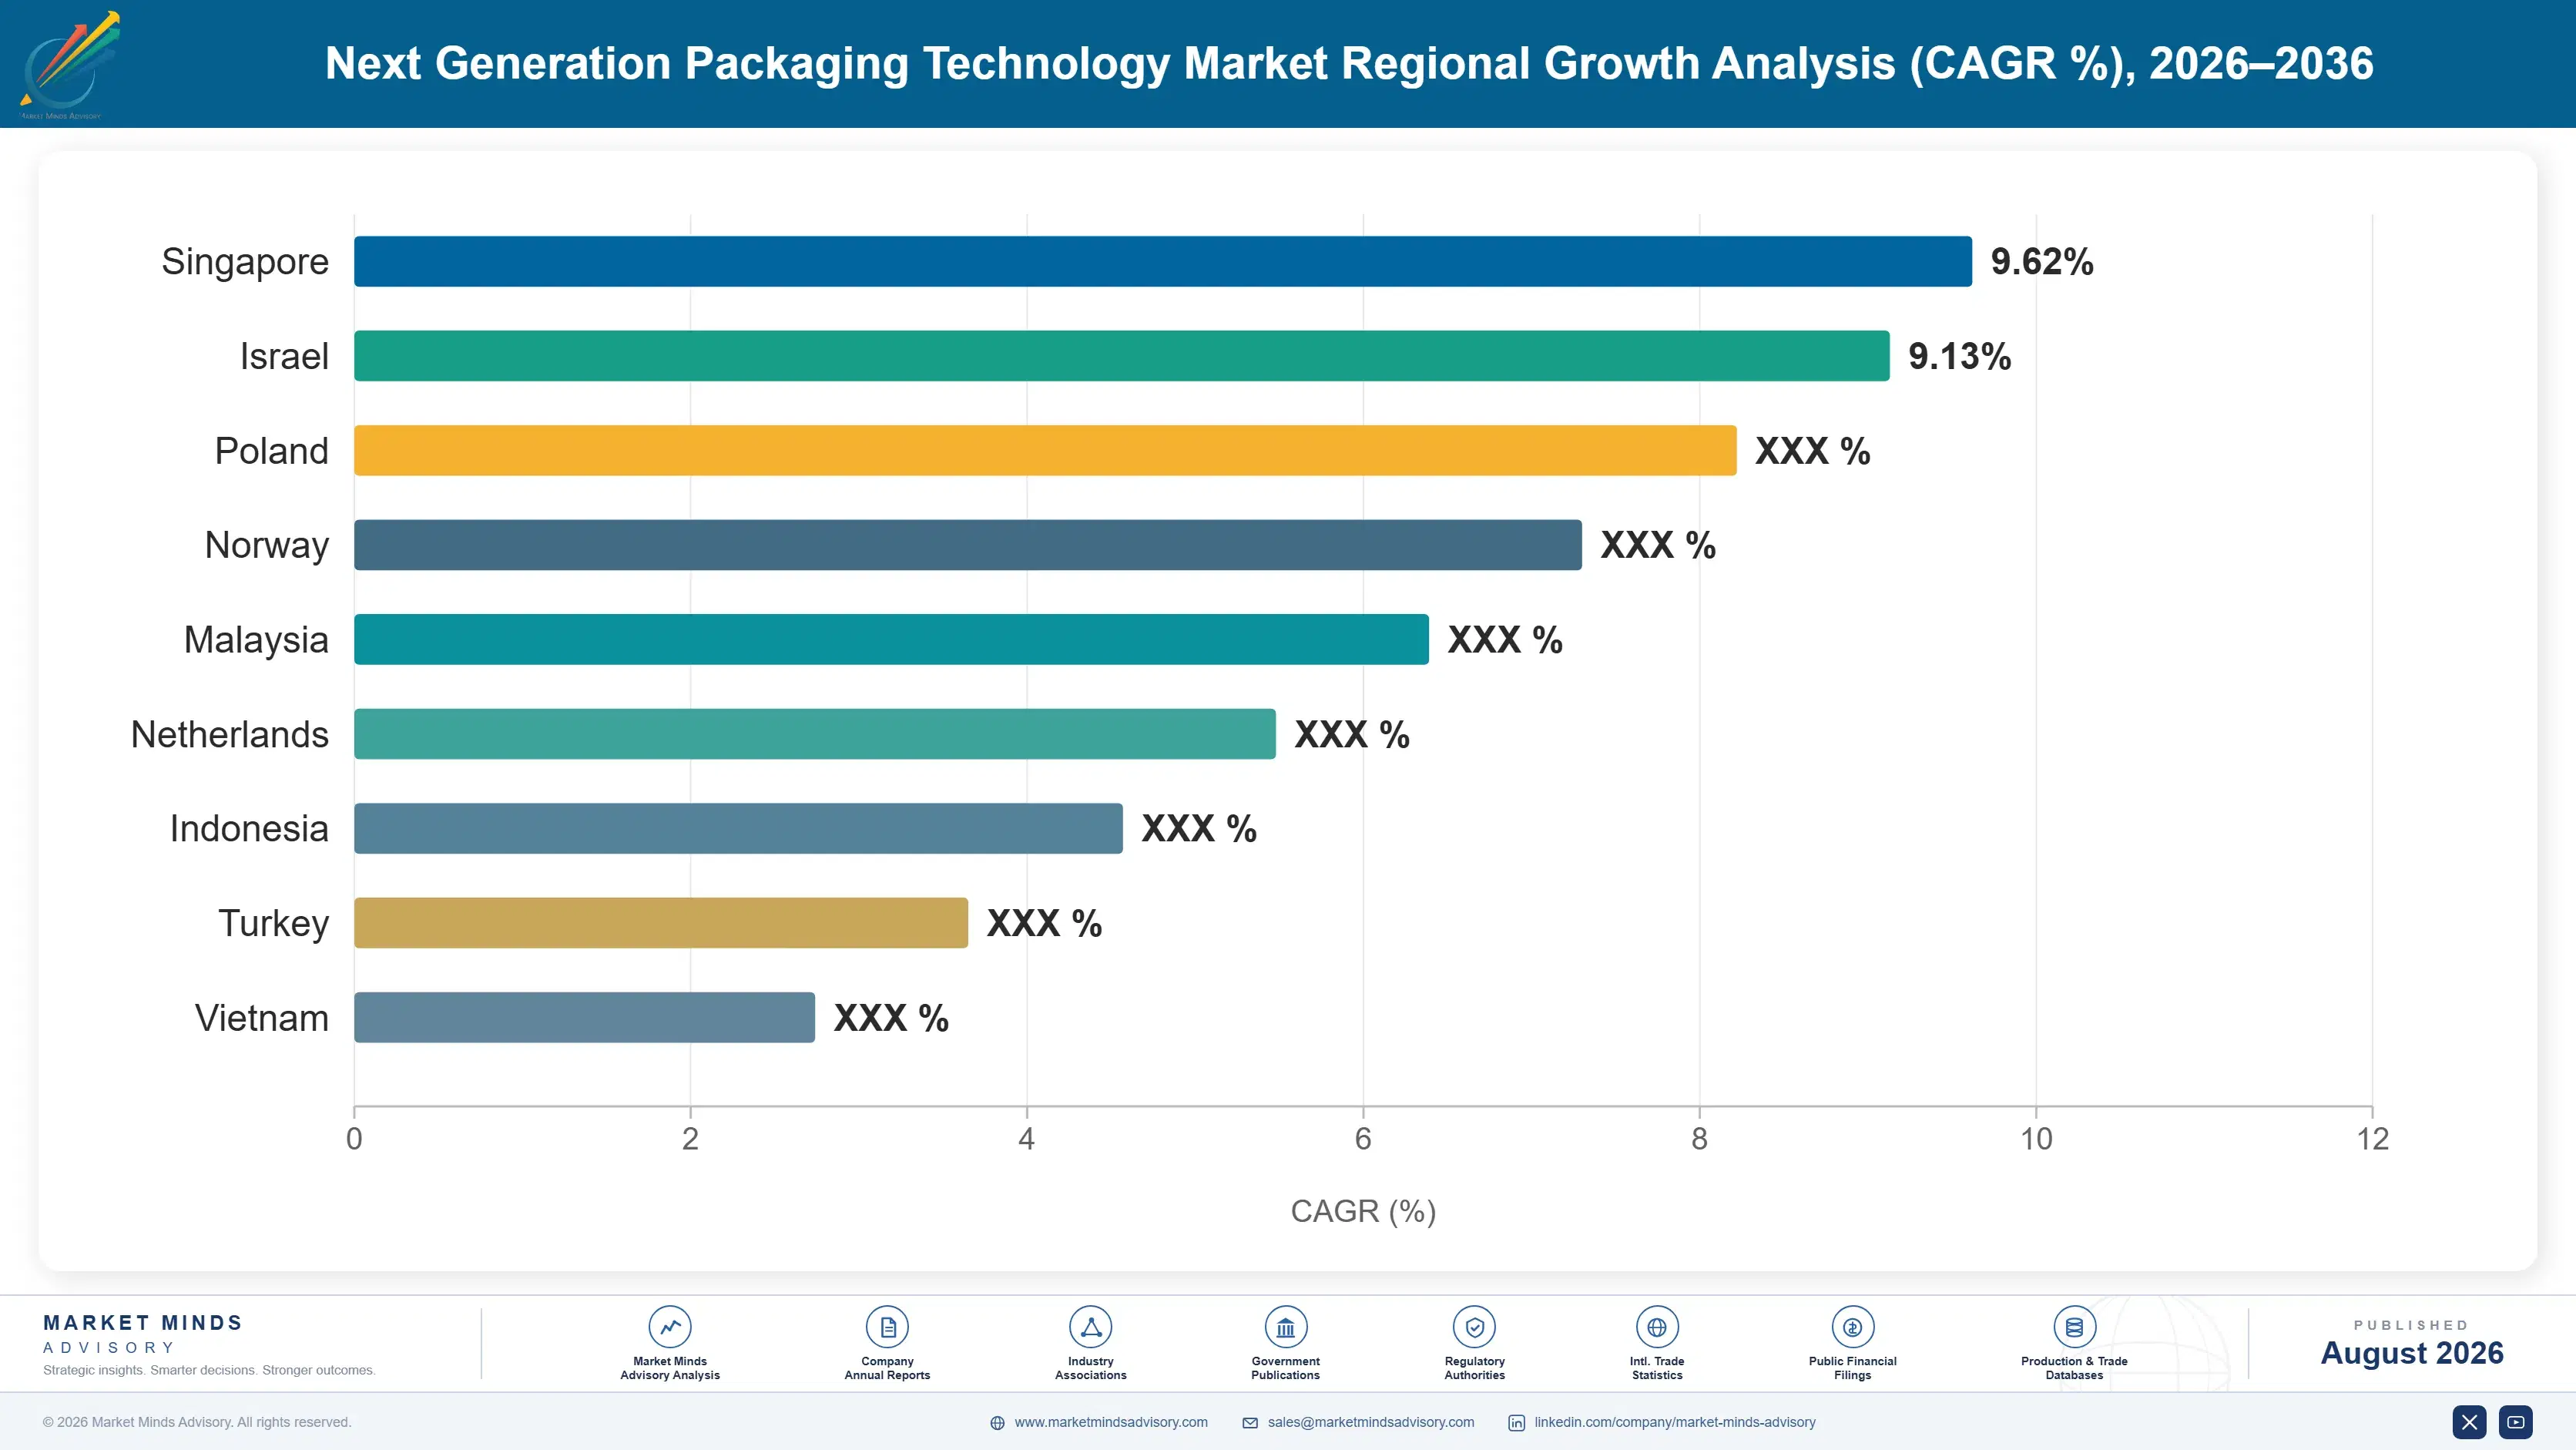
China: 11.8% CAGR
Fastest Growth Region
South Asia and Pacific: 11.4% CAGR
Largest Region
East Asia: 29% of 2025 global value
Market Leaders
Amcor plc, Sealed Air Corporation, Avery Dennison Corporation, Sonoco Products Company, Berry Global Group. Source: MMA Analysis based on company annual reports.
Primary Survey
n=3,800 procurement and R&D decision-makers, Q4 2025, six countries
Methodology
Demand-side build-up, cross-validated against public data, 47 expert interviews

Next Generation Packaging Technology Market Forecast Scenarios

next-generation-packaging-technology-market-size-forecast-scenario-1787301192996
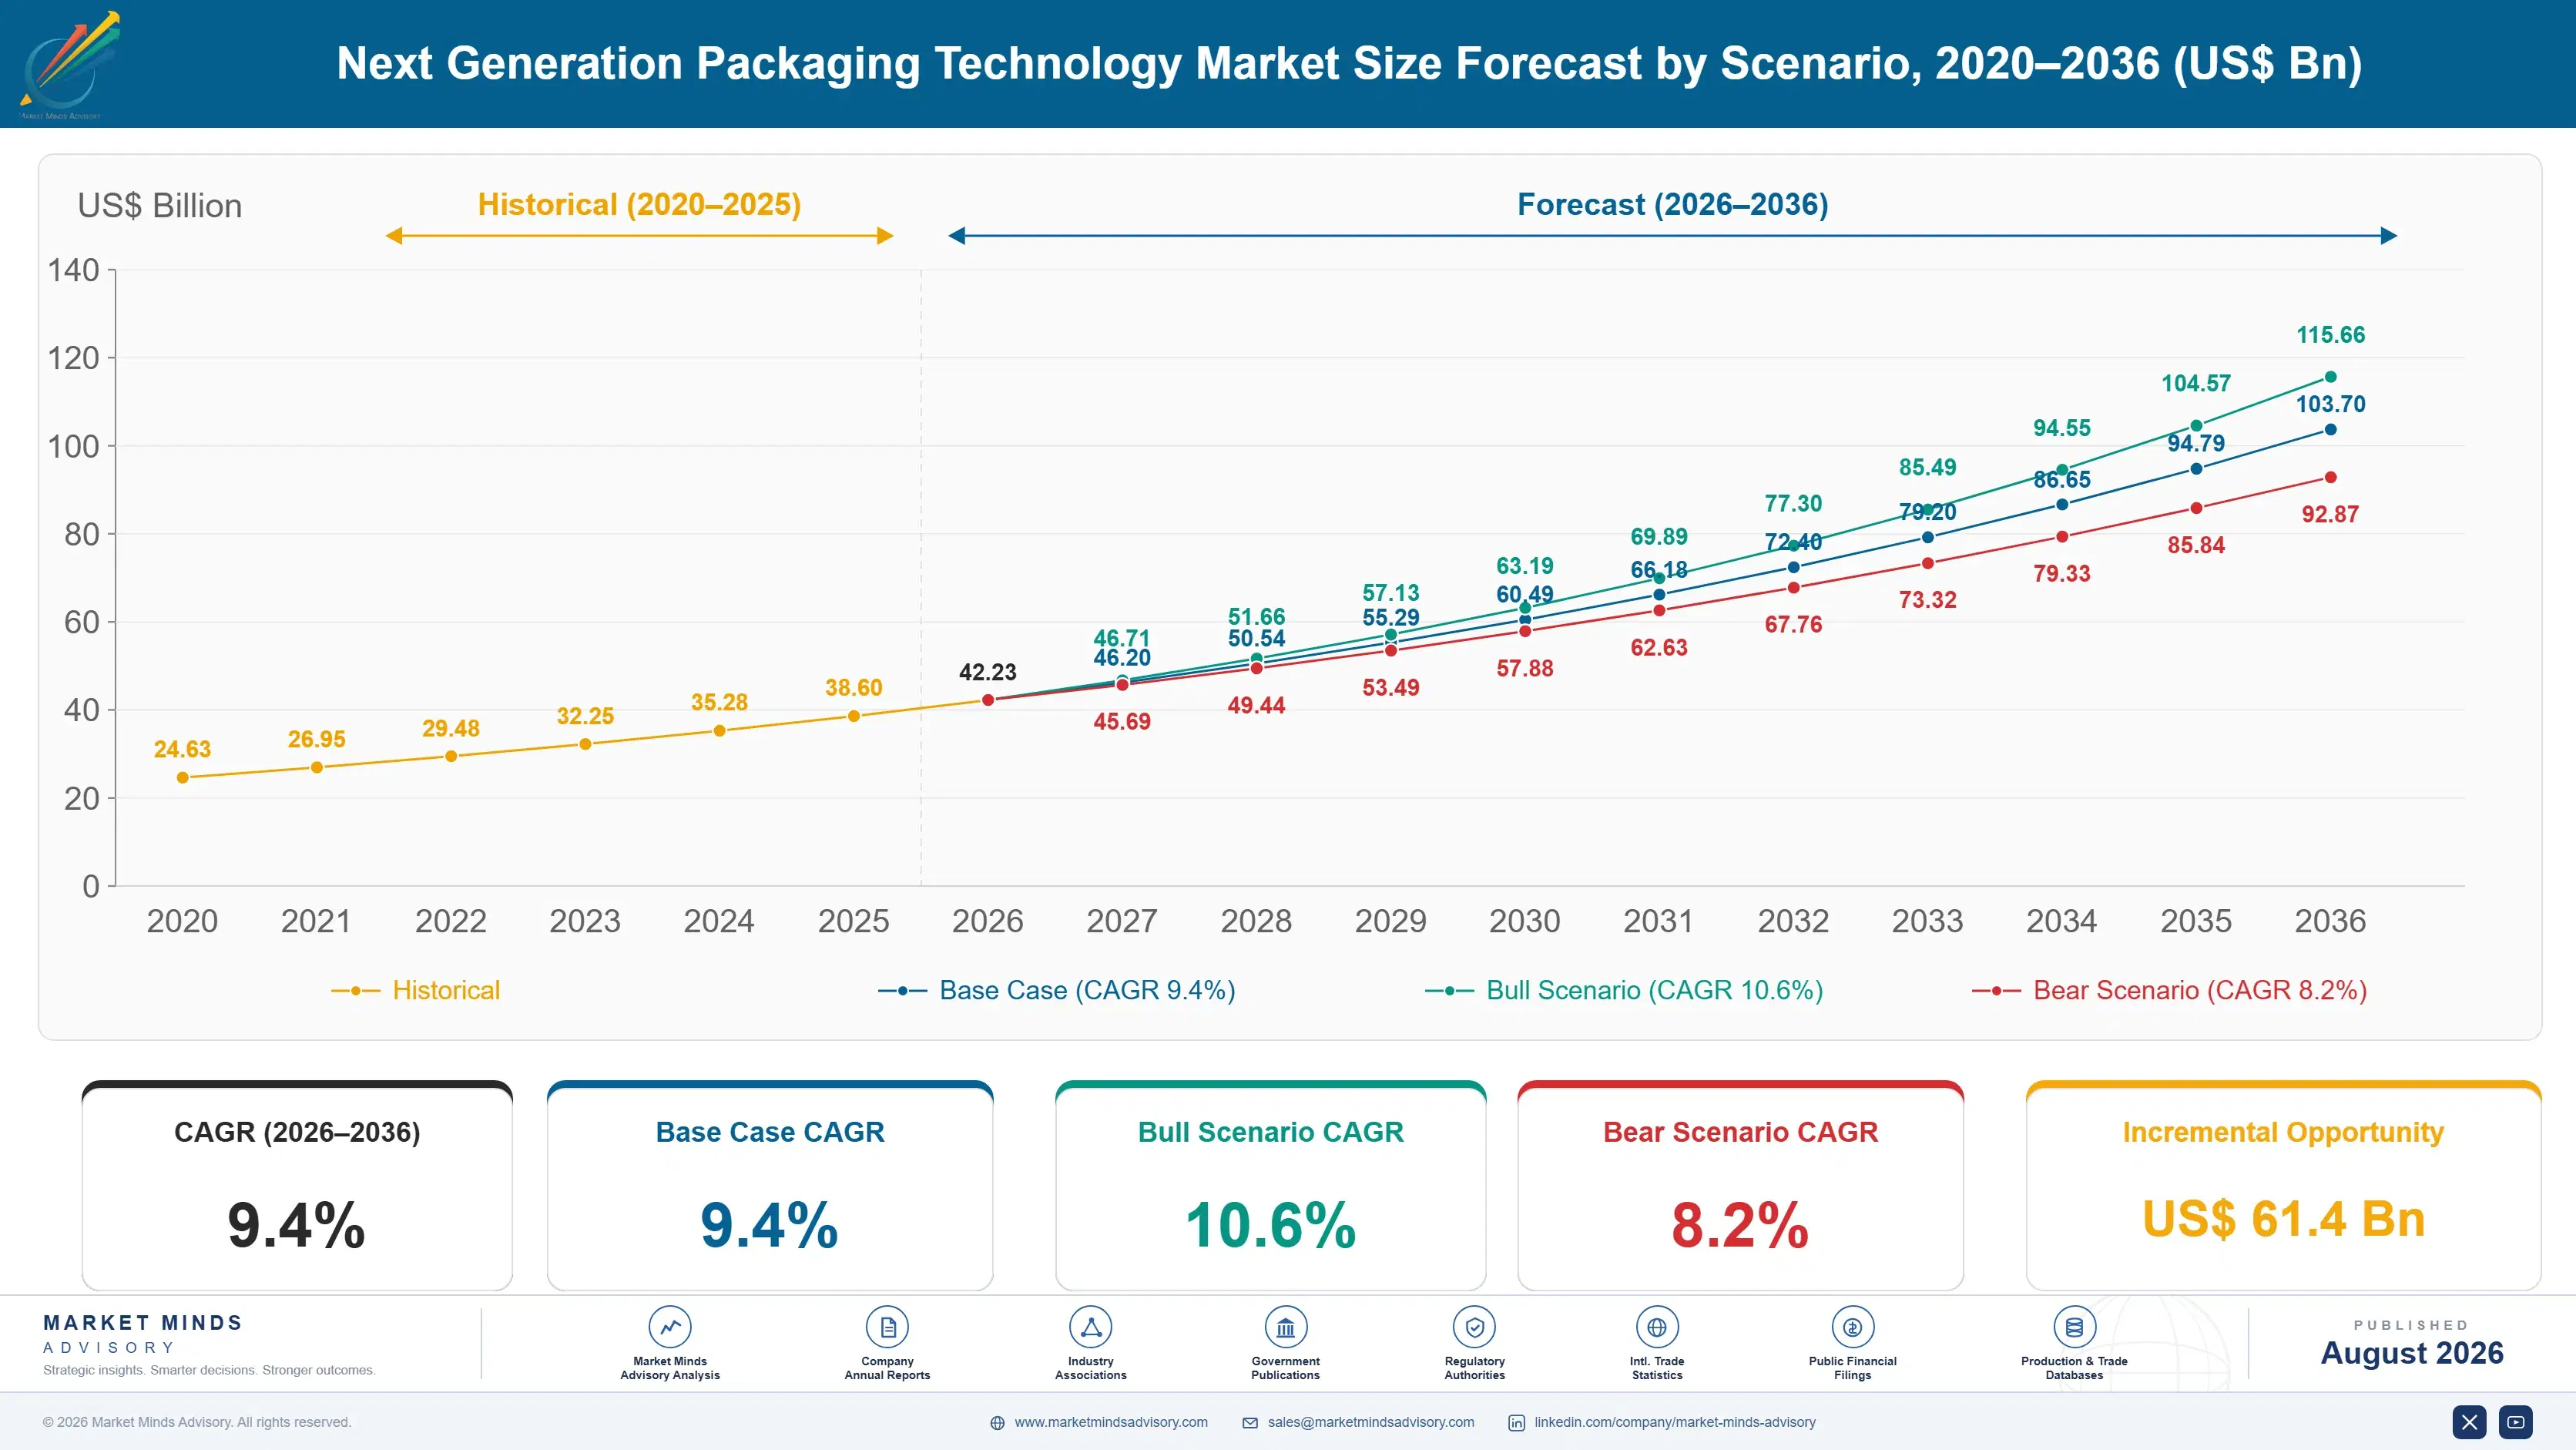
Packaging technology adoption accelerated unevenly between 2020 and 2025. Pandemic-driven e-commerce growth pulled forward investment in tamper-evident and traceable formats, then cooled as brand owners absorbed higher resin costs. Food safety recalls and pharmaceutical counterfeiting cases kept intelligent packaging budgets intact as discretionary categories slowed, producing a historical CAGR of 8.4% that undersells how concentrated the growth actually was.
The base case assumes 9.4% annual growth through 2036, driven by three mechanisms. First, EU and California extended producer responsibility fees push brand owners toward mono-material recyclable structures carrying embedded sensing rather than laminated inserts. Second, US and EU pharmaceutical serialization rules lock in recurring smart-label demand through the forecast window. Third, retailers including Walmart and Carrefour are requiring supplier-side freshness indicators on perishable categories, converting a discretionary purchase into a listing requirement.
The bull case turns on faster-than-expected EU deforestation and packaging waste enforcement forcing accelerated substrate conversion, pushing growth toward 10.6%. The bear case centers on resin and specialty-film input cost spikes that push smart-label bill-of-materials costs above what mid-tier brand owners can absorb, delaying qualification cycles and pulling growth down toward 8.2% if raw material volatility persists through the back half of the forecast window.

Substrate Innovation and Embedded Intelligence Economics

Packaging is absorbing capability that used to sit in logistics software and shelf audits. Sensors, printed electronics, and recyclable barrier chemistries are converging inside a single format because brand owners want traceability, freshness data, and regulatory compliance from the same unit that used to just hold the product, and converters are re-tooling lines to deliver all three at once.
CR5 CONCENTRATION34%Reflects fragmented specialist base across regional converting hubs
SMART LABEL PRICE PREMIUM18-24%Premium brand owners pay over conventional unprinted packaging formats
CHINA CONVERTING SHARE31%Share of global smart packaging conversion capacity concentrated there
CAPACITY UTILISATION76%Average utilisation across qualified smart packaging production lines currently
CROSS-BORDER TRADE INTENSITY42%Finished smart packaging volume crossing borders before final conversion
RESIN SHARE OF COGS38-45%Polymer feedstock cost weight within typical bill of materials
China, South Korea, and Vietnam host the converting capacity that Western brand owners now depend on, since qualifying a new RFID or moisture-sensing line costs tens of millions and takes eighteen months, favoring incumbents with existing tooling over new entrants. Contract manufacturers are consolidating as a result, and mid-sized regional converters are increasingly acquisition targets rather than independent competitors.
The next decade of forces looks different from the last. Extended producer responsibility fees are turning recyclability from a marketing claim into a line-item cost, and printed electronics are getting cheap enough that mid-market brands, not just premium ones, can justify a smart label. Expect converting capacity to keep shifting toward whichever region can combine the printing precision with a substrate that survives modern recycling streams intact.
"Smart packaging stopped being a marketing add-on the day pharma serialization became mandatory. The brands still treating it as optional are the ones that will requalify their entire portfolio under regulatory deadline pressure instead of on their own schedule."
Director, Packaging and Materials Practice · MMA Packaging Technology Practice <

Market Trends

EU Packaging and Packaging Waste Regulation Reshapes Substrate Choice

The EU Packaging and Packaging Waste Regulation, entering into force in phases through 2030, mandates that essentially all packaging placed on the EU market be recyclable at scale by 2030 and sets minimum recycled-content thresholds for plastic packaging. Brand owners selling into the bloc are requalifying multi-layer laminate formats years ahead of the compliance deadline because tooling changes take 12 to 18 months to validate. Converters with mono-material barrier film capability are winning requalification contracts first, while legacy multi-layer suppliers are losing shelf-stable food and pharmaceutical accounts to competitors that moved earlier on recyclable substrate development.
Market Impact: Adds 5.8% fraud-driven format churn
Pharmaceutical Serialization Mandates Lock In Smart Labels

The US Drug Supply Chain Security Act and the EU Falsified Medicines Directive require unit-level serialization and tamper-evidence on prescription pharmaceutical packaging, and both regimes are tightening verification requirements through 2027. Pharmaceutical packagers cannot substitute a cheaper unserialized format even during input cost spikes, which makes this demand segment unusually resistant to the price sensitivity that affects food and consumer goods packaging. Printed sensor and RFID suppliers serving pharmaceutical accounts report multi-year contracts rather than the annual repricing cycles common in food packaging, giving this segment a stability that other applications lack entirely.
Market Impact: Adds up to 4x fee differential

Market Opportunities and Growth Drivers

E-Commerce Returns Drive Tamper-Evident Format Adoption

Global e-commerce parcel volume keeps growing faster than store-based retail, and returns fraud tied to non-tamper-evident packaging cost US retailers an estimated 5.8% of returned merchandise value in 2025 according to National Retail Federation data. Brand owners are responding by specifying tamper-evident seals, QR-verified authenticity codes, and single-use security tape across categories that never needed it before, from cosmetics to consumer electronics accessories. Packaging converters serving e-commerce-heavy brand owners are seeing faster format churn than their store-retail counterparts, since online sellers requalify packaging annually to chase fraud reduction targets rather than the multi-year cycles typical of shelf-stable retail packaging.
Market Impact: Raises bill-of-materials cost 20% during spikes

Extended Producer Responsibility Fees Reward Recyclable Design

Extended producer responsibility schemes now operating in the EU, UK, and several US states charge brand owners eco-modulated fees based on recyclability, with non-recyclable multi-layer formats paying penalty rates two to four times higher than mono-material equivalents in markets like France and Spain. That fee gap is large enough to change packaging engineering decisions on its own, independent of any consumer-facing sustainability marketing benefit. Brand owners running high packaging volumes are building dedicated substrate-conversion budgets specifically to avoid EPR penalty tiers, and converters that can demonstrate recyclability certification are commanding better contract terms than those relying on recycled-content claims alone.
Market Impact: Delays adoption 9 to 14 months

Market Restraints and Challenges

Resin and Specialty Film Cost Volatility

Smart packaging bills of materials depend heavily on polyethylene and polypropylene resin plus specialty barrier films, and both categories saw price swings exceeding 20% during 2022 and 2023 as feedstock costs tracked crude oil. The root cause is thin global specialty-film capacity concentrated among a handful of producers, leaving converters with little buffer when a single plant outage tightens supply. Mid-tier brand owners absorb this volatility worse than scale players, since they lack the purchasing volume to negotiate fixed-price contracts. Several converters are now qualifying bio-based and recycled-content resin blends to reduce virgin polymer exposure.
Market Impact: Accelerates conversion timeline by 24 months

Requalification Costs Slow Small Brand Adoption

Qualifying a new smart or active packaging format costs a mid-size brand owner US$150,000 to US$400,000 in tooling, line trials, and regulatory testing, and the process typically takes nine to fourteen months. The root cause is that most converting lines were built for static formats and need retrofitting to handle printed electronics or embedded sensors reliably at production speed. Smaller brand owners without dedicated packaging engineering teams often cannot absorb that cost or timeline, so they delay adoption until a retailer mandate forces the issue. Some converters now offer shared qualification programs to spread tooling costs across smaller brand clients.
Market Impact: Adds multi-year contract stability, 27%
3 additional market trends, 3 additional growth drivers, and 2 additional restraints and challenges are covered in the full report. Contact sales@marketmindsadvisory.com to access the complete intelligence.

Segment CAGR and Growth Architecture

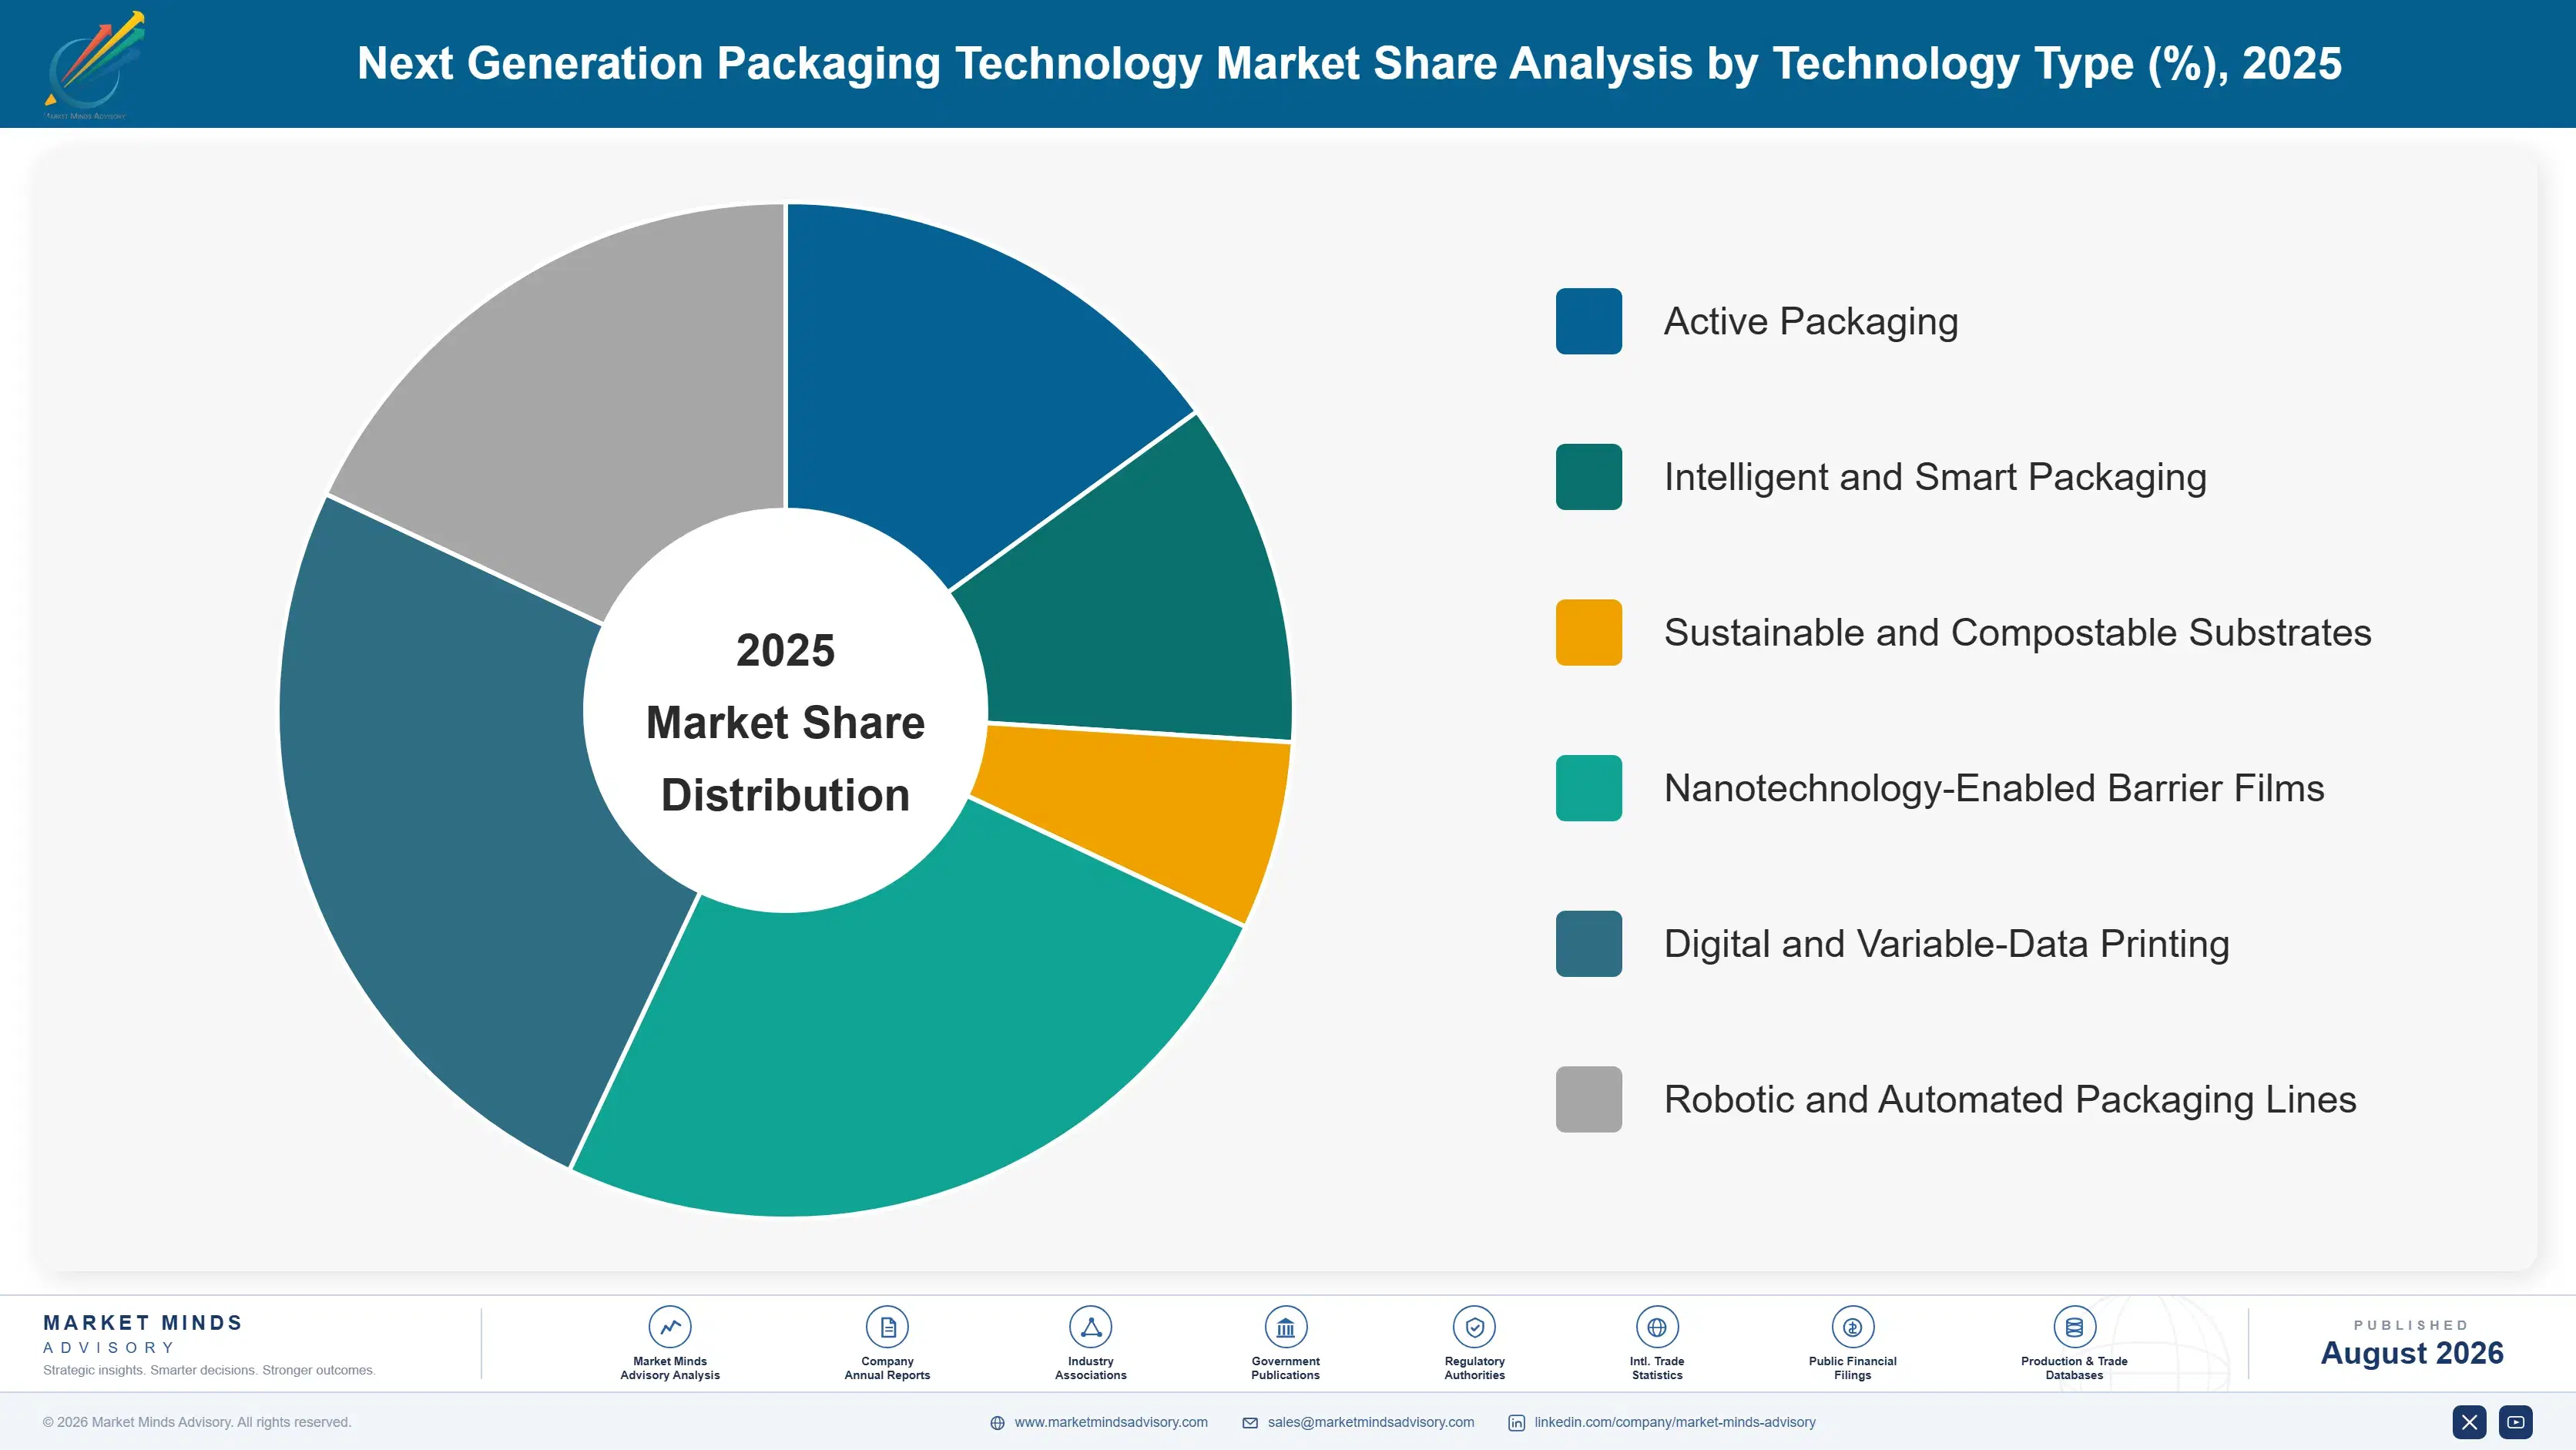
This report segments the next generation packaging technology market by underlying technology type across active, intelligent, sustainable substrate, nanotechnology barrier, digital printing, and robotic automation categories. Technology type was chosen over end-use application because purchasing decisions and capital investment follow converting-line capability rather than the finished product category a brand owner ultimately sells into retail channels.
next-generation-packaging-technology-market-market-share-analysis-1787301193592

Intelligent and Smart Packaging

Intelligent and smart packaging, covering printed sensors, RFID and NFC tags, and connectivity-enabled labels, is growing fastest in the category at 12.8% annually, roughly 36% faster than the market average. Pharmaceutical serialization mandates and cold-chain food logistics are the two demand anchors, since both require unit-level tracking that older barcode systems cannot deliver reliably across a multi-party supply chain. Retailers are increasingly specifying shelf-life sensors on fresh and chilled categories after losing margin to spoilage-driven markdowns, and that requirement is now spreading from produce into seafood and dairy. Converters that already run RFID-capable printing lines are winning this business fastest, since qualifying new equipment mid-contract is slower than expanding existing capacity.
CAGR 12.8%

Sustainable and Compostable Substrate Technology

Sustainable and compostable substrate technology, the second-fastest segment at 11.5% annually, covers mono-material recyclable films, compostable flexible pouches, and fiber-based barrier coatings replacing multi-layer plastic laminates. Extended producer responsibility fee schedules in the EU and several US states are the primary driver, since non-recyclable formats now carry penalty rates several times higher than certified recyclable equivalents. Food and personal care brand owners are requalifying packaging portfolios years ahead of regulatory deadlines to avoid both the fee exposure and reputational risk of appearing to lag on sustainability commitments. Supply remains constrained because certified compostable barrier coatings are produced by a small number of specialty chemical suppliers, creating a bottleneck that is only easing as new capacity comes online through 2027.
CAGR 11.5%
Full segment breakdown across 6 segments available in the complete report.

Regional Architecture and Country Demand Map

East Asia leads on converting capacity and adoption speed, with North America and Western Europe close behind on regulatory-driven demand. South Asia and Pacific is expanding fastest off a smaller base, while Latin America, the Middle East and Africa, and Eastern Europe remain net importers of finished smart packaging technology.

North America

US retailers are the ones forcing the pace here, not regulators. Walmart, Kroger, and Target have each added supplier scorecard requirements for tamper-evident or freshness-indicating packaging on private-label perishables since 2024, converting a nice-to-have into a listing condition for any supplier that wants shelf space in those categories. Pharmaceutical serialization compliance under the Drug Supply Chain Security Act adds a second, steadier demand layer that does not depend on any single retailer's procurement policy. Canada is following a similar path through its own extended producer responsibility rules taking effect province by province. Mexico's role is mostly as a nearshoring production base for US-bound converted packaging rather than as an end demand market, given its developing retail formalization.
Share: 24% | CAGR: 8.6% (2026 to 2036)

Western Europe

Regulation does the heavy lifting in Western Europe. The EU Packaging and Packaging Waste Regulation and national extended producer responsibility schemes in Germany, France, and Italy are pushing brand owners toward mono-material recyclable structures faster than in any other region, and compliance deadlines rather than consumer demand are setting the adoption timeline. Germany's converting sector, anchored by companies with deep packaging engineering capability, is positioning itself as the qualification hub that pan-European brand owners use to requalify formats once rather than market by market. The UK runs a parallel but separate extended producer responsibility scheme post-Brexit, adding a second compliance track that brand owners selling across both markets must satisfy independently.
Share: 20% | CAGR: 7.8% (2026 to 2036)
Regional intelligence for 5 additional markets available in the complete report: East Asia, South Asia and Pacific, Latin America, Middle East and Africa, Eastern Europe. Contact sales@marketmindsadvisory.com.
next-generation-packaging-technology-market-country-cagr-analysis-1787301194162

Where Packaging Technology Margins Concentrate

Margin in this market sits less in the base substrate and more in the qualification relationship, the certification stamp, and the data layer riding on top of the physical package. Four levers explain most of the gap between commodity converters and specialty suppliers capturing premium pricing across smart, active, and compliant packaging formats today.

Owning the Long-Term Retailer Qualification Relationship

Once a converter passes a major retailer's qualification process for tamper-evident or freshness-indicating packaging, it typically holds that account for five to seven years, since requalifying a new supplier costs the retailer time and risk it rarely wants to repeat. Suppliers embedded in a scorecard relationship see 15 to 20% better pricing than transactional competitors bidding purely on unit cost, because the retailer values continuity of compliance documentation over marginal price differences. This dynamic rewards early movers into a retailer's approved vendor list, since later entrants must displace an incumbent rather than compete for open volume.
Market Impact: Adds 15-20% pricing premium over transactional suppliers consistently

Certifying Recyclability Ahead of Regulatory Deadlines

Third-party recyclability certification, through bodies like the Association of Plastic Recyclers or the EU's Harmonized Recyclability Assessment, has become a pricing lever rather than just a compliance checkbox. Brand owners will pay a documented 8 to 12% premium for certified mono-material formats because that certification transfers directly into avoided extended producer responsibility penalty fees, which often exceed the premium within eighteen months. Converters that invested early in certification testing capability are now the preferred bidders for brand owners facing a 2027 or 2030 compliance deadline, since six-to-nine-month certification lead times leave late movers unable to catch up before deadlines bite.
Market Impact: Avoided EPR penalties exceed 12% of premium cost

Bundling Data Services With Physical Packaging

Printed sensors and RFID tags generate shelf-life, location, and authentication data that brand owners want packaged as a subscription analytics service rather than a one-time hardware sale. Suppliers offering a combined hardware-plus-data-platform contract capture 25 to 30% more total account value than those selling tags alone, since the data service carries software-like margins above the physical component's margin profile. Avery Dennison is building out these platforms to capture recurring revenue that persists even as unit hardware pricing compresses under competitive pressure, turning a one-time packaging sale into a multi-year account relationship with renewal economics closer to enterprise software.
Market Impact: Captures an added 25-30% in total account value

Consolidating Regional Converting Capacity Through Acquisition

Scale converters are acquiring regional specialty film and printed electronics capability rather than building it organically, since organic qualification timelines of twelve to eighteen months are slower than closing an acquisition of an already-qualified supplier. Recent deal multiples for specialty packaging technology targets have run 9 to 11 times EBITDA, above the 6 to 7 times typical for commodity converting assets, reflecting the premium buyers place on pre-qualified relationships. This wave is compressing the number of independent mid-tier specialty converters, and those that remain independent do so because they hold a defensible technology position acquirers cannot easily replicate internally.
Market Impact: Deal multiples reach 9 to 11 times EBITDA

Who Controls the Margin Pool

CR5 concentration sits at 34%, low enough that no single player sets category pricing. Amcor and Sealed Air lead on scale and balance sheet capacity to fund qualification programs, but the gap to the next tier of challengers, including Mondi and Constantia Flexibles, has narrowed as smart-label and recyclable-film technology becomes available through licensed platforms rather than proprietary development.
Competitive activity plays out on three fronts. Recyclable mono-material film development is the most visible, with nearly every major converter announcing a compliant substrate platform since 2024. Printed electronics integration is the second front, where suppliers partner with specialist electronics firms rather than building capability internally. Pricing on standard formats keeps compressing as capacity comes online, pushing scale players to defend margin through certification and data-service layers.

Pressure is building from two directions that rankings have not caught up with. Asian converters, particularly in China and South Korea, are exporting qualified capacity into markets that used to be served locally, undercutting regional mid-tier suppliers on price while matching their certification credentials. At the same time, specialist printed-electronics firms without packaging heritage are entering through partnership rather than acquisition, and several have displaced incumbent RFID suppliers on major pharmaceutical accounts recently.
next-generation-packaging-technology-market-company-positioning-matrix-1787301194700

Competitive Moat and Risk Dimensions

AMCOR PLC

Moat: Global Qualified Converting Scale

Amcor operates qualified converting lines across more than 40 countries, giving it the footprint capable of serving a multinational brand owner's global packaging specification from a single supplier relationship. That scale lets Amcor absorb qualification costs that smaller specialists cannot spread across comparable volume, reinforcing its position on the largest global accounts.
AMCOR PLC

Risk: Legacy Multi-Layer Format Exposure

A meaningful share of Amcor's existing installed base still runs legacy multi-layer laminate formats that face rising extended producer responsibility penalty exposure as EU rules tighten through 2030. Converting that installed base to mono-material recyclable structures requires capital and line downtime that competes directly against margin in the near term.
SEALED AIR CORPORATION

Moat: Cold-Chain Food Safety Relationships

Sealed Air's decades-long relationships with protein and fresh food processors give it privileged access to cold-chain packaging specification decisions that newer entrants cannot easily win, since food safety qualification for direct food-contact materials carries a multi-year regulatory testing burden few challengers can match quickly, especially across North American and European accounts.
SEALED AIR CORPORATION

Risk: Slower Smart-Label Platform Buildout

Sealed Air has moved more slowly than Avery Dennison and specialist printed-electronics firms into the smart-label and RFID segment, leaving it more exposed to commodity pricing pressure on its core protective packaging lines as that segment grows faster than the categories where Sealed Air is strongest.

Players Tracked

Prominent Players

Amcor plc
Sealed Air Corporation
Avery Dennison Corporation
Sonoco Products Company
Berry Global Group

Other Key Players

Mondi plc
Smurfit WestRock plc
Huhtamaki Oyj
CCL Industries Inc.
Constantia Flexibles Group GmbH
ProAmpac LLC
Klockner Pentaplast Group
Winpak Ltd.
UFlex Limited
Cosmo Films Limited
Schreiner Group GmbH
Multi-Color Corporation
Stora Enso Oyj
International Paper Company
Tetra Pak International SA

Recent Developments

MARCH 2025

Amcor Acquires Recyclable Barrier Film Specialist

Amcor completed the acquisition of a European specialty film producer with proprietary mono-material barrier technology, adding certified recyclable capacity ahead of EU Packaging and Packaging Waste Regulation compliance deadlines. The deal gives Amcor in-house barrier film development capability it previously accessed only through licensing agreements with third-party suppliers.
Signal: Signals a shift toward owning recyclable film IP rather than continuing to license it from third-party specialists.
SEPTEMBER 2025

Sealed Air Signs Multi-Year Supply Agreement With Major Grocer

Sealed Air signed a multi-year supply agreement with a leading North American grocery retailer to provide freshness-indicating packaging across fresh protein and produce private-label lines, replacing a prior multi-vendor sourcing arrangement with a single qualified supplier relationship covering several thousand retail locations across both refrigerated and frozen categories.
Signal: Confirms that retailer scorecard programs are consolidating packaging supply toward fewer, more qualified vendor relationships over time.
JANUARY 2026

Avery Dennison Expands RFID Inlay Production Capacity

Avery Dennison completed an organic capacity expansion at its RFID inlay production facility in Ohio, adding automated printing lines dedicated to apparel and retail item-level tagging as demand from serialization-driven pharmaceutical and grocery categories continues to outpace existing global inlay supply across nearly every major end-use vertical.
Signal: Indicates inlay supply constraints are becoming a bottleneck across pharmaceutical, grocery, and apparel item-level tagging programs.

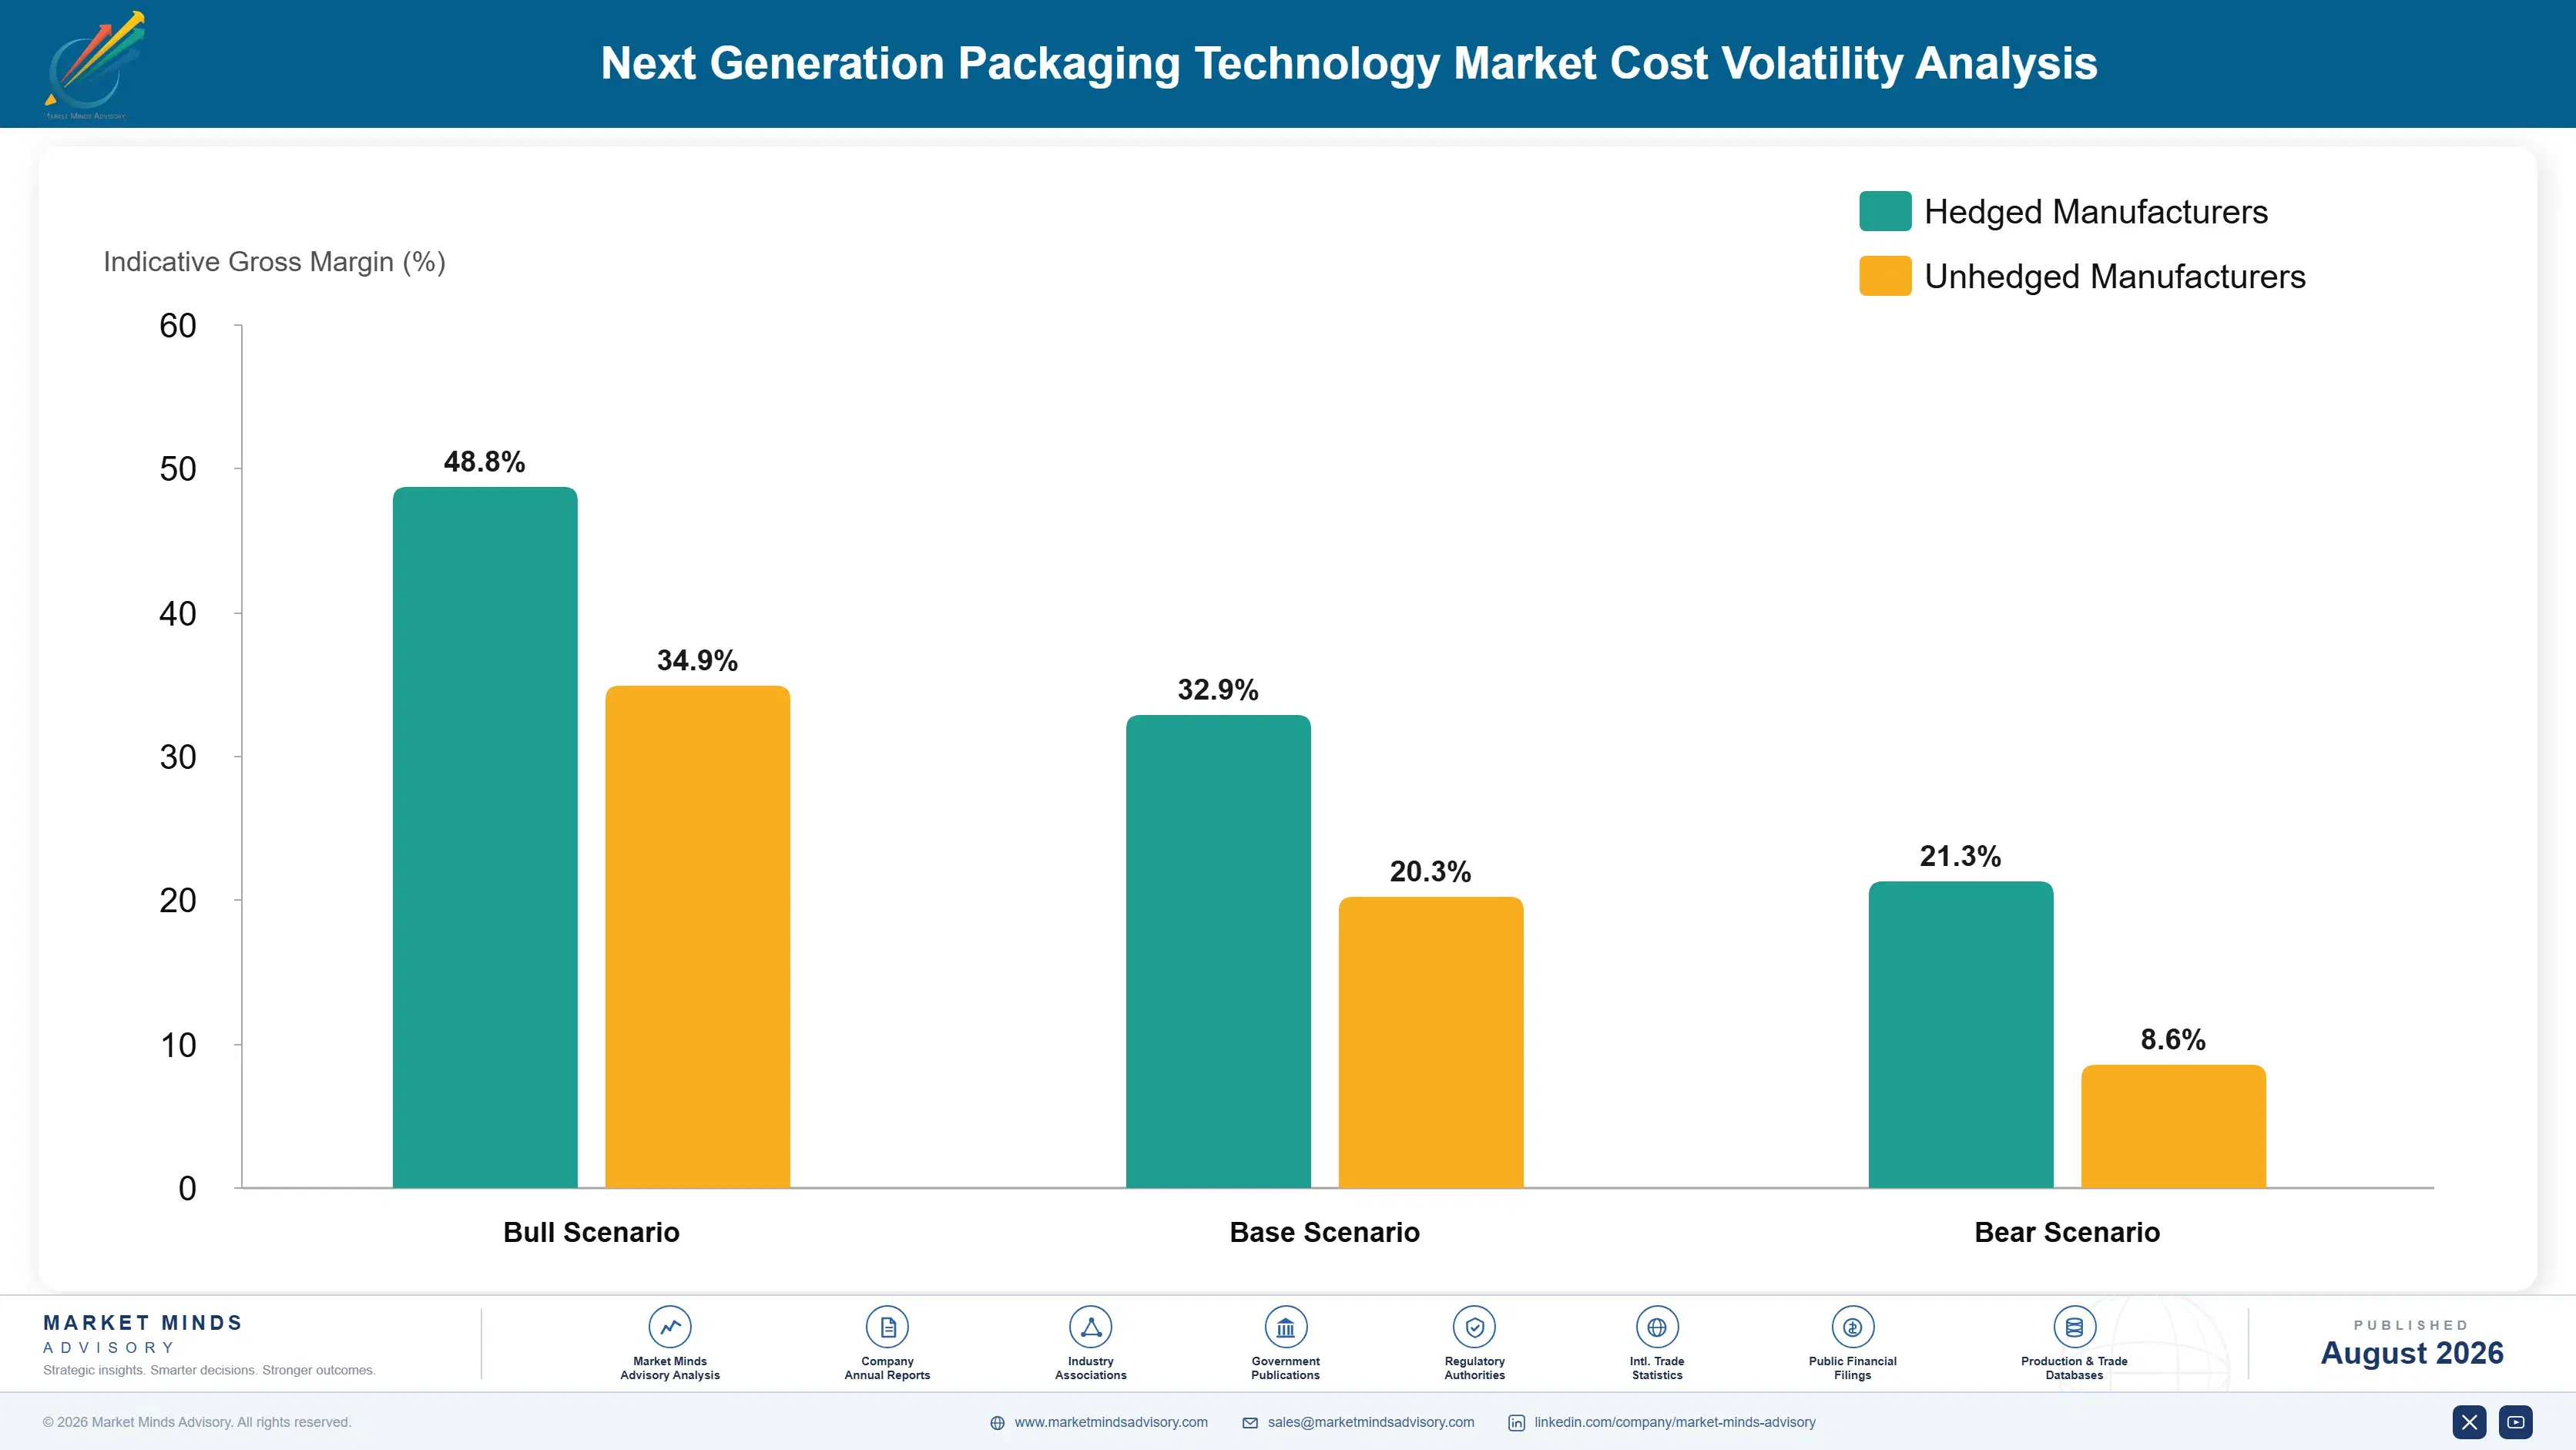
Resin and Specialty Film Exposure

Polymer resin, primarily polyethylene and polypropylene, accounts for 38 to 45% of bill-of-materials cost in flexible smart packaging formats, with specialty barrier films and printed electronics components making up most of the remainder. Virgin resin is sourced predominantly from Gulf Coast and Middle Eastern petrochemical crackers, while specialty barrier films concentrate among a small number of European and Japanese producers with proprietary coating technology.
Polyethylene spot prices rose more than 20% within two quarters during 2022 as naphtha feedstock costs tracked crude oil volatility following the disruption to European gas supply, according to EIA petrochemical feedstock data. That volatility forced several converters to renegotiate fixed-price customer contracts mid-term, and it accelerated brand owner interest in resin substitution and recycled-content blending as a hedge against future feedstock price spikes industry-wide.

Scale converters with global procurement teams hedge resin exposure through longer-dated supply contracts and multi-region sourcing, while mid-tier and regional converters buy closer to spot and absorb more margin volatility. European converters carry additional exposure through natural gas-linked feedstock costs that Gulf Coast-based competitors do not face at the same intensity, giving North American converters a durable input cost advantage on commodity resin grades.
next-generation-packaging-technology-market-cost-volatility-analysis-1787301194897

Diversifying Resin Sourcing Across Multiple Feedstock Regions

Converters are qualifying resin suppliers across North America, the Middle East, and Southeast Asia simultaneously rather than relying on a single feedstock region, reducing exposure to any one geopolitical or weather-driven supply disruption. This multi-region qualification adds procurement complexity but has measurably reduced the price swings passed through to customers during recent volatility episodes.

Expanding Recycled and Bio-Based Resin Content

Blending recycled and bio-based resin into flexible film formulations reduces dependence on virgin petrochemical feedstock pricing while also helping brand owners meet recycled-content mandates. Supply of certified food-grade recycled resin remains limited, so this mitigation works best combined with, rather than instead of, broader multi-region sourcing diversification efforts already underway across most major converting regions.

Locking Multi-Year Fixed-Price Supply Contracts

Larger converters are negotiating multi-year fixed-price or collared pricing agreements directly with resin producers, trading some upside if prices fall for protection against sudden spikes. Smaller converters without comparable purchasing volume typically cannot access these terms and remain more exposed to spot market volatility as a result, particularly during periods of acute feedstock disruption.

Portfolio Architecture for Margin Defence

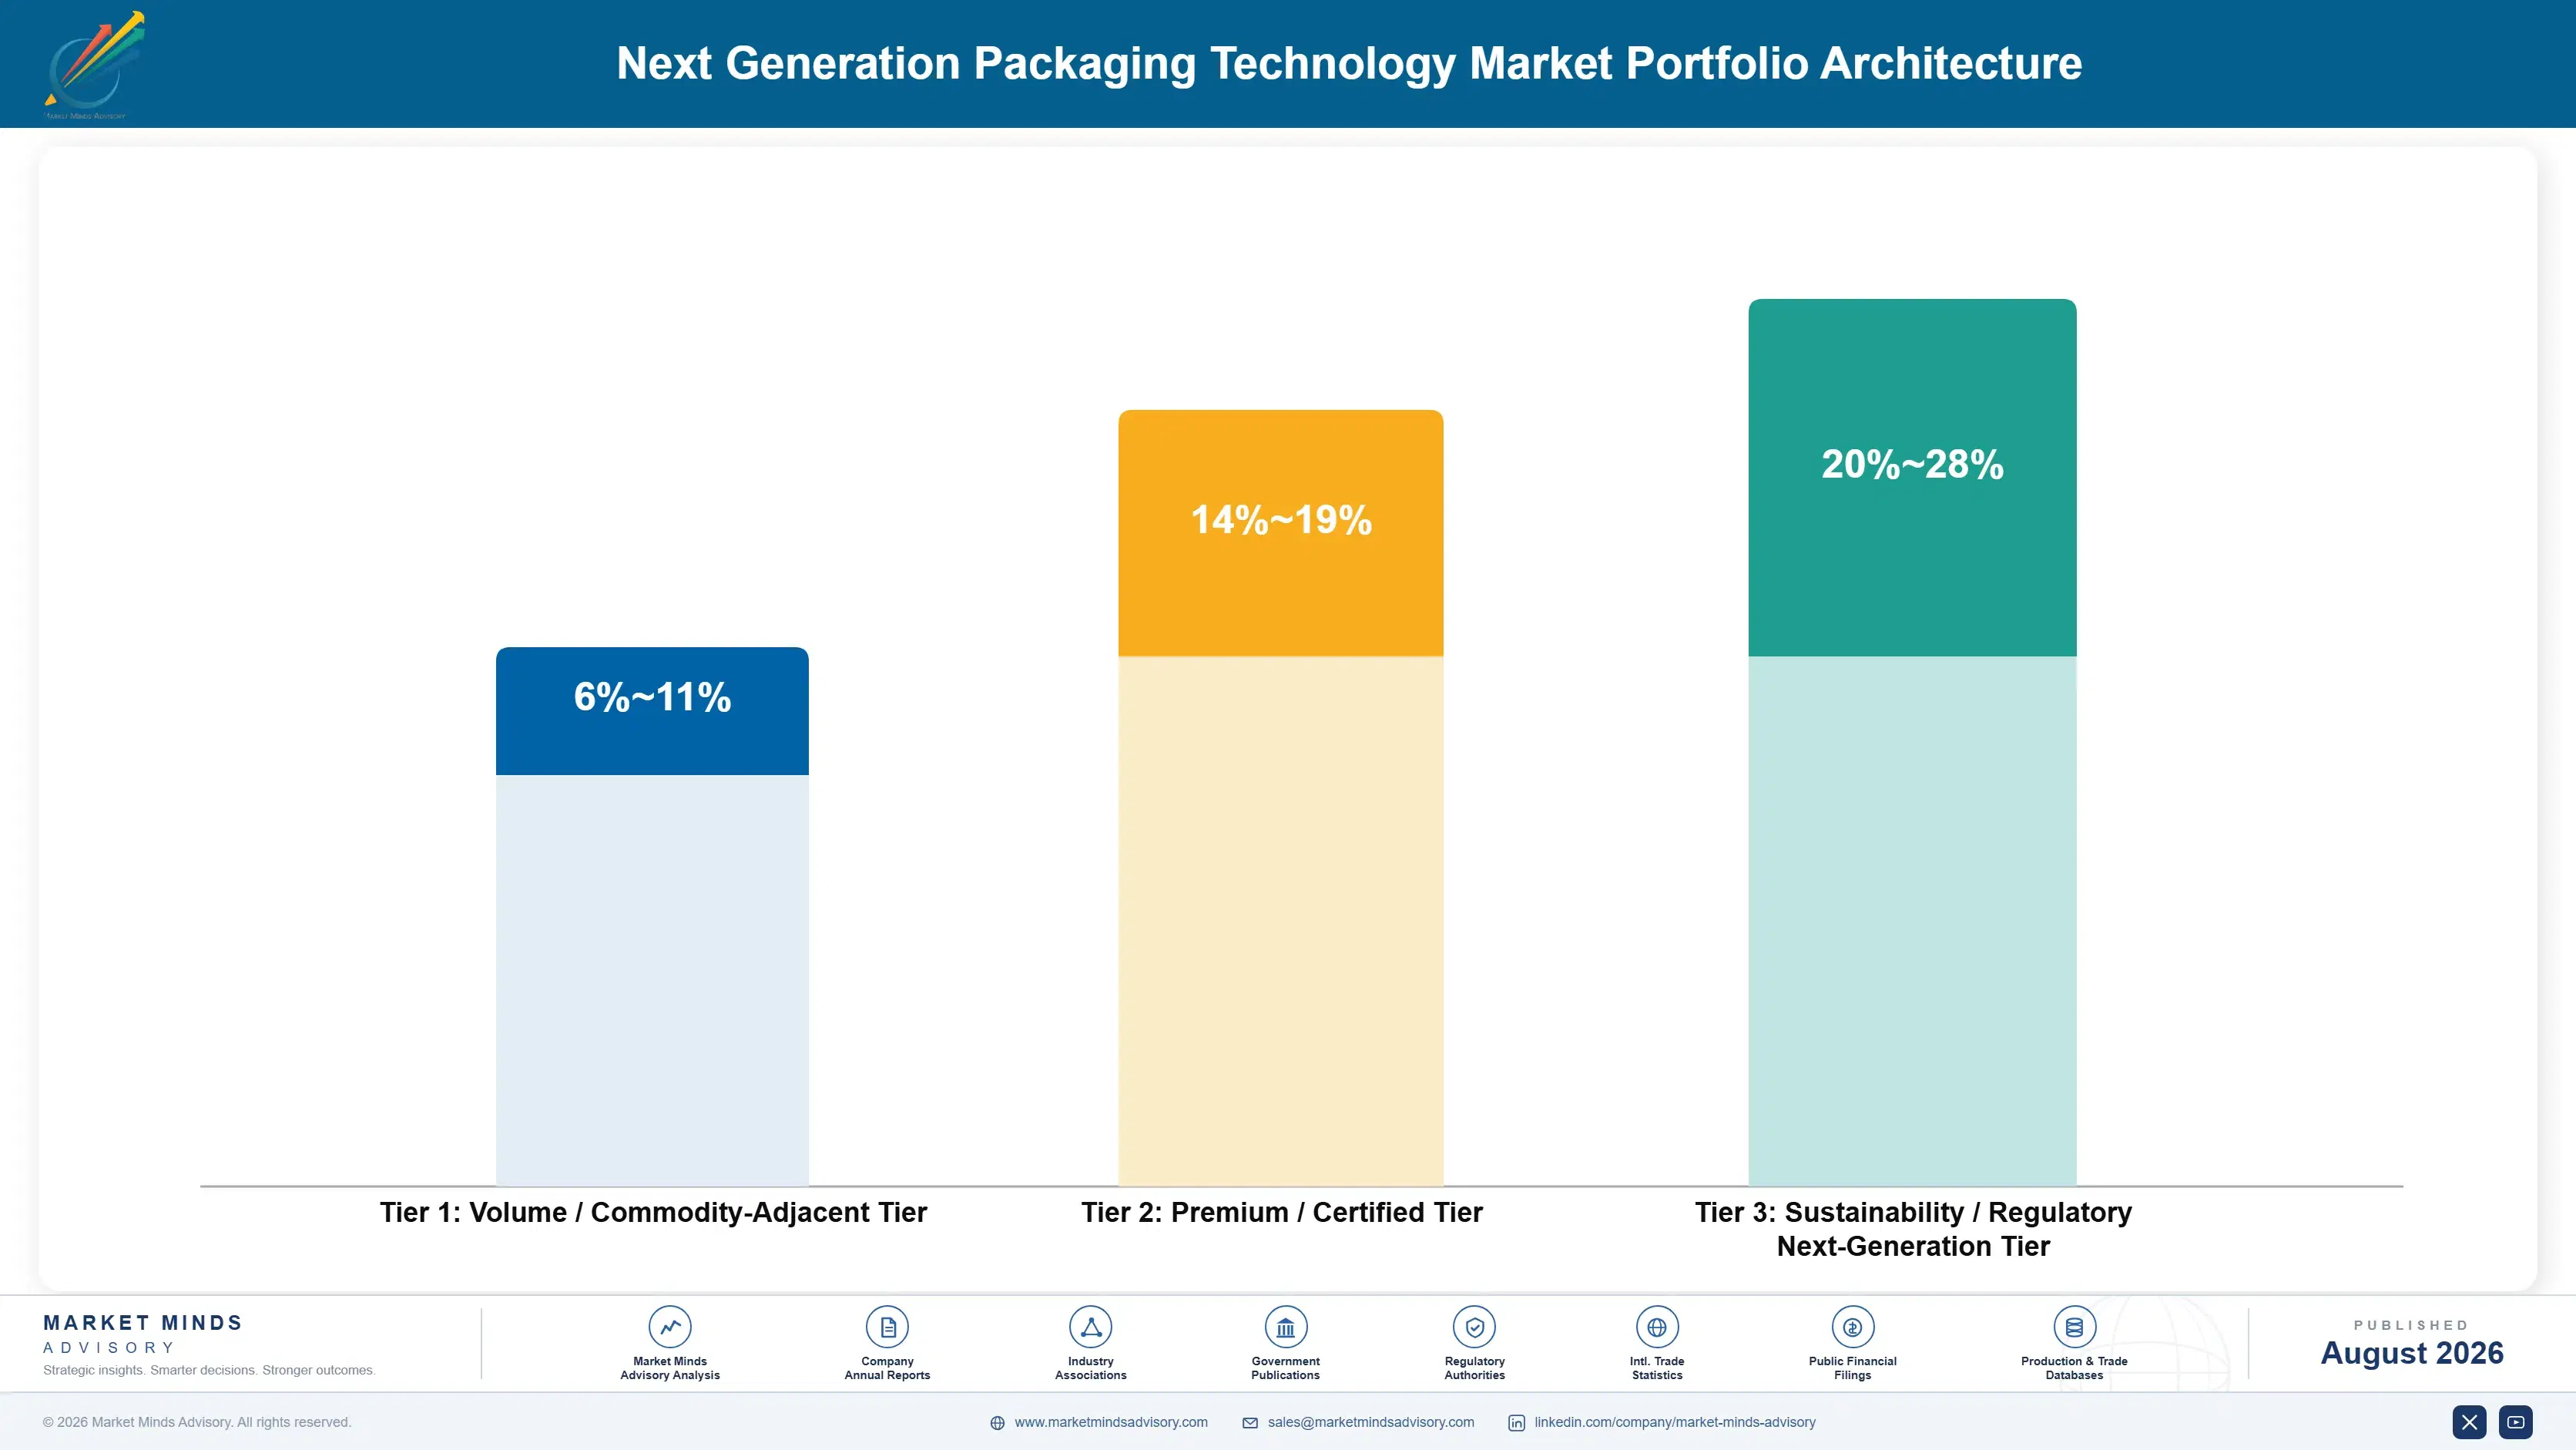
Portfolio economics split cleanly into three tiers. Volume commodity-adjacent packaging, still the largest revenue pool by unit count, runs on thin single-digit-to-low-teens margins driven by resin cost pass-through and intense price competition among regional converters. Premium and certified formats, carrying recyclability or food-safety certification, command meaningfully better margins because brand owners pay for documentation and compliance assurance as much as for the physical material it
The tension between volume and premium runs deep, since most converters cannot serve both segments on the same production line without dedicated tooling, forcing a choice about where to allocate capital. Sealed Air and Amcor run parallel production tracks specifically to avoid contaminating high-margin certified lines with commodity-grade changeovers that slow qualification renewal timelines across their most sensitive certified product lines.

High-value pools concentrate in sustainability and regulatory next-generation formats, where certification scarcity and regulatory deadline pressure both support pricing power that ordinary commodity converting cannot replicate. That is also where capital is flowing fastest, as scale players acquire the specialty capability needed to defend margin as commodity tiers keep compressing under competitive volume growth across nearly every major packaging category worldwide.

Volume / Commodity-Adjacent Tier

Standard flexible and rigid packaging without embedded sensing or specialty barrier technology, priced primarily on resin cost pass-through and competing mainly on production efficiency and delivery reliability across high-volume retail categories.
Gross Margin: 6-11%

Premium / Certified Tier

Recyclability-certified mono-material structures and validated food-safety barrier formats carrying documentation brand owners need to meet retailer scorecards and extended producer responsibility compliance across regulated food, personal care, and pharmaceutical categories.
Gross Margin: 14-19%

Sustainability / Regulatory / Next-Generation Tier

Compostable substrates, printed sensor and RFID-enabled smart packaging, and next-generation barrier chemistries addressing 2027 to 2030 regulatory deadlines, where certification scarcity and early-mover technical advantage both support the strongest pricing power in the category.
Gross Margin: 20-28%
next-generation-packaging-technology-market-portfolio-architecture-1787301195409

High-value Sub-segments and Strategic Watch-out

RFID-Enabled Pharmaceutical Smart Labels

Serialization mandates under the Drug Supply Chain Security Act and EU Falsified Medicines Directive make this segment demand-inelastic and high-margin simultaneously, since pharmaceutical packagers cannot substitute a cheaper unserialized format, and multi-year contracts insulate suppliers from repricing common elsewhere in the broader packaging technology category.
Gross Margin: 24-30%

Certified Recyclable Barrier Films

Mono-material recyclable barrier film demand is growing steadily as EU and California extended producer responsibility deadlines approach, commanding a durable premium over legacy multi-layer laminate, and supply remains tight enough that certified converters can hold pricing through 2027 even as overall category volume growth moderates.
Gross Margin: 16-21%

Standard Flexible Food Packaging

Conventional flexible pouches and films for shelf-stable food remain the largest unit-volume segment by far, competing mainly on resin cost efficiency and delivery reliability rather than technology differentiation, with margins steadily compressed by intense regional competition among converters chasing volume rather than durable premium positioning.
Gross Margin: 7-10%

Legacy Multi-Layer Laminate Formats

Multi-layer laminate formats face rising extended producer responsibility penalty exposure as EU and state-level rules tighten through 2030, and converters with heavy legacy exposure risk losing accounts to recyclable-format competitors faster than they can retool existing production lines to match rapidly evolving compliance requirements industry-wide.
Gross Margin: 5-9%

Where Packaging Demand Repeats

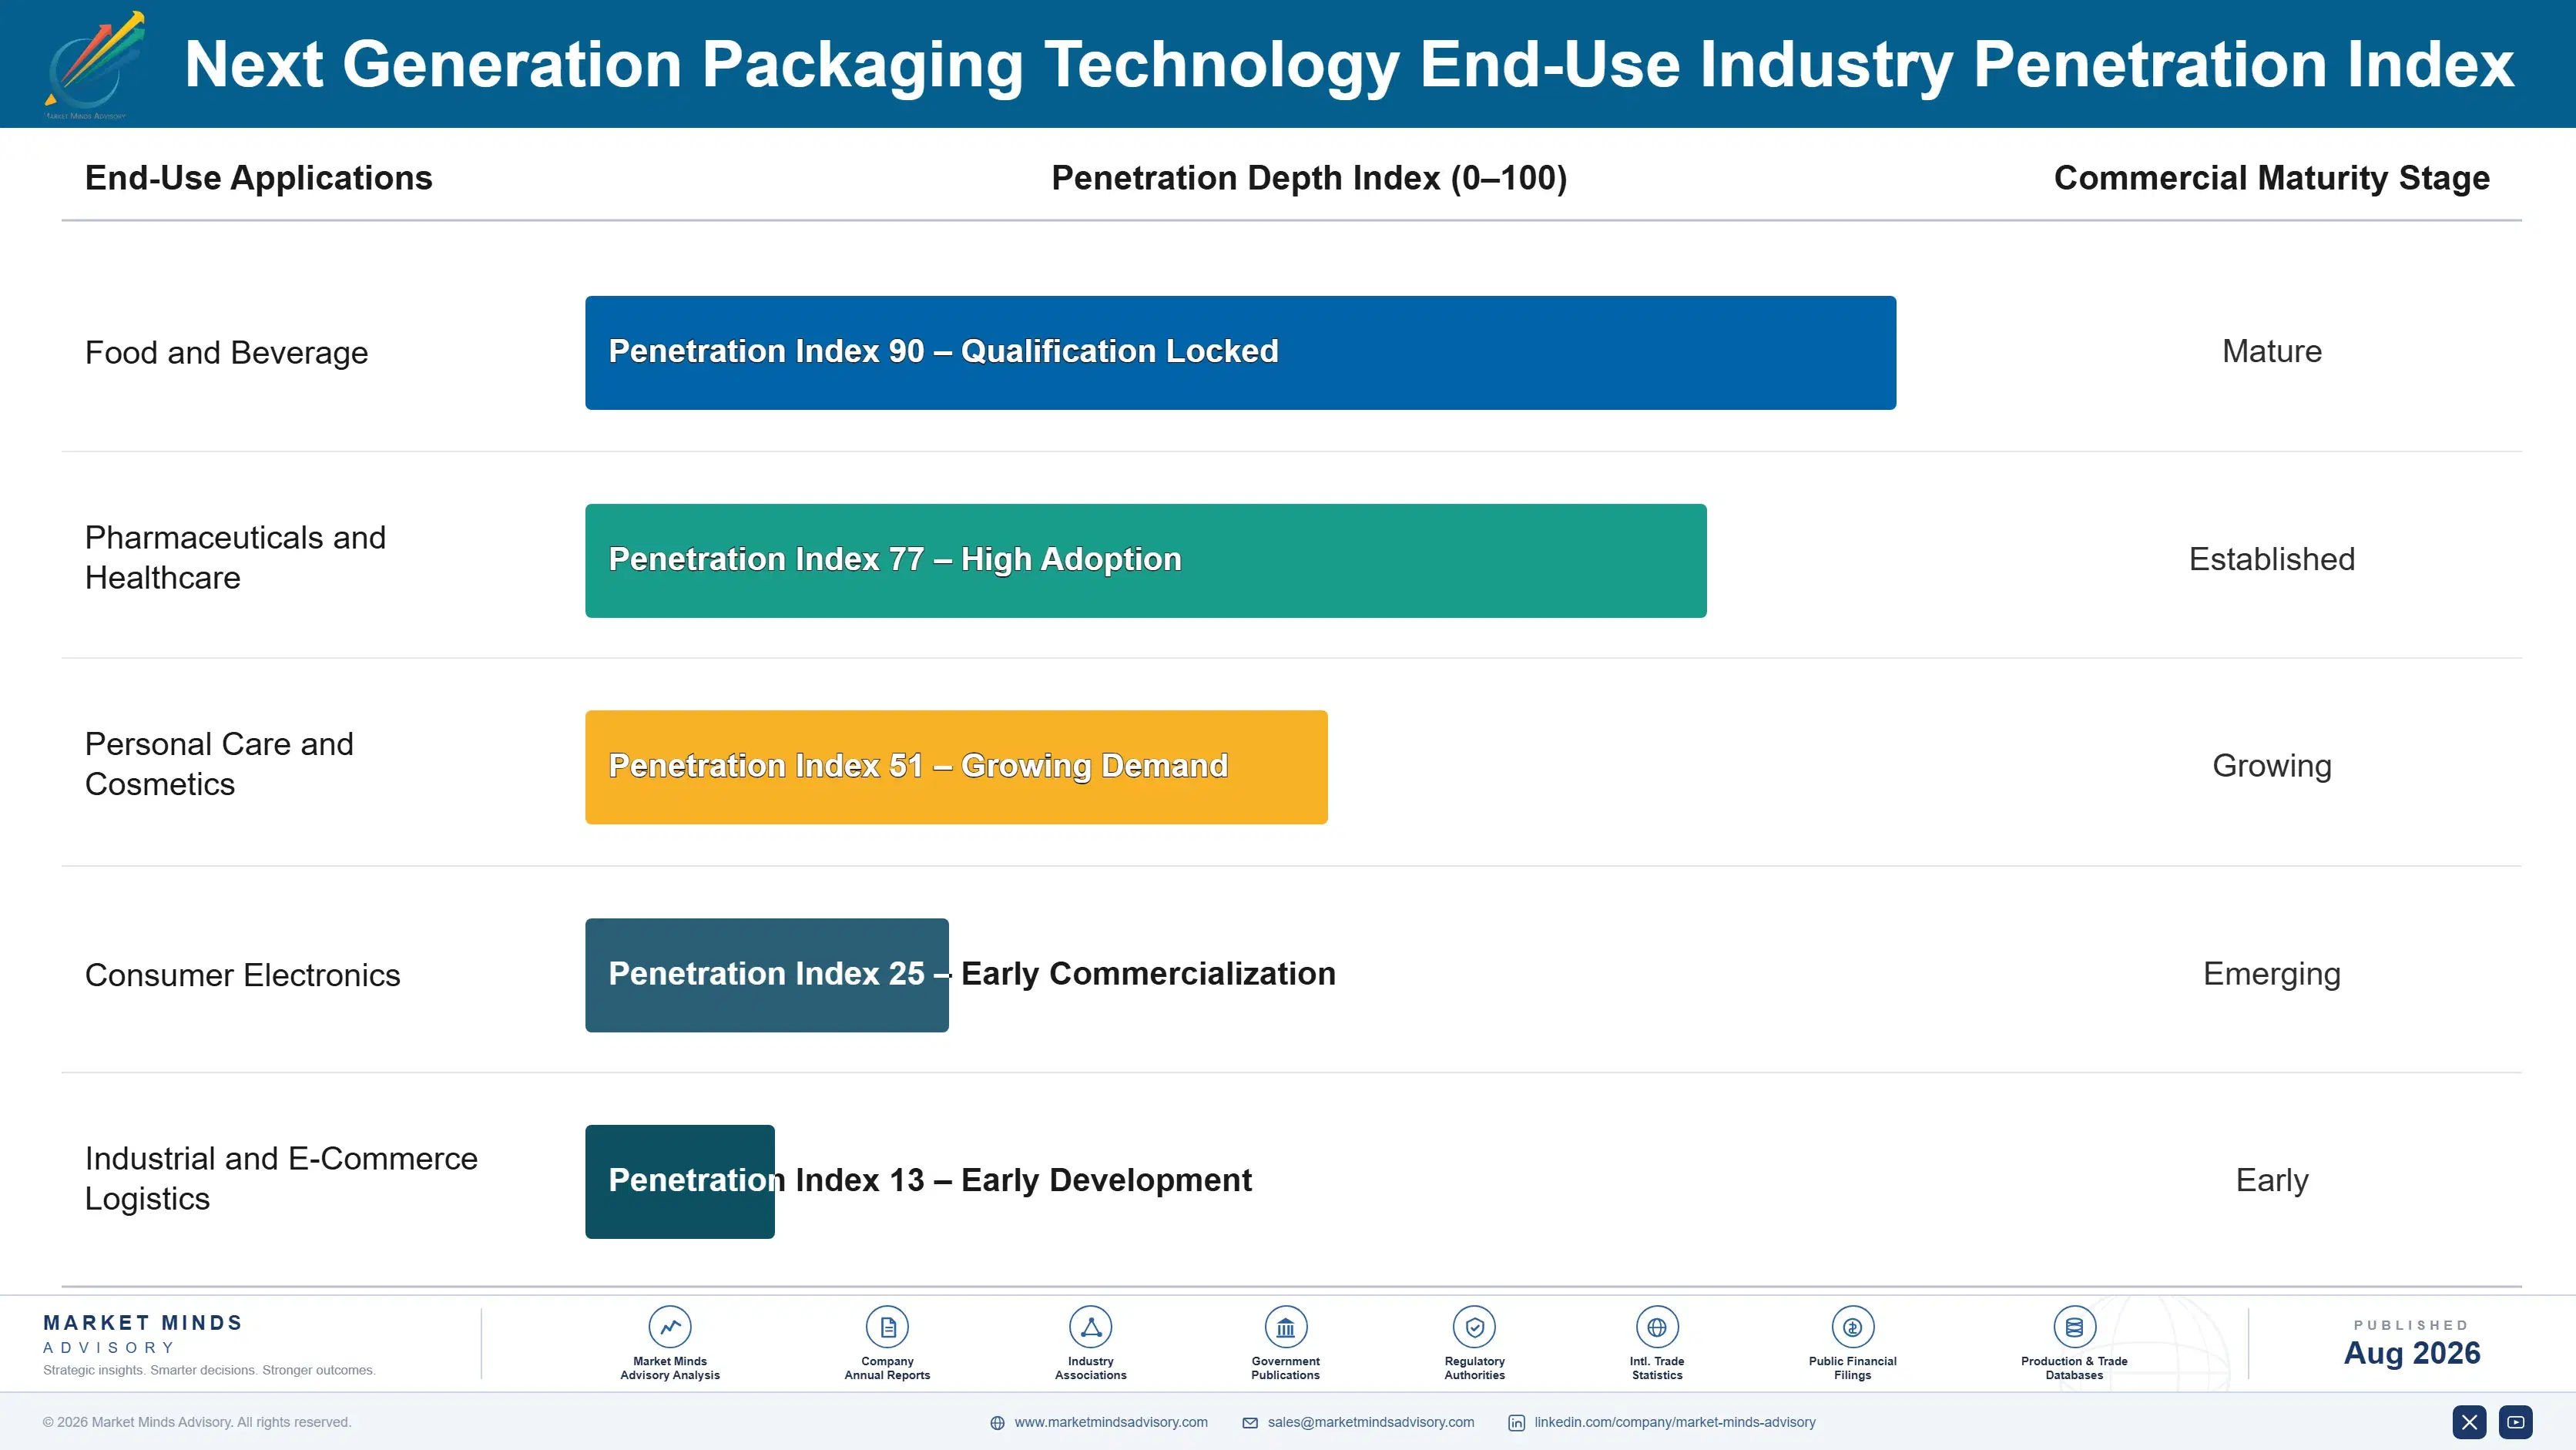
Packaging is a repeat-purchase category by nature, but the technology layer adds a second annuity on top of the physical reorder: data service subscriptions, sensor licensing, and certification renewal fees that recur independent of unit volume. Suppliers that capture both the physical reorder and the data-service relationship see far more predictable revenue than those selling hardware alone without any recurring service commitment attached.
Pharmaceutical adoption is the stickiest, since serialization requirements are now embedded in regulatory approval pathways that a brand owner cannot easily unwind once qualified. Food and beverage adoption is deep but price-sensitive, with buyers willing to switch suppliers for meaningful cost savings once a format is validated. Cosmetics and consumer electronics adoption remains shallower, concentrated among premium brand owners rather than spread across entire category volume.

Packaging procurement is shifting from pure cost-per-unit purchasing toward sustainability and data-capability scoring, a change driven by a newer generation of brand-side procurement and sustainability officers who now sit jointly on packaging decisions that used to belong to procurement alone. That shift is reshaping which suppliers even get invited to bid in the first place at all.
next-generation-packaging-technology-market-end-use-penetration-index-1787301195906

What Wins in Packaging Technology

These are among the four positions where our research anticipates prominent divergence between winners and laggards over the coming forecast period. Each is grounded in the demand model, the regulatory perimeter, and the announced capacity pipeline.
01 / REGULATORY COMPLIANCE TIMING

Move on recyclable substrates before 2027 deadlines force reactive requalification

Brand owners that requalify packaging formats ahead of EU and California extended producer responsibility deadlines capture measurably better converter pricing and avoid the compressed timelines that hit late movers. Waiting until penalty fees bite forces requalification under time pressure, which narrows supplier choice and raises qualification costs by a wide and unpredictable margin. Early movers are also better positioned to win retailer scorecard preference before that becomes a baseline requirement across every major food, pharmaceutical, and personal care category simultaneously.
02 / TECHNOLOGY PLATFORM INVESTMENT

Build data-service capability, not just hardware, to defend margin

Suppliers that sell printed sensors or RFID tags as a one-time hardware purchase are competing purely on unit price, a race that specialty converters and low-cost Asian manufacturers will eventually win on cost alone. Bundling data analytics, authentication services, and certification renewal into a subscription-like relationship changes the competitive basis entirely, since brand owners are paying for an outcome rather than a component. The suppliers building this capability now, rather than waiting for margin compression to force the issue, will hold pricing power longer than pure hardware competitors.
03 / REGIONAL CAPACITY STRATEGY

Diversify converting capacity beyond China to manage concentration risk

Brand owners that source the bulk of their smart packaging components from a single East Asian region carry meaningful exposure to trade policy shifts, shipping disruption, and single-supplier negotiating leverage that a more diversified footprint avoids entirely. Vietnam, India, and Eastern Europe are emerging as credible secondary sourcing options, though none yet match Chinese converting capability or cost at comparable scale today. Brand owners building dual-region sourcing now will have more negotiating leverage and supply resilience than those that wait for a disruption to force the issue.
04 / CERTIFICATION INVESTMENT WINDOW

Invest in third-party recyclability certification before it becomes table stakes

Recyclability certification currently differentiates suppliers and commands a measurable pricing premium, but that advantage has a limited shelf life as certification becomes a baseline market entry requirement rather than a genuine differentiator. Converters that invest in certification testing capability now capture premium pricing while the advantage still exists, rather than paying for the same certification later purely to remain eligible for retailer bids. The window for certification to function as competitive advantage, rather than table-stakes compliance, likely closes within the next three to four years.

Engagement Snapshot From the Field

A live engagement with an industry participant carrying material or product regulatory and market exposure ahead of a defining policy shift, showing how our research translates into a defensible multi-year portfolio strategy.
MARKET MINDS ADVISORY · CLIENT ENGAGEMENT SUMMARY
Next Generation Packaging Technology Producer Strategic Portfolio Review and Transition Roadmap 2026·Investment Scenario on Next Generation Packaging Technology Exposure Evaluation 2025-26
CLIENT PROFILE
The client is a multinational consumer packaged goods manufacturer with packaging spend exceeding US$800 million annually (client-reported, unverified by MMA) across food, personal care, and household categories sold in more than 60 countries. The company operates a mix of owned and outsourced converting relationships and was facing simultaneous EU extended producer responsibility deadline pressure and rising retailer scorecard requirements for tamper-evident formats across its North American private-label accounts.
STRATEGIC CHALLENGE
The client needed to requalify a significant share of its packaging portfolio for recyclability compliance within an 18-month window while simultaneously adding tamper-evident features to meet new retailer requirements, without disrupting existing supply relationships or triggering a wave of simultaneous converter requalification costs across its entire supplier base, spanning more than a dozen regional converting partners.
MMA APPROACH
MMA conducted a portfolio-wide segmentation of the client's packaging formats by regulatory exposure and requalification complexity, then built a phased conversion roadmap that sequenced the highest-penalty-risk formats first. The engagement combined primary interviews with the client's converter base and comparative benchmarking against peer packaging spend and format mix across the same product categories.
KEY FINDINGS
  1. Roughly 40% of the client's packaging volume by weight sat in multi-layer laminate formats facing the highest EU penalty exposure, concentrated in three product categories representing a disproportionate share of total packaging spend.
  2. Converter capacity for mono-material recyclable alternatives was available but required an average qualification lead time of 11 months, longer than the client's original six-month internal conversion target assumed.
  3. Retailer scorecard requirements for tamper-evident packaging overlapped meaningfully with the recyclability conversion roadmap, allowing the client to combine two separate compliance projects into one converter requalification cycle.
  4. Peer benchmarking showed the client's packaging technology spend as a share of COGS trailed category leaders by roughly 1.5 percentage points, indicating room for margin-neutral premium format investment.
CLIENT PROFILE
The client is a multinational consumer packaged goods manufacturer with packaging spend exceeding US$800 million annually (client-reported, unverified by MMA) across food, personal care, and household categories sold in more than 60 countries. The company operates a mix of owned and outsourced converting relationships and was facing simultaneous EU extended producer responsibility deadline pressure and rising retailer scorecard requirements for tamper-evident formats across its North American private-label accounts.
STRATEGIC CHALLENGE
The client needed to requalify a significant share of its packaging portfolio for recyclability compliance within an 18-month window while simultaneously adding tamper-evident features to meet new retailer requirements, without disrupting existing supply relationships or triggering a wave of simultaneous converter requalification costs across its entire supplier base, spanning more than a dozen regional converting partners.
MMA APPROACH
MMA conducted a portfolio-wide segmentation of the client's packaging formats by regulatory exposure and requalification complexity, then built a phased conversion roadmap that sequenced the highest-penalty-risk formats first. The engagement combined primary interviews with the client's converter base and comparative benchmarking against peer packaging spend and format mix across the same product categories.
KEY FINDINGS
  1. Roughly 40% of the client's packaging volume by weight sat in multi-layer laminate formats facing the highest EU penalty exposure, concentrated in three product categories representing a disproportionate share of total packaging spend.
  2. Converter capacity for mono-material recyclable alternatives was available but required an average qualification lead time of 11 months, longer than the client's original six-month internal conversion target assumed.
  3. Retailer scorecard requirements for tamper-evident packaging overlapped meaningfully with the recyclability conversion roadmap, allowing the client to combine two separate compliance projects into one converter requalification cycle.
  4. Peer benchmarking showed the client's packaging technology spend as a share of COGS trailed category leaders by roughly 1.5 percentage points, indicating room for margin-neutral premium format investment.
RECOMMENDED STRATEGY
Phase 1: Phase 1 (Months 1-4): Segment full packaging portfolio by penalty exposure and requalification complexity, prioritizing the highest-risk multi-layer laminate formats for immediate converter engagement. Phase 2: Phase 2 (Months 5-14): Execute combined recyclability and tamper-evidence requalification with converters, sequencing categories to avoid simultaneous capacity bottlenecks across the supplier base. Phase 3: Phase 3 (Months 15-18): Validate converted formats against retailer scorecards and regulatory certification requirements, then extend the roadmap to remaining lower-priority packaging categories.
OUTCOME
The client converted an estimated 65% of its highest-penalty-risk packaging volume within the 18-month window, avoiding a significant share of projected EU extended producer responsibility fee exposure (client-reported, unverified by MMA). Combining the recyclability and tamper-evidence workstreams reduced total converter requalification events by roughly one third compared to running the two compliance projects sequentially.

Frequently Asked Questions

Foundational context covering the market sizes, CAGR, scope, country, region and competition that inform every finding below. This section is provided to cover basics and most often pre-purchase conversations, answered from the MMA Primary Research Dataset.

What is the current size of the Next Generation Packaging Technology Market?

The market was valued at US$38.6 billion in 2025 and is projected to reach US$42.2 billion in 2026 as adoption accelerates across regulated categories such as pharmaceuticals and fresh food.

How large will the Next Generation Packaging Technology Market be by 2036?

MMA projects the market will reach US$103.6 billion by 2036, roughly 2.46 times its 2026 value, driven by regulatory and retailer-scorecard-led format conversion across food, pharmaceutical, and personal care categories.

What is the CAGR for the Next Generation Packaging Technology Market 2026 to 2036?

The market is projected to grow at a 9.4% CAGR between 2026 and 2036, with a bull case of 10.6% and a bear case of 8.2%.

Which segment is growing fastest?

Intelligent and smart packaging is the fastest-growing segment at 12.8% annually, roughly 36% faster than the category average, driven by pharmaceutical serialization and cold-chain food demand.

Who are the major companies in the Next Generation Packaging Technology Market?

Leading suppliers include Amcor, Sealed Air, Avery Dennison, Sonoco Products, and Berry Global, which together hold roughly a third of category revenue on a disclosed-revenue basis.

Which country is growing fastest?

China leads country-level growth at an estimated 11.8% annually, supported by domestic e-commerce platform requirements and the country's dominant converting capacity base serving export demand.

Report Segmentation Architecture

The full report scope spans multiple orthogonal segmentation dimensions, with cross-tabulated demand data provided for each dimension pair. Coverage extends further to regional breakdowns, trend trajectories, and the competitive detail needed to support segment-level decision-making.

By Technology Type

  • Active Packaging
  • Intelligent and Smart Packaging
  • Sustainable and Compostable Substrates
  • Nanotechnology-Enabled Barrier Films
  • Digital and Variable-Data Printing
  • Robotic and Automated Packaging Lines

By End-Use Industry

  • Food and Beverage
  • Pharmaceuticals and Healthcare
  • Personal Care and Cosmetics
  • Consumer Electronics
  • Industrial and E-Commerce Logistics

By Commercial Dimension

  • Brand Owner Direct
  • Contract Packager
  • Retailer Private Label
  • Distribution Channel

By Region

  • North America
  • Western Europe
  • East Asia
  • South Asia and Pacific
  • Latin America
  • Middle East and Africa
  • Eastern Europe

Scope, Methodology, and Coverage

Every figure in this report is reproducible from documented input assumptions. The scope below maps the historical period, the forecast horizon, the segmentation dimensions, and the countries covered, alongside the underlying primary and qualitative methodology.
Historical Period
2020 to 2025
Forecast Period
2026 to 2036
Base Year
2025 (USD billions; MMA Primary Research Dataset, August 2026)
Market Definition
The Next Generation Packaging Technology market covers active, intelligent, and connected packaging systems, including oxygen scavengers, freshness indicators, printed sensors, RFID and NFC tagging, and recyclable mono-material barrier substrates, sold to brand owners, contract packagers, and converters. It excludes conventional rigid and flexible packaging carrying no embedded sensing, functional barrier innovation, or connectivity beyond standard printing and lamination.
Quantitative Units
USD billions (current prices); volume in billion units where disclosed by segment
Segmentation Dimensions
By Technology Type; By End-Use Industry; By Commercial Dimension; By Region
Regions Covered
North America, Western Europe, East Asia, South Asia and Pacific, Latin America, Middle East and Africa, Eastern Europe
Countries Covered
USA, China, Germany, France, UK, Japan, South Korea, India, Australia, Canada, Brazil, Mexico, Indonesia, Vietnam, Thailand, Malaysia, UAE, Saudi Arabia, South Africa, Nigeria, Turkey, Poland, Netherlands, Italy, Spain, Sweden, Switzerland, Argentina, Colombia, Singapore, and additional markets relevant to this sector
Key Companies Profiled
Amcor plc, Sealed Air Corporation, Avery Dennison Corporation, Sonoco Products Company, Berry Global Group, Mondi plc, Smurfit WestRock plc, Huhtamaki Oyj, CCL Industries Inc., Constantia Flexibles Group GmbH, ProAmpac LLC, Klockner Pentaplast Group, Winpak Ltd., UFlex Limited, Cosmo Films Limited, Schreiner Group GmbH, Multi-Color Corporation, Stora Enso Oyj, International Paper Company, Tetra Pak International SA
Quantitative Methodology
Primary survey, n=3,800 respondents, Q4 2025, six countries; demand-side model with trade association cross-validation
Qualitative Methodology
47 expert interviews, Q4 2025; applied to validate demand model assumptions, identify emerging dynamics, and assess competitive positioning
Report Format
PDF and XLSX data workbook (Word format preview document)
Publisher
Market Minds Advisory
Report Code
MMA-2026-PAC-114
Published
August 2026
Contact
sales@marketmindsadvisory.com | www.marketmindsadvisory.com

Purchase the full Next Generation Packaging Technology Market Report (2026 to 2036).

The full report delivers a complete quantitative and qualitative assessment of the next generation packaging technology market through 2036, including segment-level and country-level forecasts across all seven MMA-tracked regions. It profiles the twenty leading suppliers shaping competitive dynamics, with detailed moat and risk analysis for the top two players and a full development timeline of recent corporate activity. The report includes primary survey data from 3,800 respondents and 47 expert interviews conducted in Q4 2025, alongside a dedicated input cost and regulatory exposure analysis. Buyers receive segmentation, regional, and competitive datasets formatted for direct integration into internal strategic planning models.
Segment and regional forecasts through 2036 inclusive
Competitive profiles of twenty leading global suppliers
Primary survey data from 3,800 global respondents
Expert interview insights from 47 industry practitioners
Input cost and regulatory exposure risk analysis
Editable data tables for internal strategic modeling

Built For The People Who Decide

From boardroom strategy to bench-side execution, this report is read cover-to-cover by leaders shaping the next decade of their industry, turning demand scenarios, market dynamics and valuation benchmarks into decisions.
CXOs/ Presidents/ VPs/ Managers
M&A and Corporate Development
Strategy Teams and R&D Heads
Procurement and Product Directors
Regulatory and Compliance Leaders
Investor Relations and Equity Analysts