Market Minds Advisory
Mining Automation Market

Mining Automation Market: The Pilbara Proved It, Everyone Else Is Catching Up

Australian iron ore proved autonomous haulage works at production scale over a decade ago, and the rest of the industry has spent that decade discovering how hard the retrofit actually is.

Lead Analyst

David Horsley

Published

August 2026

Make Smarter Decisions with Customized Research Insights

Request a free sample report and evaluate market opportunities, growth trends, and competitive dynamics relevant to your business needs.

2025 MARKET VALUE$4.8BMarket Size 2025
2036 FORECAST VALUE$12.9BBase Case , 2026 to 2036
CAGR 2026 TO 20369.4 %Bull 10.7% / Bear 8.2%
INCREMENTAL OPPORTUNITY$7.6BNet 10- year value creation
EXPANSION MULTIPLE2.46x2036 value over 2026 base
Strategic Levers
M&A Pipeline
Regional Outlook
Country Rankings
Competitive Intelligence
Segmental Deep-dive
Call-Us : 91 93563 13602

Executive Snapshot and Market Trajectory

Autonomous haulage has been running at production scale in the Pilbara since 2012, and the operating case stopped being contested years ago. What remains contested is whether a brownfield mine can retrofit its existing fleet without losing more production during conversion than the automation returns. That question decides deployments now.
Growth runs at 9.4% and underground automation leads it. Teleremote and underground systems grow at 14.1%, exactly 1.50 times the market rate, because underground mining has the strongest safety case and the worst working conditions to remove people from. South Asia and Pacific holds 28%, far outside band, since Australian iron ore operates the largest autonomous fleets anywhere in the world by a wide margin.
Concentration is high at 62% across the top five measured on automated fleet units under management. Equipment makers hold it because automation runs on their machine control layer, and an independent system that cannot reach that layer is retrofitting around the problem rather than solving it. Mixed-fleet interoperability is where the pressure now sits, and it favours nobody currently. Independent specialists hold real underground positions. Large miners are pushing back on access.
Market Definition
This market covers automation systems supplied to mining operations, spanning autonomous haulage systems, autonomous drilling and blasting systems, underground automation and teleremote systems, fleet management and mine control software, and process plant and materials handling automation. Mining equipment sold without automation capability, exploration and geological software, mine planning and resource modelling tools, general enterprise software, communications infrastructure sold separately, and mining services delivered by contractors fall outside scope.
Base Year Value
$4.8B in 2025 (MMA Primary Research Dataset, August 2026)
Forecast Period
2026 to 2036, eleven discrete annual values
CAGR
9.4% base case. Bull 10.7%. Bear 8.2%.
Fastest Growth Segment
Underground Automation and Teleremote Systems: 14.1% CAGR
Fastest Growth Country
Chile: 11.4% CAGR
Fastest Growth Region
South Asia and Pacific: 11.0% CAGR
Largest Region
South Asia and Pacific: 28% of 2025 global value
Market Leaders
Caterpillar, Komatsu, Sandvik, Epiroc, Hitachi Construction Machinery. Source: MMA Analysis based on company annual reports.
Primary Survey
n=3,800 procurement and R&D decision-makers, Q4 2025, six countries
Methodology
Demand-side build-up, cross-validated against public data, 47 expert interviews

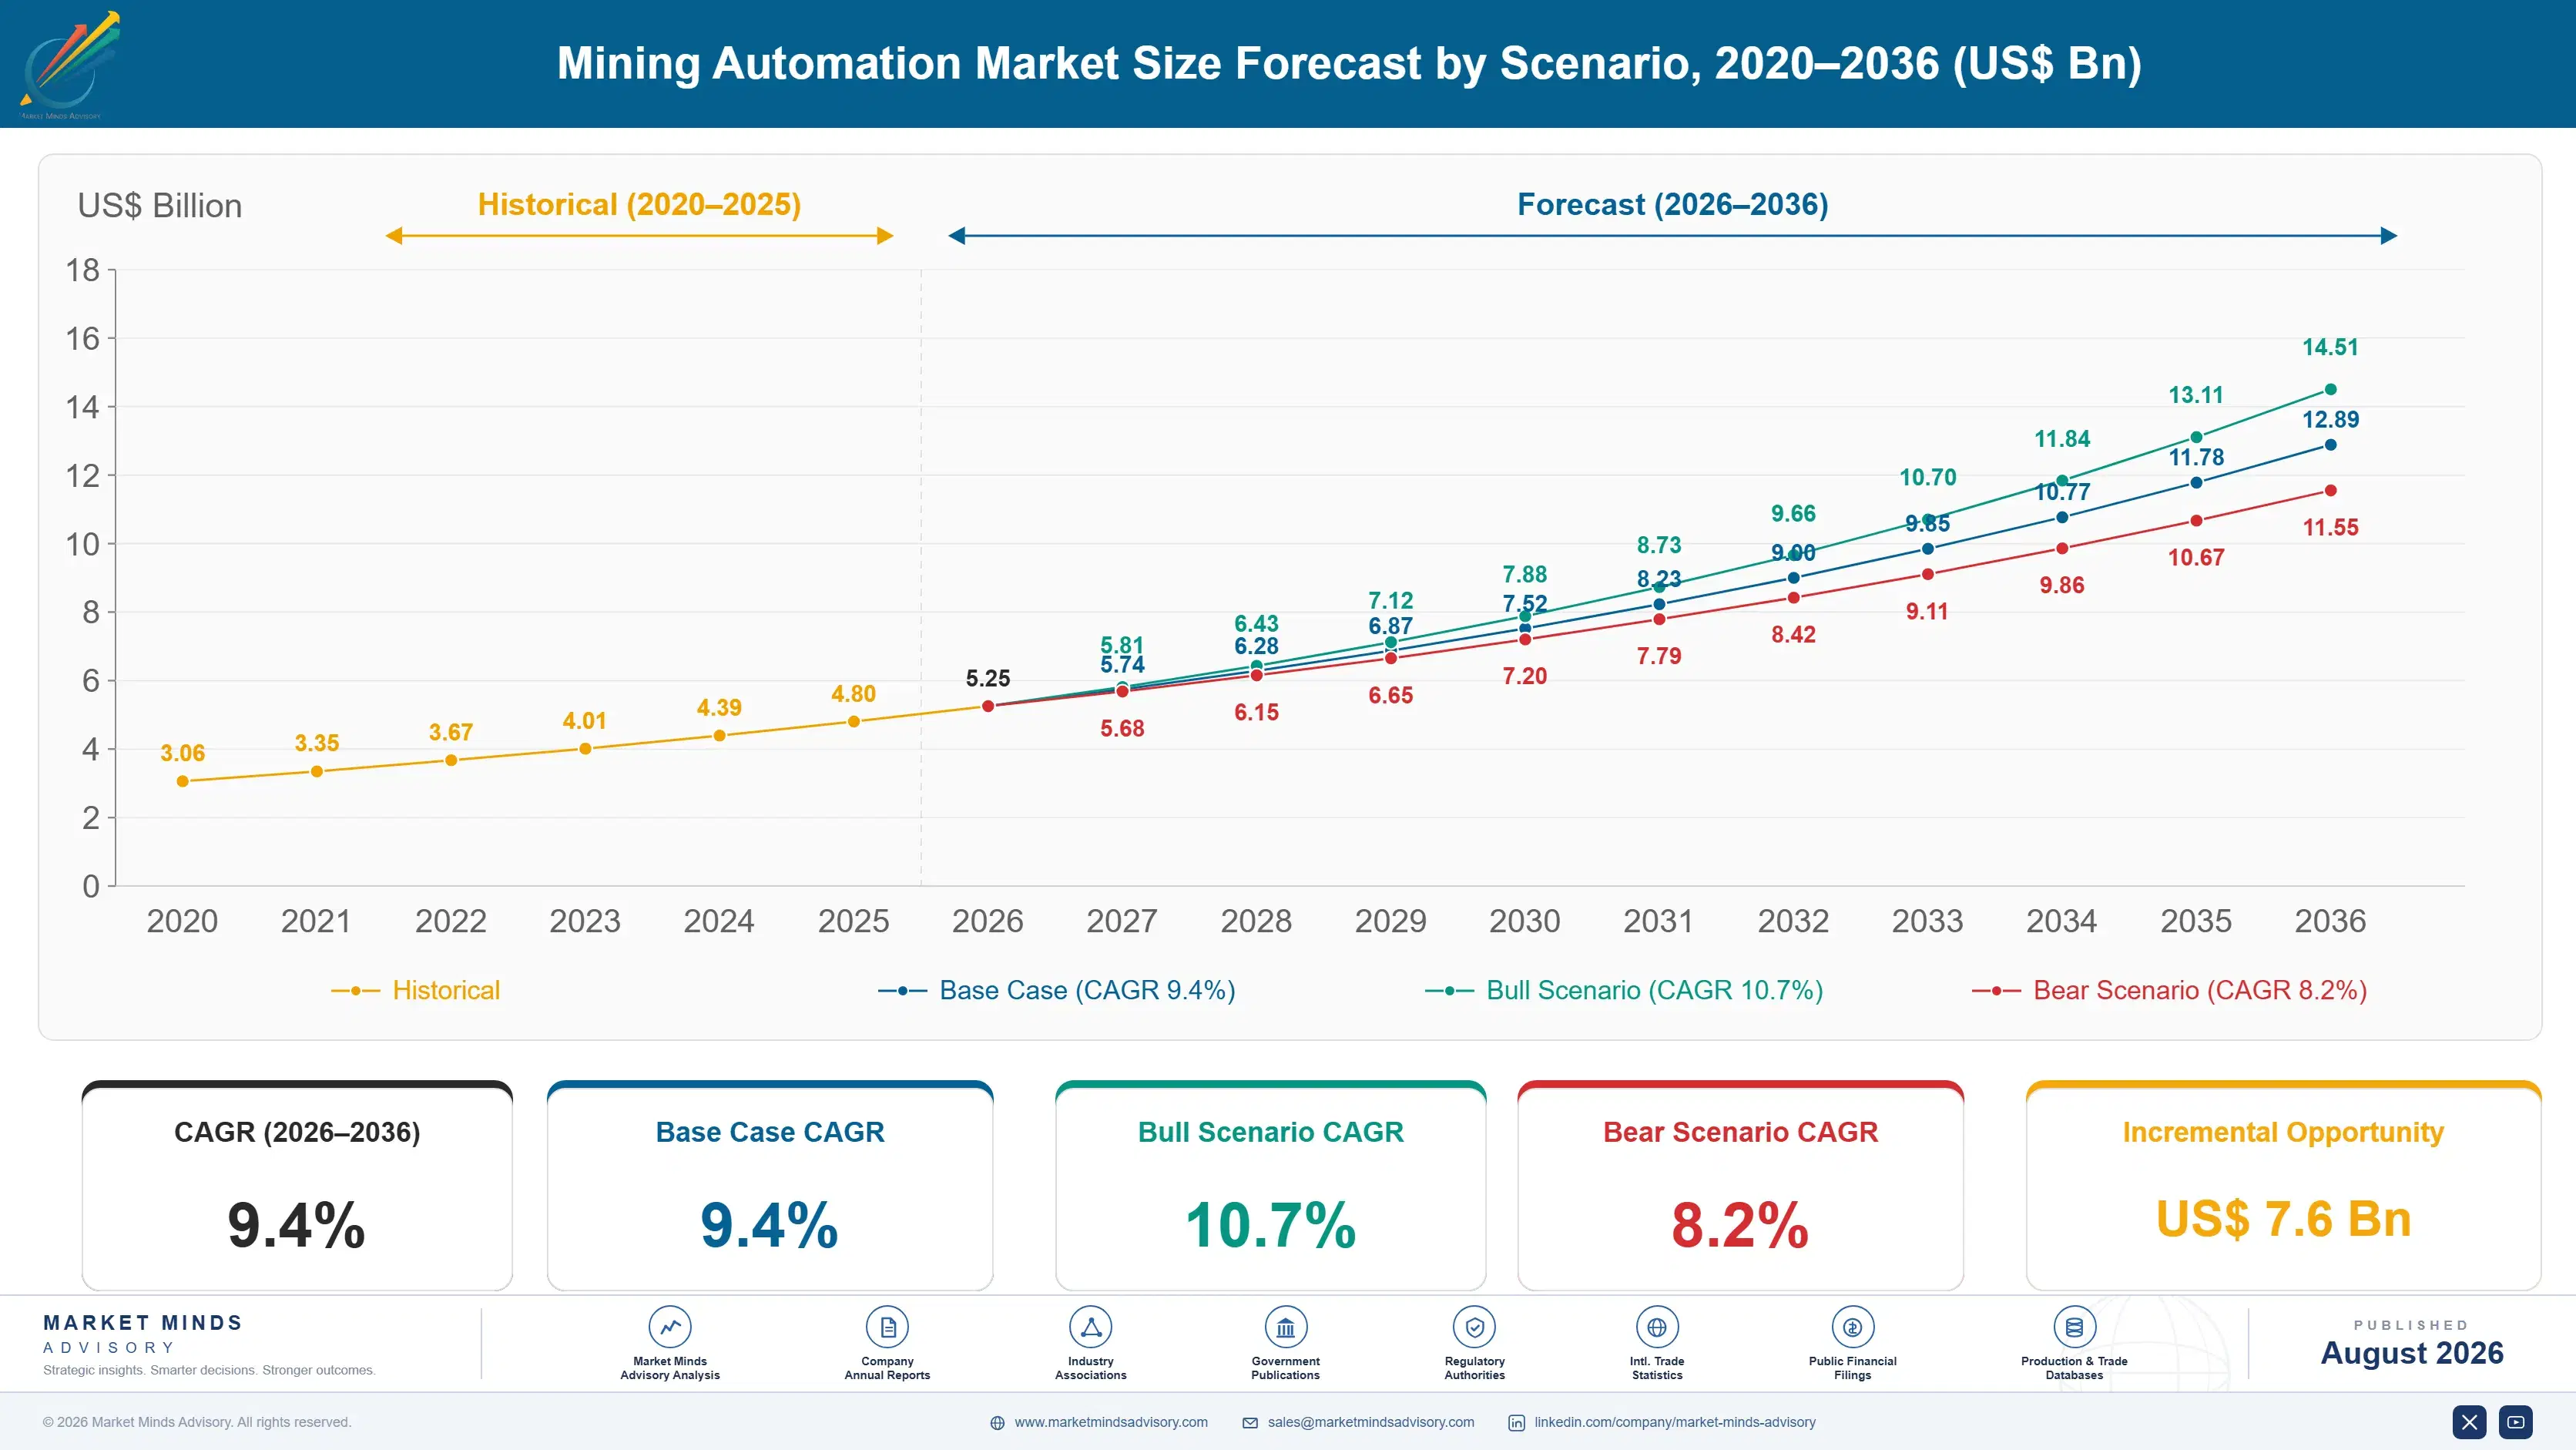
Mining Automation Market Forecast Scenarios

mining-automation-market-size-forecast-scenario-1787302716289
The 2020 to 2025 period ran at 8.2% and the mix inside it shifted considerably. Autonomous haulage moved from iron ore into copper and oil sands, which meant deploying into mines with steeper grades, tighter benches, and more mixed fleets than the Pilbara ever presented. Underground teleremote systems moved from trials into production use across several large operations, and labour availability drove more of that than safety did.
Three mechanisms carry the 9.4% base case. Underground automation is the largest, since deep and remote operations struggle to staff shifts and the safety case is unambiguous. Retrofit conversion of existing surface fleets is the second, now roughly 37% of deployments rather than a marginal activity. And copper production growth is the third, adding new mines in Chile, Peru, and central Africa that specify automation from the design stage. Surface haulage capacity adds little.
The 10.7% bull case rests on mixed-fleet interoperability becoming genuinely workable, which would open retrofit conversions currently blocked by fleets from three or four equipment makers. The 8.2% bear case is a commodity price downturn deferring capital across copper and iron ore simultaneously, since automation is capital spending that mines defer first and restart late.

Retrofit Economics Decide Most Deployments

The operating case for mining automation stopped being argued years ago. Autonomous haul trucks run about 18% higher utilisation than manned equivalents because they do not stop for shift change, breaks, or fatigue management, and they brake and corner identically every cycle, which extends tyre and component life measurably. Those numbers have held across enough deployments that nobody serious disputes them now.
TOP FIVE CONCENTRATION62%High, held through equipment maker control of machine layers
AUTONOMOUS FLEET PAYBACK4 yearsTypical period before a fleet conversion returns its capital
HAUL TRUCK UTILISATION GAIN18%Improvement recorded after conversion against a manned baseline
RETROFIT SHARE OF DEPLOYMENTS37%Of installations fitted to existing fleets rather than new
REMOTE OPERATING DISTANCE1,200 kmBetween the control room and the mine face itself
UNDERGROUND PENETRATION RATE9%Of underground production tonnes operating under automated control today
The difficulty moved to conversion. Roughly 37% of deployments are now retrofits onto existing fleets rather than greenfield installations, and a brownfield mine converting while producing faces a period where it runs neither system properly. Mines that underestimated that transition lost more production during conversion than the first two years of automation returned. Payback runs around four years when the conversion goes well and considerably longer when it does not.
Control of the machine layer explains concentration at 62%. Automation instructs the vehicle through its own control system, so the equipment maker sits between any independent automation supplier and the machine it is trying to drive. Independent systems exist and work, particularly underground, though they generally operate around that layer rather than through it, which limits what they can do.
"Every mine we advise asks how much production the trucks will add. Almost none of them ask how much production they will lose during the eighteen months of conversion, and that number is what actually decides whether the project works."
Director, Mining Technology and Operations Practice · MMA Industrial Technology

Market Trends

Underground Automation Moves From Trial Into Production

Teleremote loaders, automated drill rigs, and remotely operated underground fleets have moved past pilot status at several large operations, and those systems grow at 14.1% against 9.4% for the market. Labour availability drives it as much as safety does, because deep and remote underground operations struggle to staff shifts at any wage. Underground penetration sits near 9% of production tonnes, which leaves considerably more room to expand than surface haulage now has. Network coverage underground is the prerequisite that sets the pace. Mines that solved it first deployed fastest. Others treated it as an afterthought.
Market Impact: Utilisation improves around 18%
Retrofit Conversion Overtakes Greenfield Deployment Entirely

Roughly 37% of deployments now fit automation to fleets already in the pit rather than commissioning it with a new mine, which is a different engineering and commercial problem. Retrofits must handle mixed equipment ages, worn components, and production that cannot stop during conversion. Suppliers built around greenfield commissioning have found the transition harder than expected, and mines have found the production loss during conversion larger than any business case assumed. Conversion delivery now decides tenders more reliably than capability comparison does. Mines ask about the record first. Specifications come later.
Market Impact: Payback runs about 4 years

Market Opportunities and Growth Drivers

Autonomous Haulage Delivers Measured Utilisation Gains Reliably

Autonomous haul trucks run roughly 18% higher utilisation than manned equivalents because they do not stop for shift change, crib breaks, or fatigue management, and consistent braking and cornering extends tyre and drivetrain life on top of that. Those figures have held across enough production deployments over a decade that the operating case is no longer argued. What mines argue about now is conversion cost and timing, not the underlying benefit itself. Component life gains show up in tyre and drivetrain spend directly. Maintenance planning improves alongside. Both effects compound over a fleet.
Market Impact: Fleets from 3 makers block conversi

Copper Expansion Specifies Automation From Design Stage

New copper capacity in Chile, Peru, and central Africa is being designed with automation assumed rather than added later, which removes the retrofit problem entirely and shortens deployment considerably. Those mines are frequently remote, high altitude, or both, where staffing is expensive and remote operating centres genuinely help. Greenfield specification also lets the mine standardise on one equipment maker, which avoids the mixed-fleet interoperability problem that blocks so many brownfield conversions. Deployment on a greenfield site runs considerably shorter than any brownfield conversion. The business case is correspondingly cleaner. Nothing has to stop producing.
Market Impact: Conversion can cost 2 years benefit

Market Restraints and Challenges

Mixed Fleets Block Brownfield Conversion Repeatedly

Most operating mines run equipment from three or four makers, and the root cause of the blockage is that automation instructs machines through proprietary control layers that do not interoperate. A mine cannot automate half its fleet and manage the other half manually in the same pit without losing most of the benefit. Mitigation runs through interoperability standards work now underway, third-party retrofit kits that operate around the control layer, and fleet replacement programmes that standardise on one supplier over time. Standards work moves slowly while incumbents benefit from the delay. Nobody expects resolution soon.
Market Impact: Underground systems grow at 14.1%

Conversion Production Loss Breaks Business Cases

A brownfield mine converting while producing runs a period where neither the manned nor the automated system works properly, and the root cause is that autonomous zones must be physically separated from manned operations, which fragments the pit. Commercial impact is production loss that has exceeded two years of automation benefit at several operations. Mitigation runs through staged zone conversion, converting during planned pushbacks, and building the loss into the business case honestly rather than discovering it. The loss is recoverable only in the sense that the mine eventually catches up. Cash flow does not.
Market Impact: Retrofits are 37% of deployments
3 additional market trends, 4 additional growth drivers, and 2 additional restraints and challenges are covered in the full report. Contact sales@marketmindsadvisory.com to access the complete intelligence.

Segment CAGR and Growth Architecture

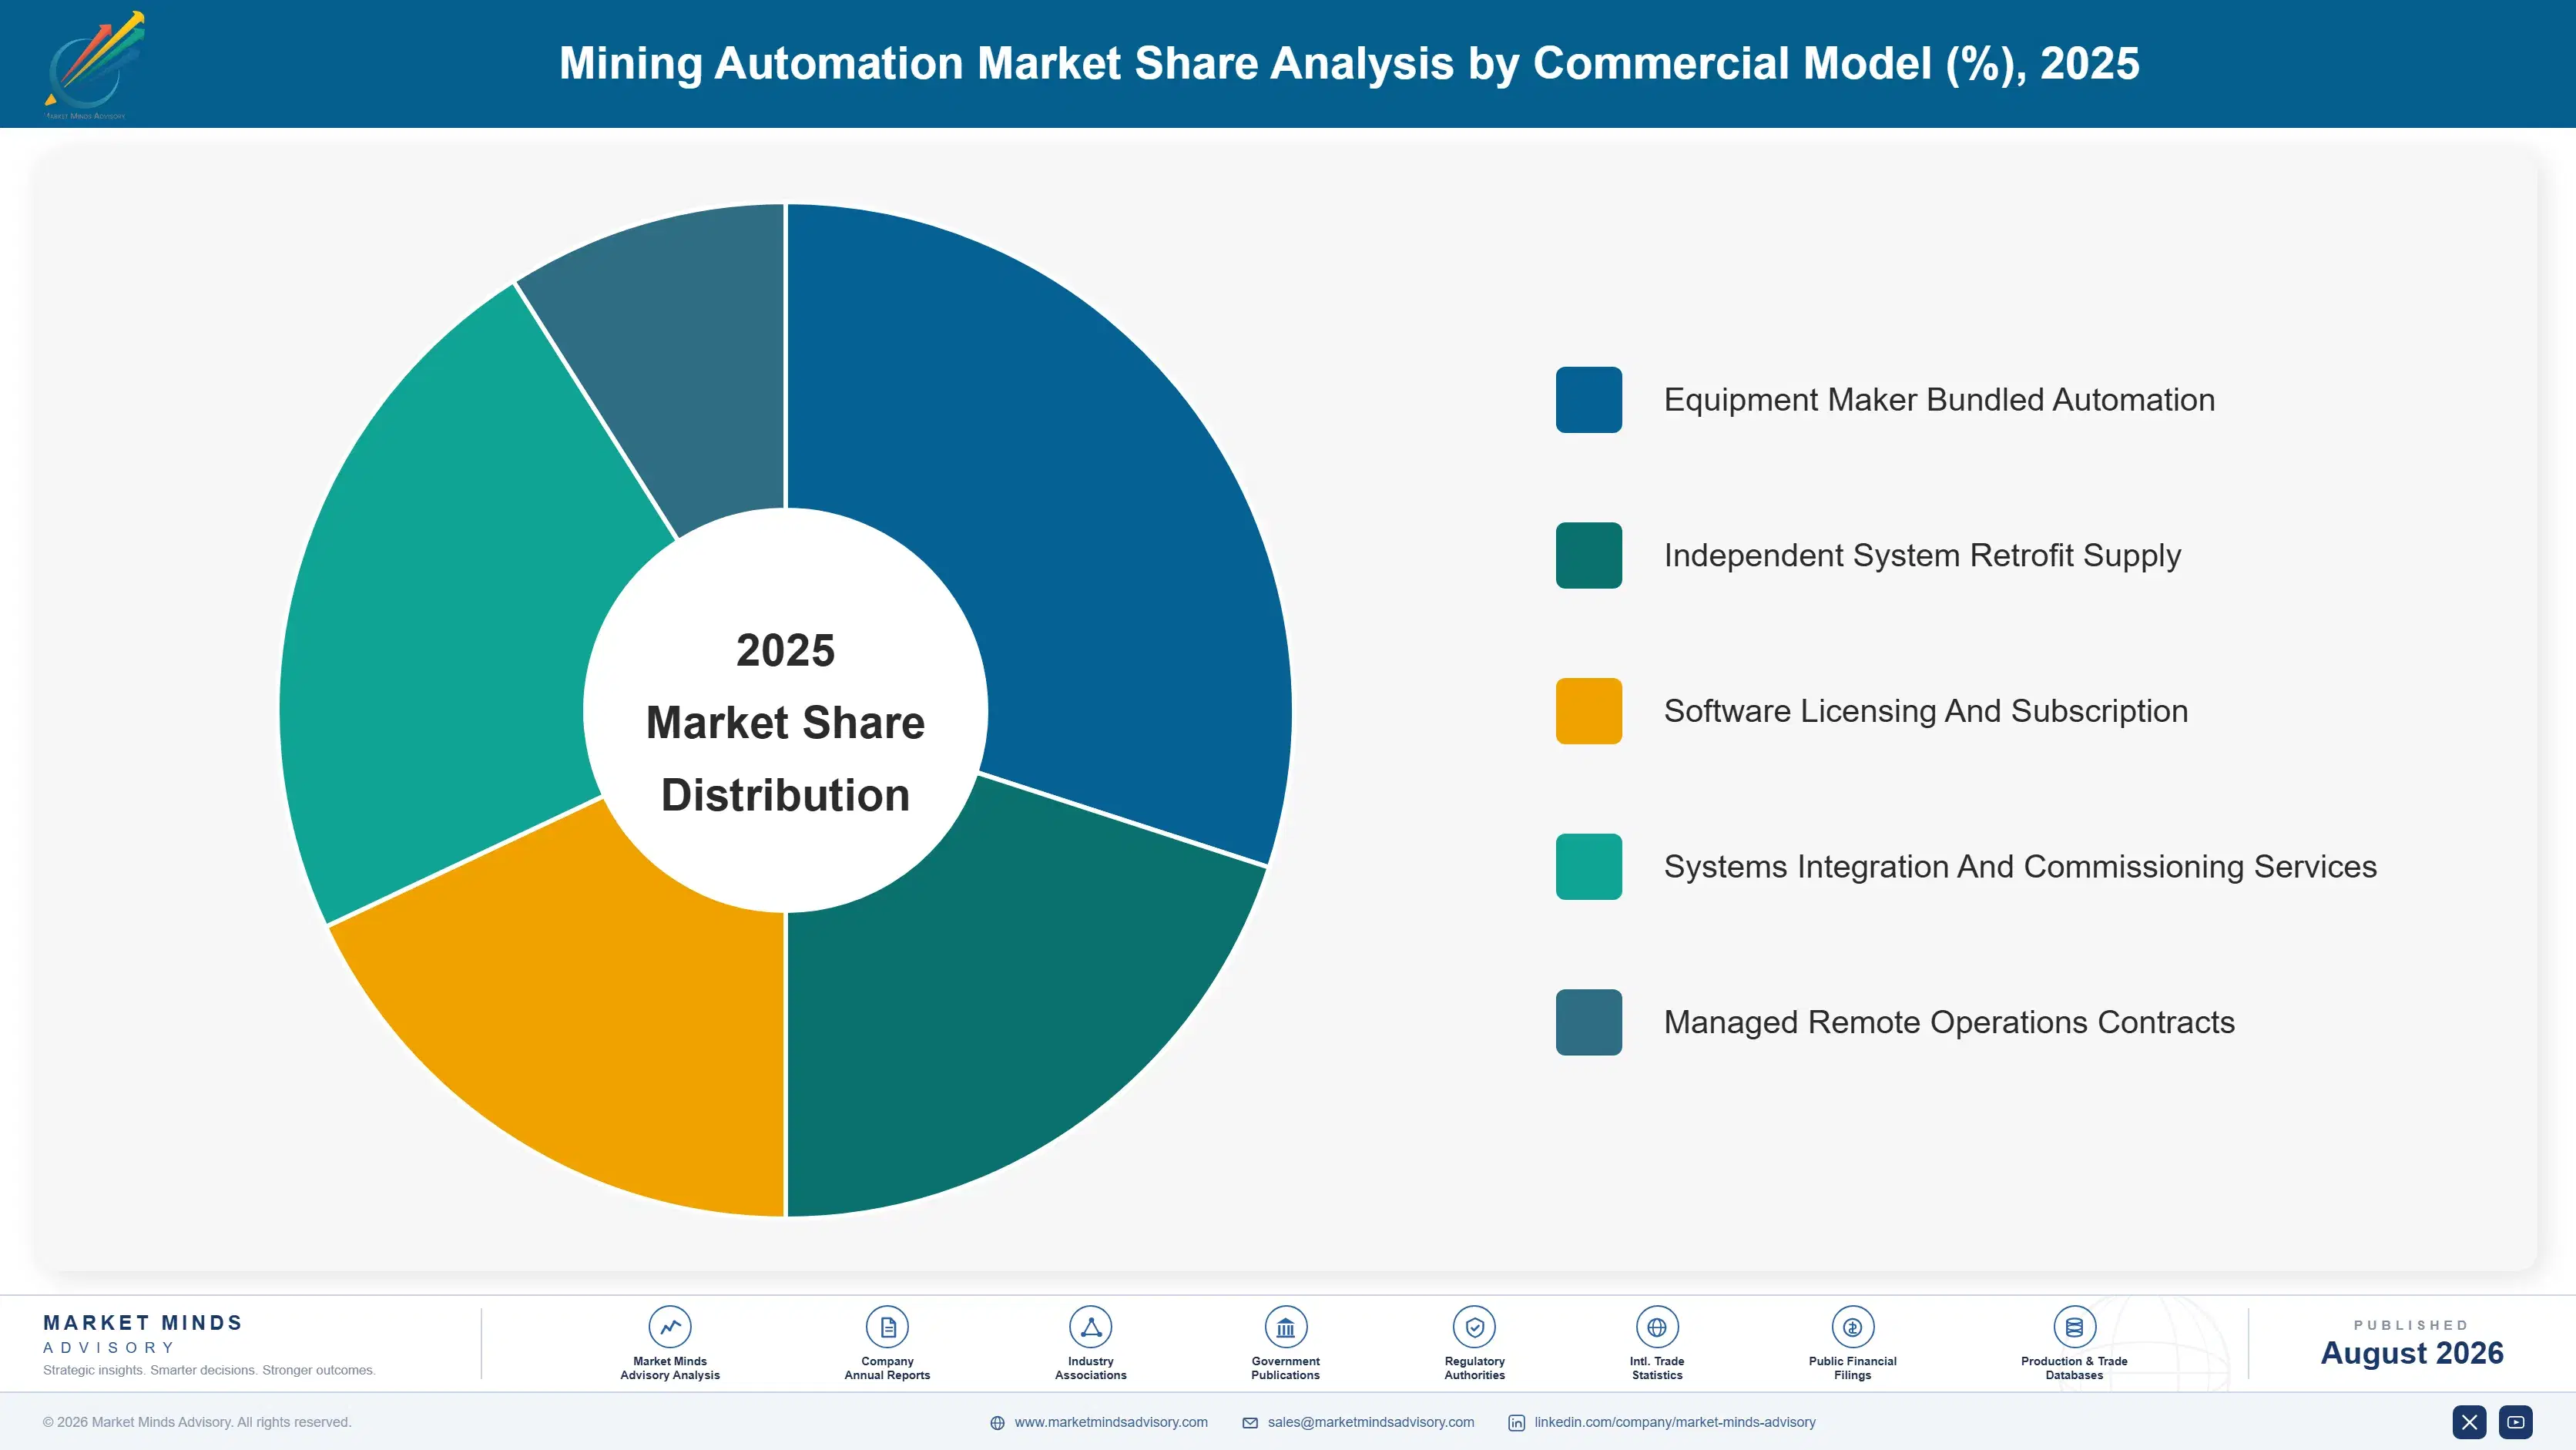
Segmentation follows automation system type and the mining activity it controls, because that determines engineering difficulty, deployment pathway, capital intensity, and which suppliers can credibly compete for the work. Commodity mined and mine ownership both cut across every system type rather than separating them, which makes either a weaker primary dimension here. System type is what the mine actually procures.
mining-automation-market-market-share-analysis-1787302716825

Underground Automation And Teleremote Systems

The fastest system type at 14.1%, exactly 1.50 times the market rate, covering teleremote loaders, automated drill rigs, and remotely operated underground fleets. Labour availability drives this as much as safety, since deep and remote operations struggle to staff shifts at any wage offered. Underground penetration sits near 9% of production tonnes, so the room to expand is considerably larger than surface haulage now offers. Communications underground remain the hardest engineering problem, and mines that solved network coverage first have deployed far faster than those treating it as an afterthought. Labour availability at deep and remote sites is the constraint that most often triggers the decision. Safety carries the argument internally.
CAGR 14.1%

Autonomous Drilling And Blasting Systems

Second fastest at 11.5%, covering autonomous production and blast hole drilling on surface and underground. Drilling automates more readily than haulage because a drill works from a fixed position rather than navigating a shared traffic environment, so the safety interlocking is simpler and the deployment shorter. Drill pattern accuracy improves measurably, which carries through into fragmentation and downstream crushing energy. Mines frequently automate drilling before haulage for exactly that reason, and several use it to build operator confidence in autonomous systems before attempting the harder conversion. Fragmentation improvement carries through into crushing energy and mill throughput downstream. That benefit is measured in the plant rather than the pit. It rarely appears in the automation business case.
CAGR 11.5%
Full segment breakdown across 5 segments available in the complete report.

Regional Architecture and Country Demand Map

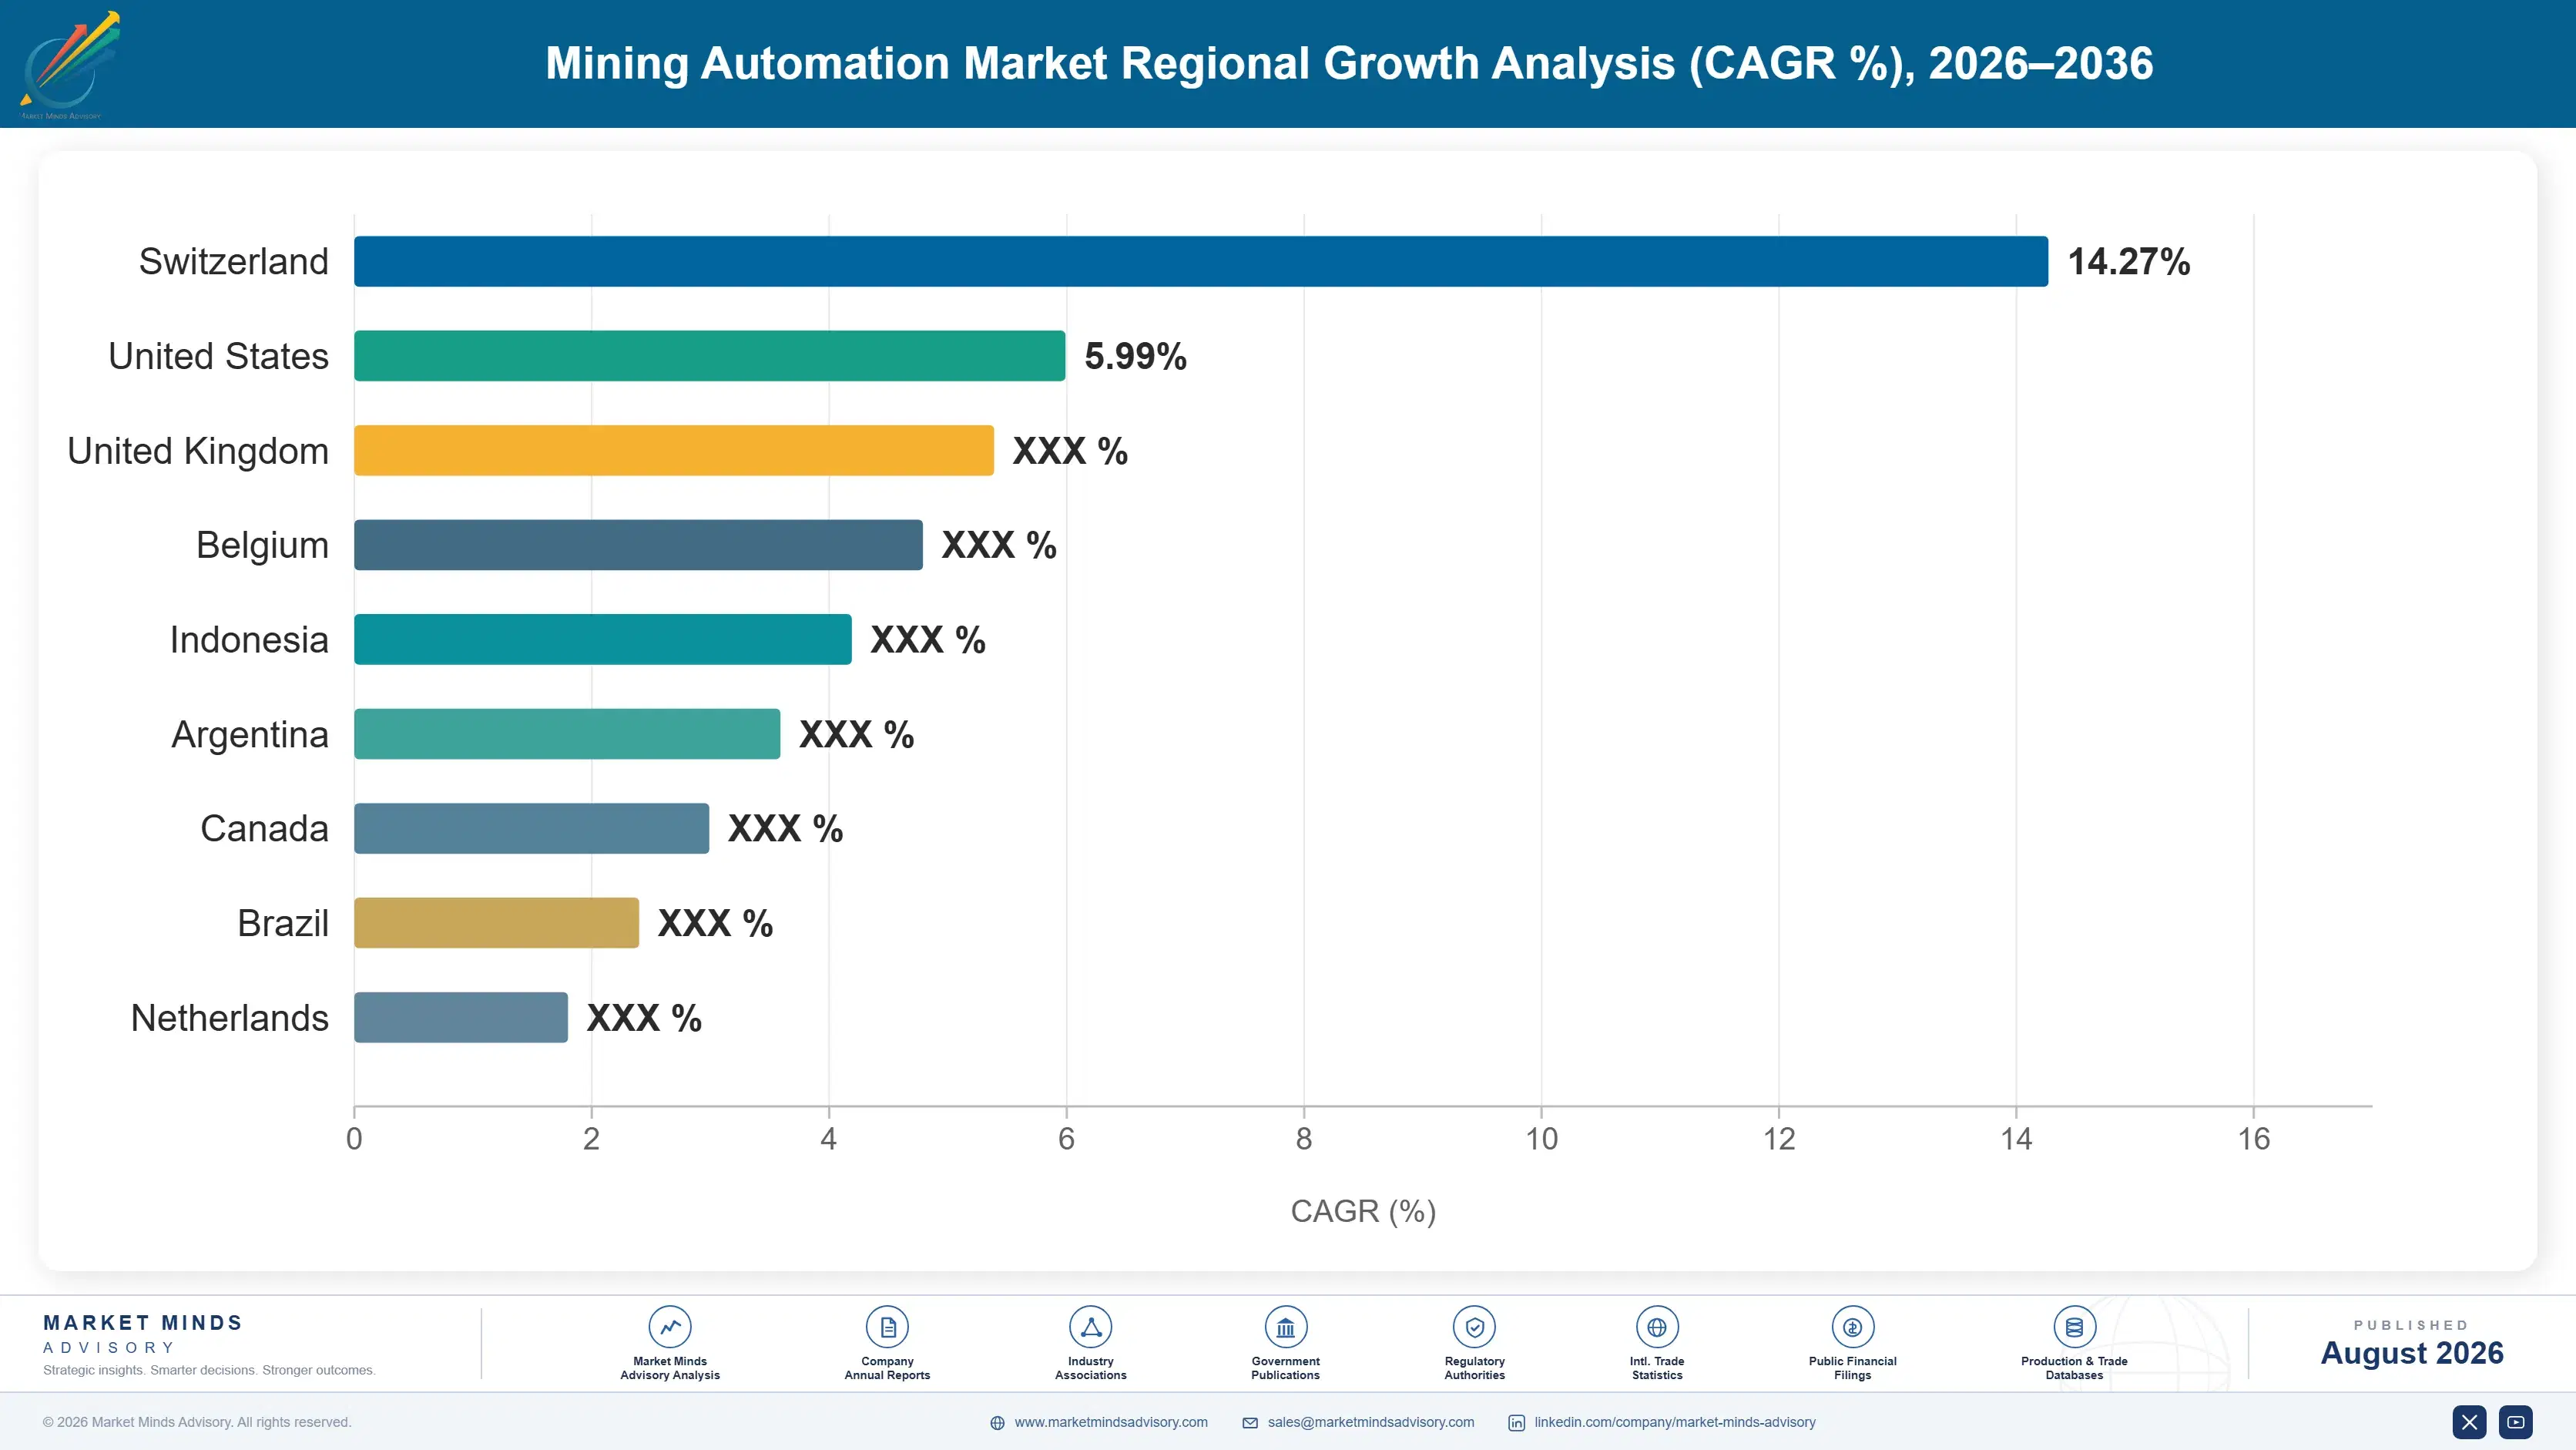
South Asia and Pacific leads at 28%, far outside band, because Australian iron ore operates the largest autonomous fleets anywhere. North America and Latin America follow on copper and oil sands. Chile grows fastest. Six regional shares sit outside their framework bands. Orebody geography explains every one of them.

South Asia and Pacific

Twenty-eight percent, far outside the framework band, and justified because Pilbara iron ore operations run the largest autonomous haulage fleets anywhere in the world and have done since 2012. Remote operating centres in Perth control equipment more than 1,200 km away, which normalised a working model the rest of the industry copied afterwards. Australian coal and copper have followed, and Indonesian coal is beginning to. Growth at 11.0% leads every region, carried by underground gold and copper conversions rather than by any further surface haulage expansion. Retrofit conversion at older Australian operations has proven considerably harder than the greenfield deployments that built the region's reputation for this technology. Mixed fleets are the usual blockage.
Share: 28% | CAGR: 11.0% (2026 to 2036)

North America

Twenty percent, below the framework band because mining automation follows orebodies rather than industrial output, and Canadian oil sands and underground hard rock carry most of the value here. Oil sands haulage fleets are among the largest converted outside Australia, and Sudbury and Val d'Or underground operations have deployed teleremote systems at production scale. United States copper and coal add further volume. Growth at 9.0% sits near the market rate, held there by coal decline offsetting copper and underground expansion. Oil sands operations run some of the harshest duty cycles anywhere, which has produced conversion experience that transfers directly into cold weather copper operations elsewhere. Underground penetration here leads most regions.
Share: 20% | CAGR: 9.0% (2026 to 2036)
Regional intelligence for 5 additional markets available in the complete report: Latin America, East Asia, Middle East and Africa, Western Europe, Eastern Europe. Contact sales@marketmindsadvisory.com.
mining-automation-market-country-cagr-analysis-1787302717339

Conversion Risk Is The Real Product

Concentration sits at 62%, retrofits are 37% of deployments, payback runs about four years, and underground grows at 14.1%. Value comes from managing conversion risk credibly, from underground capability, and from control of the machine layer rather than the software above it. Every one of those is decided before deployment starts. Capability matters least of all.

Price Conversion Risk Rather Than System Capability

Roughly 37% of deployments are brownfield retrofits, and mines that underestimated conversion have lost more production during it than the first two years of automation returned. A supplier that takes contractual responsibility for conversion timing is selling the thing the mine actually worries about. Capability comparisons between systems decide far less than any supplier's marketing suggests, because the operating benefit at around 18% utilisation gain is now broadly comparable across credible suppliers. Conversion record is what mines now ask about first, ahead of any system specification at all. That reversal happened quickly.
Market Impact: Retrofits make up roughly 37% of al

Build Underground Capability Before Surface Saturates

Underground penetration sits near 9% of production tonnes against surface haulage that is far further along, and underground systems grow at 14.1% against 9.4% for the market. The engineering is different enough that surface capability transfers only partially, particularly around communications and positioning without satellite coverage. Suppliers weighted to surface haulage are competing in the slower part of their own market while the faster part is contested by fewer participants. Communications through rock and positioning without satellite coverage are the two problems that separate suppliers here. Neither has a general solution.
Market Impact: Underground penetration sits near 9

Hold The Machine Control Layer Deliberately

Automation instructs equipment through the machine's own control system, which puts the equipment maker between any independent supplier and the vehicle it is trying to drive. Concentration at 62% follows directly from that rather than from software capability. Equipment makers conceding open access to the control layer are giving away the position that holds the market, and independent suppliers working around it accept real functional limits they rarely acknowledge to customers. Large miners are now specifying interoperability in tenders, which pushes at exactly this position. How that resolves decides the concentration number.
Market Impact: Control layer holds 62% of the mark

Sell Mixed Fleet Interoperability As A Product

Most operating mines run equipment from three or four makers, and that blocks brownfield conversion more reliably than cost does. A supplier that can automate a genuinely mixed fleet addresses conversions currently impossible, which is a considerably larger opportunity than winning share in single-supplier fleets. Interoperability standards work is underway and slow. Whoever solves this commercially before the standards land captures roughly a decade of blocked brownfield conversions. Roughly 37% of deployments are retrofits and a meaningful share of the rest are blocked entirely by fleet mix. That backlog has been building for a decade.
Market Impact: Mixed fleets often span 3 or 4 make

Who Controls the Margin Pool

Concentration is high at 62% across the top five measured on automated fleet units under management, and control of the machine layer rather than software capability holds it there. Automation instructs equipment through the vehicle's own control system, so equipment makers sit between independent suppliers and the machines those suppliers are trying to drive. The leader to challenger gap is widest in surface haulage and considerably narrower underground, where independent
Competitive activity runs on three fronts. Conversion delivery is the first and the one mines actually evaluate, since retrofit timing decides whether a business case survives contact with production. Underground capability is the second, where communications and positioning without satellite coverage make the engineering genuinely different. And mixed fleet interoperability is the third, currently unsolved and blocking conversions everywhere.

Pressure arrives from two directions. Independent automation specialists have built credible underground positions that equipment makers have not displaced. And large miners have started specifying interoperability in tenders, which pushes against the control layer position directly. Rankings shift on conversion delivery rather than on capability claims. Neither pressure has changed the ranking yet, though both are moving in the same direction and the largest customers are behind both of them.
mining-automation-market-company-positioning-matrix-1787302717861

Competitive Moat and Risk Dimensions

CATERPILLAR

Moat: Installed autonomous fleet scale

More than a decade of production autonomous haulage across iron ore, copper, and oil sands gives operating data and conversion experience that no competitor can assemble quickly. Each deployment teaches conversion sequencing that the next one uses. Control of the machine layer on its own equipment keeps independent suppliers working around rather than through the vehicle.
CATERPILLAR

Risk: Interoperability demands from large miners

Large mining groups have begun specifying mixed fleet interoperability in tenders, which pushes directly against the control layer position that holds concentration where it is. Conceding open access opens brownfield conversions and dilutes the advantage simultaneously. Refusing it risks losing tenders at exactly the customers with the largest fleets to convert.
KOMATSU

Moat: Early autonomous haulage deployment history

Autonomous haulage running in production since the mid-2000s gives a deployment record across more mine types and geographies than the deployment count alone suggests. Conversion sequencing knowledge compounds with every retrofit completed. Integration between the automation layer and the machine's own systems remains tighter than any independent supplier achieves working around it.
KOMATSU

Risk: Underground position narrower than surface

Underground automation grows at 14.1% against 9.4% for the market and is contested by specialists with genuinely different engineering, particularly around communications and positioning without satellite coverage. A surface-weighted position is weighted toward the slower-growing part of the market. Transferring surface capability underground has proven harder than several suppliers assumed.

Players Tracked

Prominent Players

Caterpillar
Komatsu
Sandvik
Epiroc
Hitachi Construction Machinery

Other Key Players

ABB
Siemens
Hexagon
Wenco International Mining Systems
RCT
MST Global
Rockwell Automation
Schneider Electric
Trimble
Modular Mining Systems
Liebherr
Volvo Construction Equipment
Autonomous Solutions
Micromine
Metso

Recent Developments

MARCH 2025

Copper producer specifies interoperability across automation tender

A large copper producer required mixed fleet interoperability as a condition in an automation tender covering several operations, rather than accepting a single equipment maker platform across its existing fleet. The requirement was a procurement specification rather than any joint venture, acquisition, or standards body decision.
Signal: Large miners are now pushing directly agai
JUNE 2025

Underground gold operation completes teleremote fleet conversion

An underground gold operation finished converting its production loading fleet to teleremote control from a surface operating centre, having first rebuilt underground network coverage across the working levels. The project was an internal capital programme rather than any partnership, acquisition, or equipment supply agreement change.
Signal: Underground network coverage is the real p
SEPTEMBER 2025

Brownfield conversion deferred after production loss review

An iron ore producer deferred a planned autonomous haulage retrofit at one operation after reviewing production losses recorded during conversion at a comparable site, choosing to wait for a scheduled pushback instead. The decision was internal capital sequencing rather than any supplier dispute or technical failure.
Signal: Conversion production loss is now assessed

Sensors, Engineering and Network Build

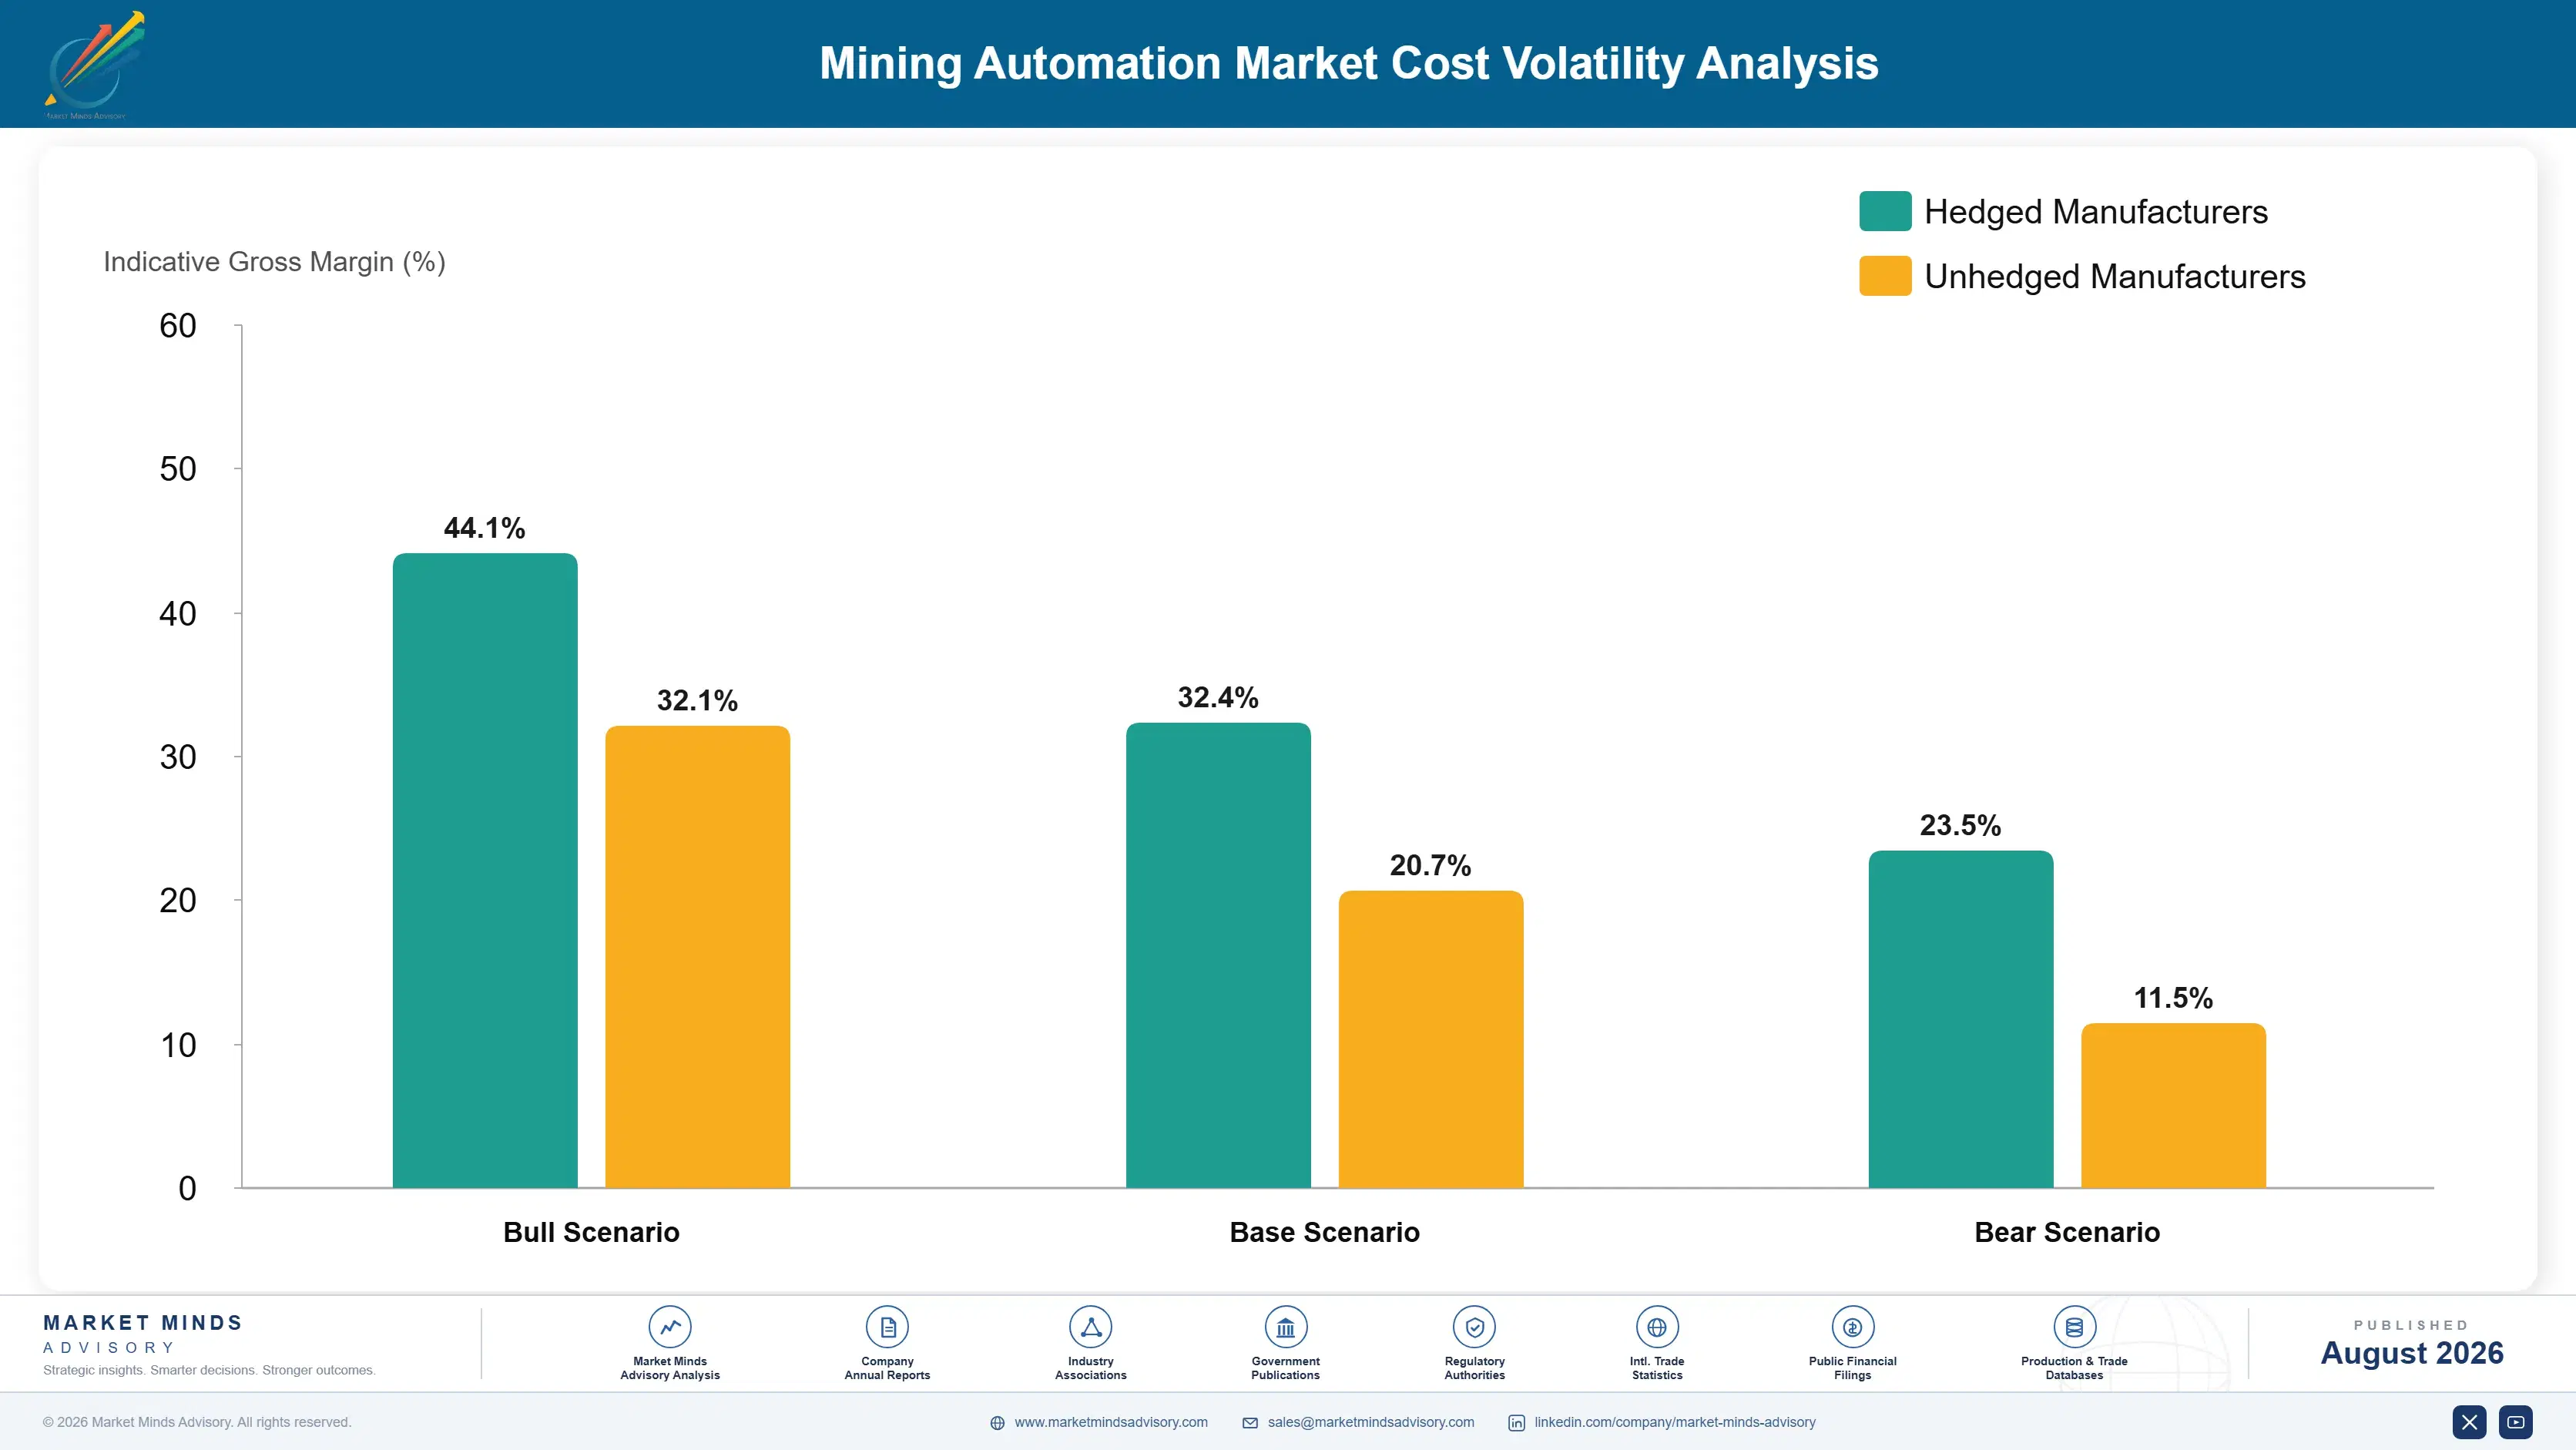
Deployment cost divides between onboard hardware including positioning, perception sensors, and controllers at roughly 34%, communications network build across the pit or underground workings near 23%, systems engineering and commissioning labour around 27%, software licensing about 9%, and training and change management the balance. Sensor hardware comes from automotive and industrial supply chains the mining suppliers do not control.
Perception sensor and controller availability tightened through 2022 and 2023 as automotive demand absorbed semiconductor and lidar capacity, and several equipment makers disclosed extended lead times on automation hardware in filings covering those years. Deployment schedules slipped rather than costs rising sharply. Availability has since eased, though the mining volumes involved remain small enough that suppliers get little priority in an allocation. Mining volumes are small next to automotive demand for the same components.

The competitive disadvantage mechanism runs through network build rather than through hardware pricing. Sensors and controllers cost broadly the same for every supplier, while communications coverage across a pit or underground working varies enormously by site geometry and existing infrastructure. Underground operations without prior network investment carry costs that can exceed the automation hardware itself, and remote sites with poor backhaul carry it worse again.
mining-automation-market-cost-volatility-analysis-1787302718055

Build network coverage ahead of any automation commitment

Communications infrastructure carries roughly 23% of deployment cost and determines conversion pace more than any other factor, particularly underground where coverage cannot be assumed. Mines that rebuilt networks before committing to automation have deployed considerably faster than those treating coverage as part of the automation project. The network also carries value independently through ventilation control, tracking, and condition monitoring.

Sequence conversion against planned pushbacks and shutdowns

Conversion production loss has exceeded two years of automation benefit at operations that converted while producing at full rate. Sequencing zone conversion against planned pushbacks, stripping campaigns, or scheduled shutdowns absorbs the disruption into downtime the mine plan already carries. That timing is set by the mine plan rather than by the automation supplier, and it needs deciding early.

Standardise fleet replacement toward single supplier platforms

Mixed fleets spanning three or four equipment makers block conversion more reliably than capital constraints do, and interoperability remains unsolved commercially. Directing routine fleet replacement toward one platform resolves it over a replacement cycle without any additional capital, provided the decision is made before the replacements are ordered rather than afterwards. Nothing else fixes it as cheaply.

Portfolio Architecture for Margin Defence

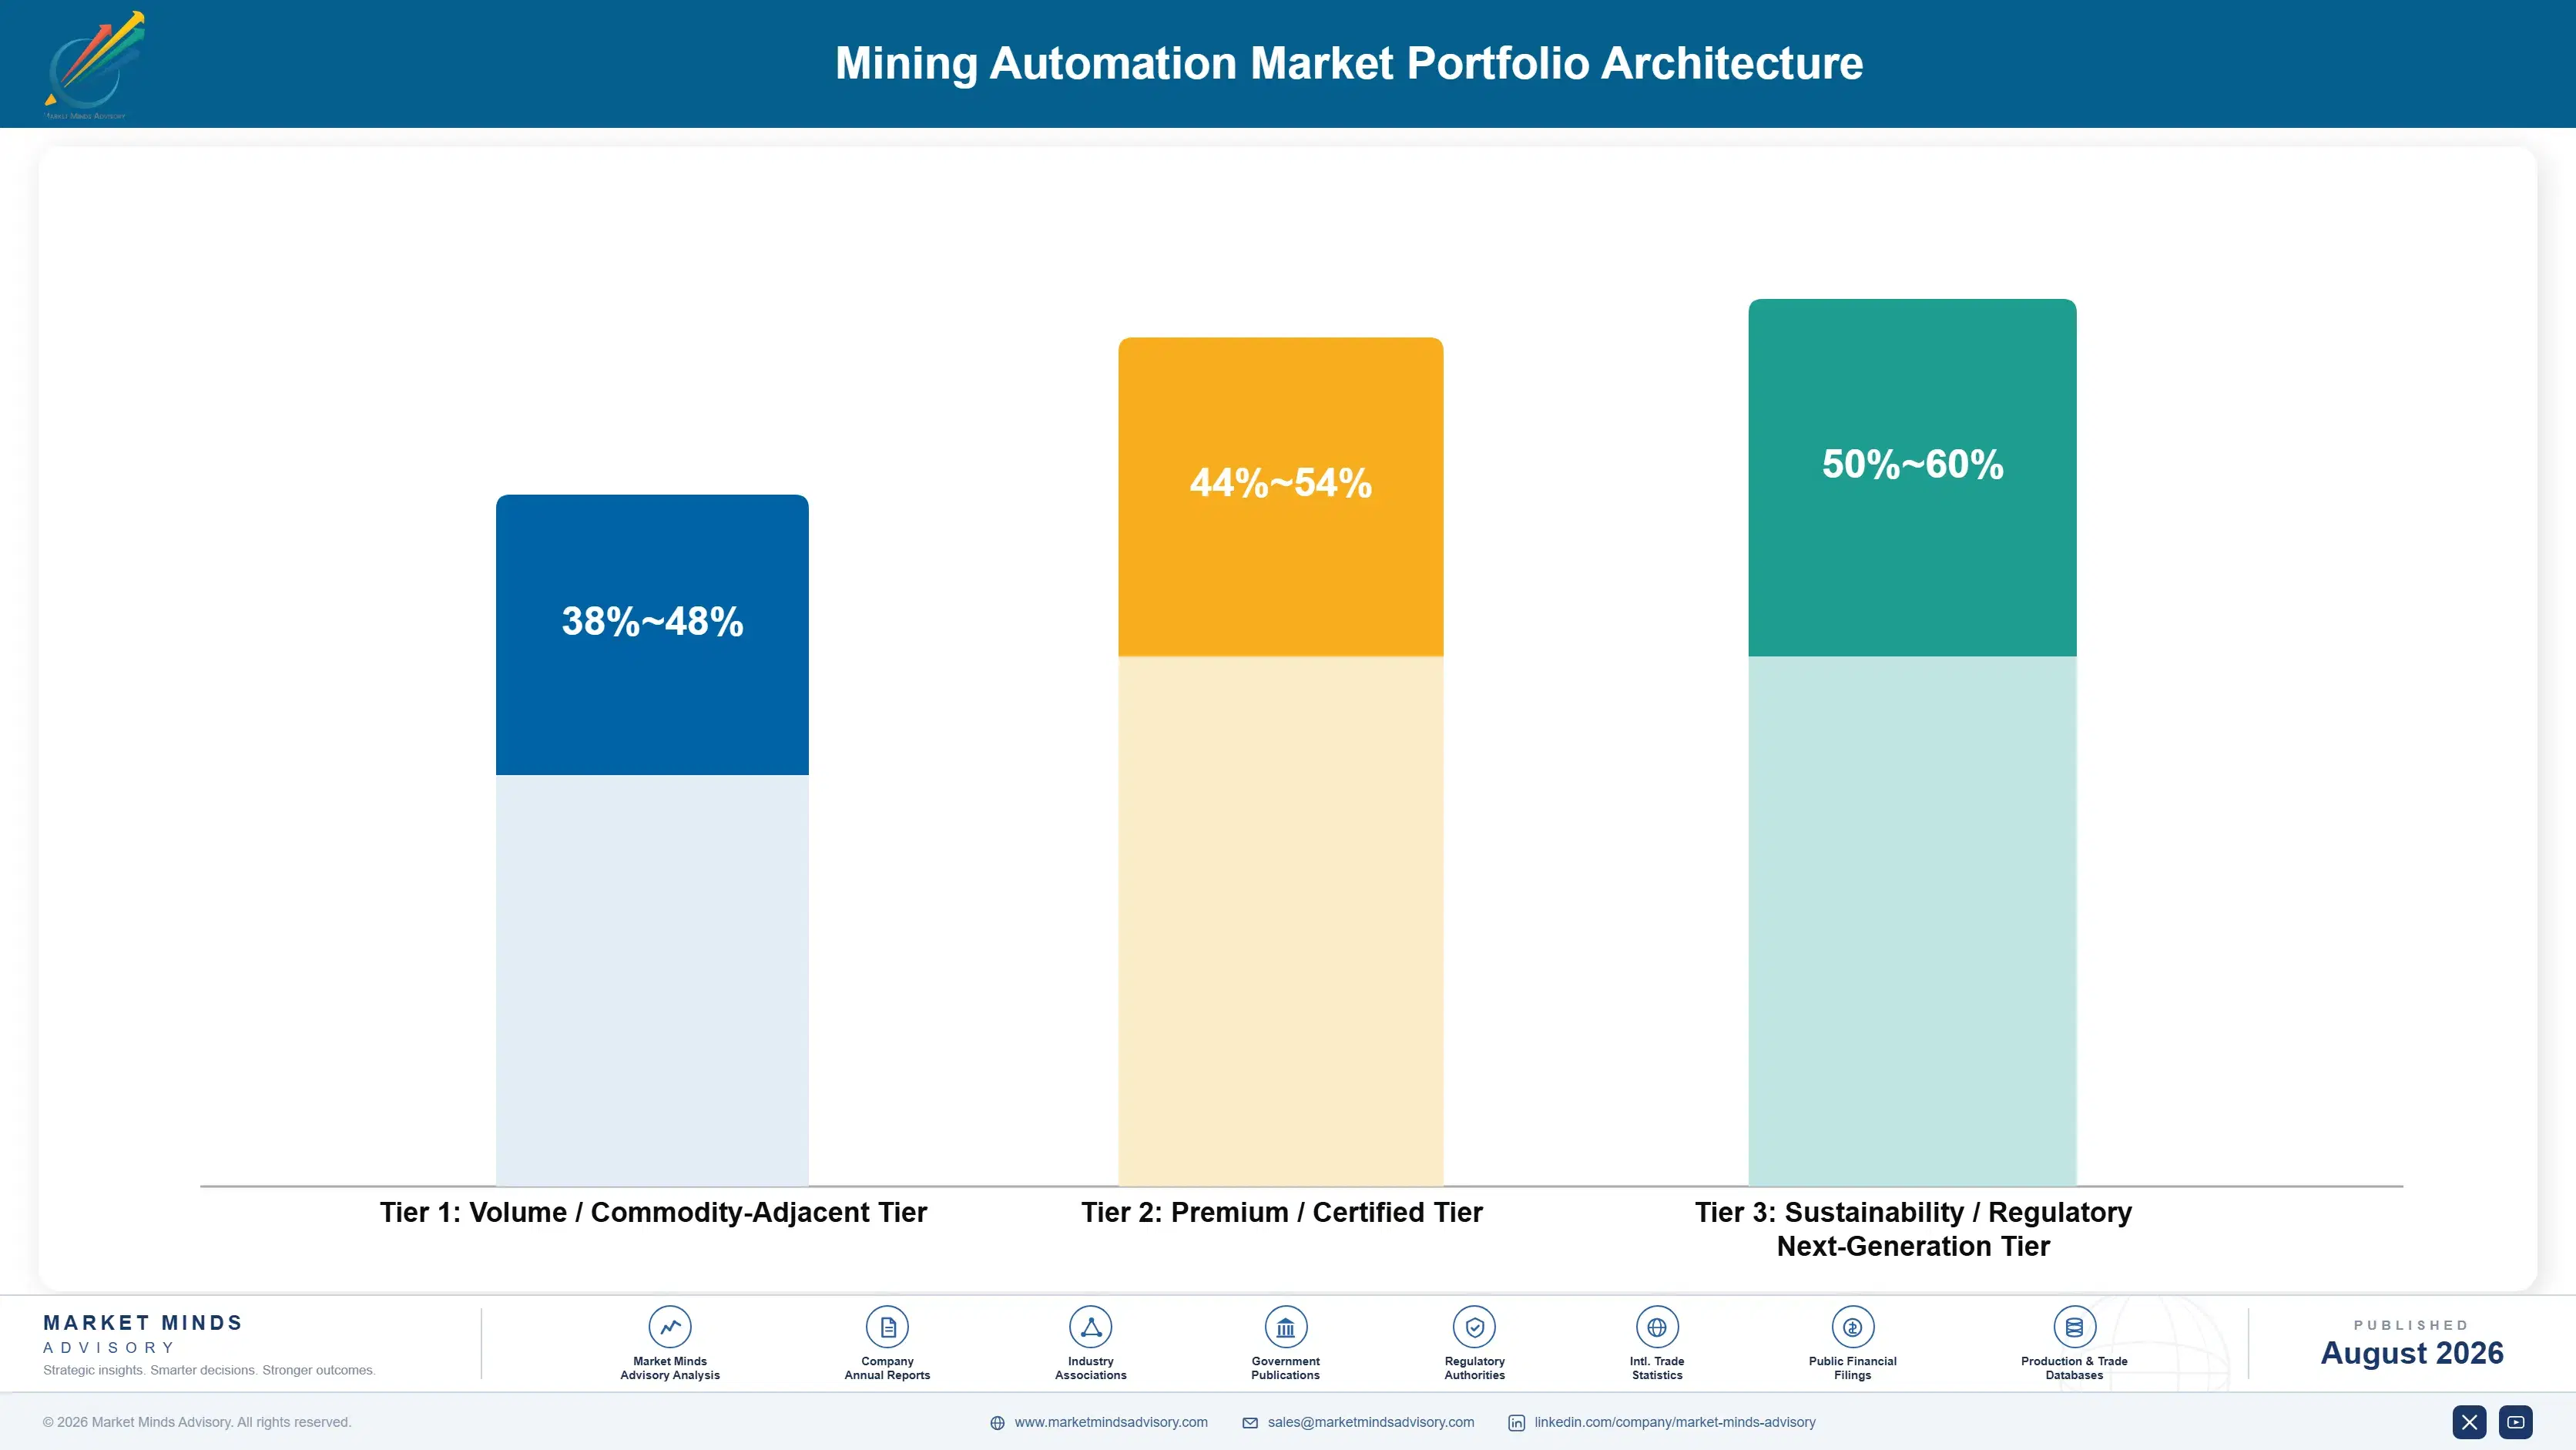
Three tiers describe this business and the spread follows engineering difficulty and switching cost rather than deal size. Fleet management and mine control software sits at the bottom, where several credible suppliers compete and replacement is possible without touching the machines. Surface haulage and drilling automation occupies the middle. Underground automation and teleremote systems sit at the top, where communications engineering and site-specific work both apply.
The tension is that software carries the lowest margin and the widest reach, while underground carries the best margin against deployment cost that varies enormously by site. A supplier weighted to software has visibility across the mine and limited defence when a competitor arrives. One weighted underground carries project delivery risk on every contract, since network coverage and site geometry determine cost more than the system specification does.

High-value pools concentrate where the engineering is site-specific and hard to repeat. Underground teleremote is the clearest case, since positioning without satellite coverage and communications through rock are problems that do not have a general solution. Surface haulage conversion is the second such pool, where a decade of accumulated sequencing knowledge cannot be bought or hired quickly. Both resist entry for the same reason.

Volume / Commodity-Adjacent Tier

Fleet management and mine control software where several credible suppliers compete and replacement does not require touching the machines. Widest reach across the mine and the thinnest defence against a determined competitor.
Gross Margin: 38-48%

Premium / Certified Tier

Surface autonomous haulage and drilling systems where the control layer position applies and conversion delivery decides outcomes. Deployment scale and conversion experience differentiate suppliers more than any capability comparison does.
Gross Margin: 44-54%

Sustainability / Regulatory / Next-Generation Tier

Underground automation and teleremote systems where communications through rock, positioning without satellite coverage, and site-specific engineering all apply. Best margin in the portfolio and the highest project delivery risk alongside it.
Gross Margin: 50-60%
mining-automation-market-portfolio-architecture-1787302718556

Fleets, Conversions and Renewals

Revenue follows fleet size once a system is deployed, through licensing, support, and expansion as the mine adds equipment. The initial conversion is capital spending; everything afterwards behaves as an annuity tied to units under management. That mix has shifted considerably as installed bases matured, and support revenue now exceeds new deployment revenue at the longest-established suppliers. Expansion revenue follows the mine plan rather than any sales effort.
Stickiness varies sharply by system and by mine type. Autonomous haulage is effectively permanent once converted, because reversing it means retraining an operator base the mine no longer employs. Underground teleremote is similarly firm, since the network investment is sunk into the system chosen. Fleet management software is the loosest, and mines do replace it, particularly when a new operations leader arrives with prior preferences.

Buyer profiles shifted as conversion overtook greenfield deployment. The earlier buyer was a project engineer commissioning a new mine with automation designed in. The current conversation increasingly involves an operations manager who has to keep producing through conversion, and who evaluates the supplier's conversion record long before evaluating what the system can do.
mining-automation-market-end-use-penetration-index-1787302719045

What We Would Tell a Board

These are among the four positions where our research anticipates prominent divergence between winners and laggards over the coming forecast period. Each is grounded in the demand model, the regulatory perimeter, and the announced capacity pipeline.
01 / CONVERSION RISK PRICING

Sell conversion delivery, not system capability

Roughly 37% of deployments are now brownfield retrofits, and mines that underestimated conversion lost more production during it than the first two years of automation actually returned to them. The operating benefit at around 18% utilisation gain is broadly comparable across every credible supplier now, so capability comparison decides far less than suppliers assume. Taking contractual responsibility for conversion timing and production loss addresses the thing the mine genuinely worries about, which no capability comparison in any tender document ever reaches.
02 / UNDERGROUND CAPABILITY BUILDING

Underground is where the growth actually is

Underground penetration sits near 9% of production tonnes while surface haulage is far further along, and underground systems grow at 14.1% against 9.4% for the wider market overall. The engineering differs enough that surface capability transfers only partially across, particularly around communications through solid rock and positioning without any satellite coverage at all underground. Suppliers weighted toward surface haulage are competing hard in the slower-growing half of their own market, against competitors who have already built the underground capability they still lack entirely.
03 / CONTROL LAYER DEFENCE

The machine layer is the whole position

Automation instructs equipment through the vehicle's own control system, which puts the equipment maker between every independent supplier and the machine being driven at all times. Concentration at 62% across the top five follows from that fact directly rather than from any software capability advantage that anybody in this market actually holds. Equipment makers conceding open access are giving away the one position that actually holds this market together, and the largest miners are now pushing for exactly that concession in their tender documents.
04 / INTEROPERABILITY BACKLOG CAPTURE

Solve mixed fleets and take the backlog

Most operating mines run equipment from three or four makers and that blocks brownfield conversion more reliably than capital constraints ever have across this industry. Interoperability standards work is underway and moving very slowly indeed, as standards work generally does whenever the incumbents around the table benefit from continued delay. Whoever resolves it commercially before those standards land captures roughly a decade of accumulated brownfield conversions that nobody can currently serve at all, at customers with the largest fleets in the industry.

Engagement Snapshot From the Field

A live engagement with an industry participant carrying material or product regulatory and market exposure ahead of a defining policy shift, showing how our research translates into a defensible multi-year portfolio strategy.
MARKET MINDS ADVISORY · CLIENT ENGAGEMENT SUMMARY
Mining Automation Producer Strategic Portfolio Review and Transition Roadmap 2026·Investment Scenario on Mining Automation Exposure Evaluation 2025-26
CLIENT PROFILE
A mid-tier copper producer with approximately 1.4 billion dollars in annual revenue (client-reported, unverified by MMA), operating three open pit mines and one underground operation across two countries. Haulage fleets spanned three equipment makers, no automation was deployed anywhere, and the board had approved study funding for an autonomous haulage conversion at the largest pit.
STRATEGIC CHALLENGE
Management wanted to know whether conversion at the largest pit was the right starting point, what the mixed fleet meant for deployment, and how much production would actually be lost during conversion, since the initial business case had assumed the loss would be negligible. Nobody had benchmarked the loss against comparable conversions elsewhere in the industry.
MMA APPROACH
We modelled conversion production loss against the mine plan at each operation, benchmarked against recorded losses at comparable brownfield conversions. Fleet composition was assessed for interoperability blockage by pit. Underground automation options were evaluated separately, and network infrastructure requirements were costed at every site independently. Fleet replacement schedules were then tested as an alternative route.
KEY FINDINGS
  1. The largest pit had the worst fleet mix and the tightest production schedule, making it the most expensive conversion rather than the obvious first one.
  2. Recorded conversion losses at comparable operations exceeded the client's business case assumption by a wide margin, in one case by more than two years of benefit.
  3. The underground operation offered a stronger case, with a clearer safety argument, a single equipment supplier, and a scheduled network upgrade already funded.
  4. Fleet replacement over six years would resolve the interoperability blockage at two pits without any additional capital being committed. The decision only had to be made before the replacements were ordered.
CLIENT PROFILE
A mid-tier copper producer with approximately 1.4 billion dollars in annual revenue (client-reported, unverified by MMA), operating three open pit mines and one underground operation across two countries. Haulage fleets spanned three equipment makers, no automation was deployed anywhere, and the board had approved study funding for an autonomous haulage conversion at the largest pit.
STRATEGIC CHALLENGE
Management wanted to know whether conversion at the largest pit was the right starting point, what the mixed fleet meant for deployment, and how much production would actually be lost during conversion, since the initial business case had assumed the loss would be negligible. Nobody had benchmarked the loss against comparable conversions elsewhere in the industry.
MMA APPROACH
We modelled conversion production loss against the mine plan at each operation, benchmarked against recorded losses at comparable brownfield conversions. Fleet composition was assessed for interoperability blockage by pit. Underground automation options were evaluated separately, and network infrastructure requirements were costed at every site independently. Fleet replacement schedules were then tested as an alternative route.
KEY FINDINGS
  1. The largest pit had the worst fleet mix and the tightest production schedule, making it the most expensive conversion rather than the obvious first one.
  2. Recorded conversion losses at comparable operations exceeded the client's business case assumption by a wide margin, in one case by more than two years of benefit.
  3. The underground operation offered a stronger case, with a clearer safety argument, a single equipment supplier, and a scheduled network upgrade already funded.
  4. Fleet replacement over six years would resolve the interoperability blockage at two pits without any additional capital being committed. The decision only had to be made before the replacements were ordered.
RECOMMENDED STRATEGY
Phase 1: Phase 1 (months one to fifteen): convert the underground operation first, using the funded network upgrade and the single supplier fleet. Phase 2: Phase 2 (months fifteen to forty): direct routine fleet replacement at two open pits toward one platform ahead of any conversion. Phase 3: Phase 3 (months forty to seventy-two): convert surface haulage pit by pit, sequenced against planned pushbacks rather than production targets.
OUTCOME
The largest pit conversion was deferred and the underground project brought forward. Fleet replacement specifications were rewritten toward a single platform within two quarters, and the revised business case carried a conversion loss assumption roughly four times the original (client-reported, unverified by MMA). Board approval for the surface programme was made conditional on the fleet standardisation completing first.

Frequently Asked Questions

Foundational context covering the market sizes, CAGR, scope, country, region and competition that inform every finding below. This section is provided to cover basics and most often pre-purchase conversations, answered from the MMA Primary Research Dataset.

What is the current size of the Mining Automation Market?

The market is valued at USD 4.8 billion in 2025, rising to USD 5.25 billion in 2026. Scope covers automation systems supplied to mining operations, not the underlying equipment, mine planning software, or contract mining services.

How large will the Mining Automation Market be by 2036?

MMA forecasts USD 12.89 billion by 2036, an increase of USD 7.64 billion over the 2026 base. That represents an expansion multiple of 2.46 times across the forecast period.

What is the CAGR for the Mining Automation Market 2026 to 2036?

The base case CAGR is 9.4%, with a bull case of 10.7% and a bear case of 8.2%. The historical rate from 2020 to 2025 was also 8.2%, as deployment moved beyond iron ore.

Which segment is growing fastest?

Underground automation and teleremote systems at 14.1%, exactly 1.50 times the market rate. Penetration sits near 9% of underground production tonnes, leaving more room than surface haulage now offers.

Who are the major companies in the Mining Automation Market?

Caterpillar, Komatsu, Sandvik, Epiroc, and Hitachi Construction Machinery lead on automated fleet units under management. The top five hold 62%, held there by control of the machine layer.

Which country is growing fastest?

Chile at 11.4%, where new copper capacity specifies automation from the design stage rather than retrofitting later. High altitude operations make remote operating centres genuinely valuable rather than merely convenient.

Report Segmentation Architecture

The full report scope spans multiple orthogonal segmentation dimensions, with cross-tabulated demand data provided for each dimension pair. Coverage extends further to regional breakdowns, trend trajectories, and the competitive detail needed to support segment-level decision-making.

By Automation System Type

  • Autonomous Haulage Systems
  • Autonomous Drilling And Blasting Systems
  • Underground Automation And Teleremote Systems
  • Fleet Management And Mine Control Software
  • Process Plant And Materials Handling Automation

By End-Use Industry

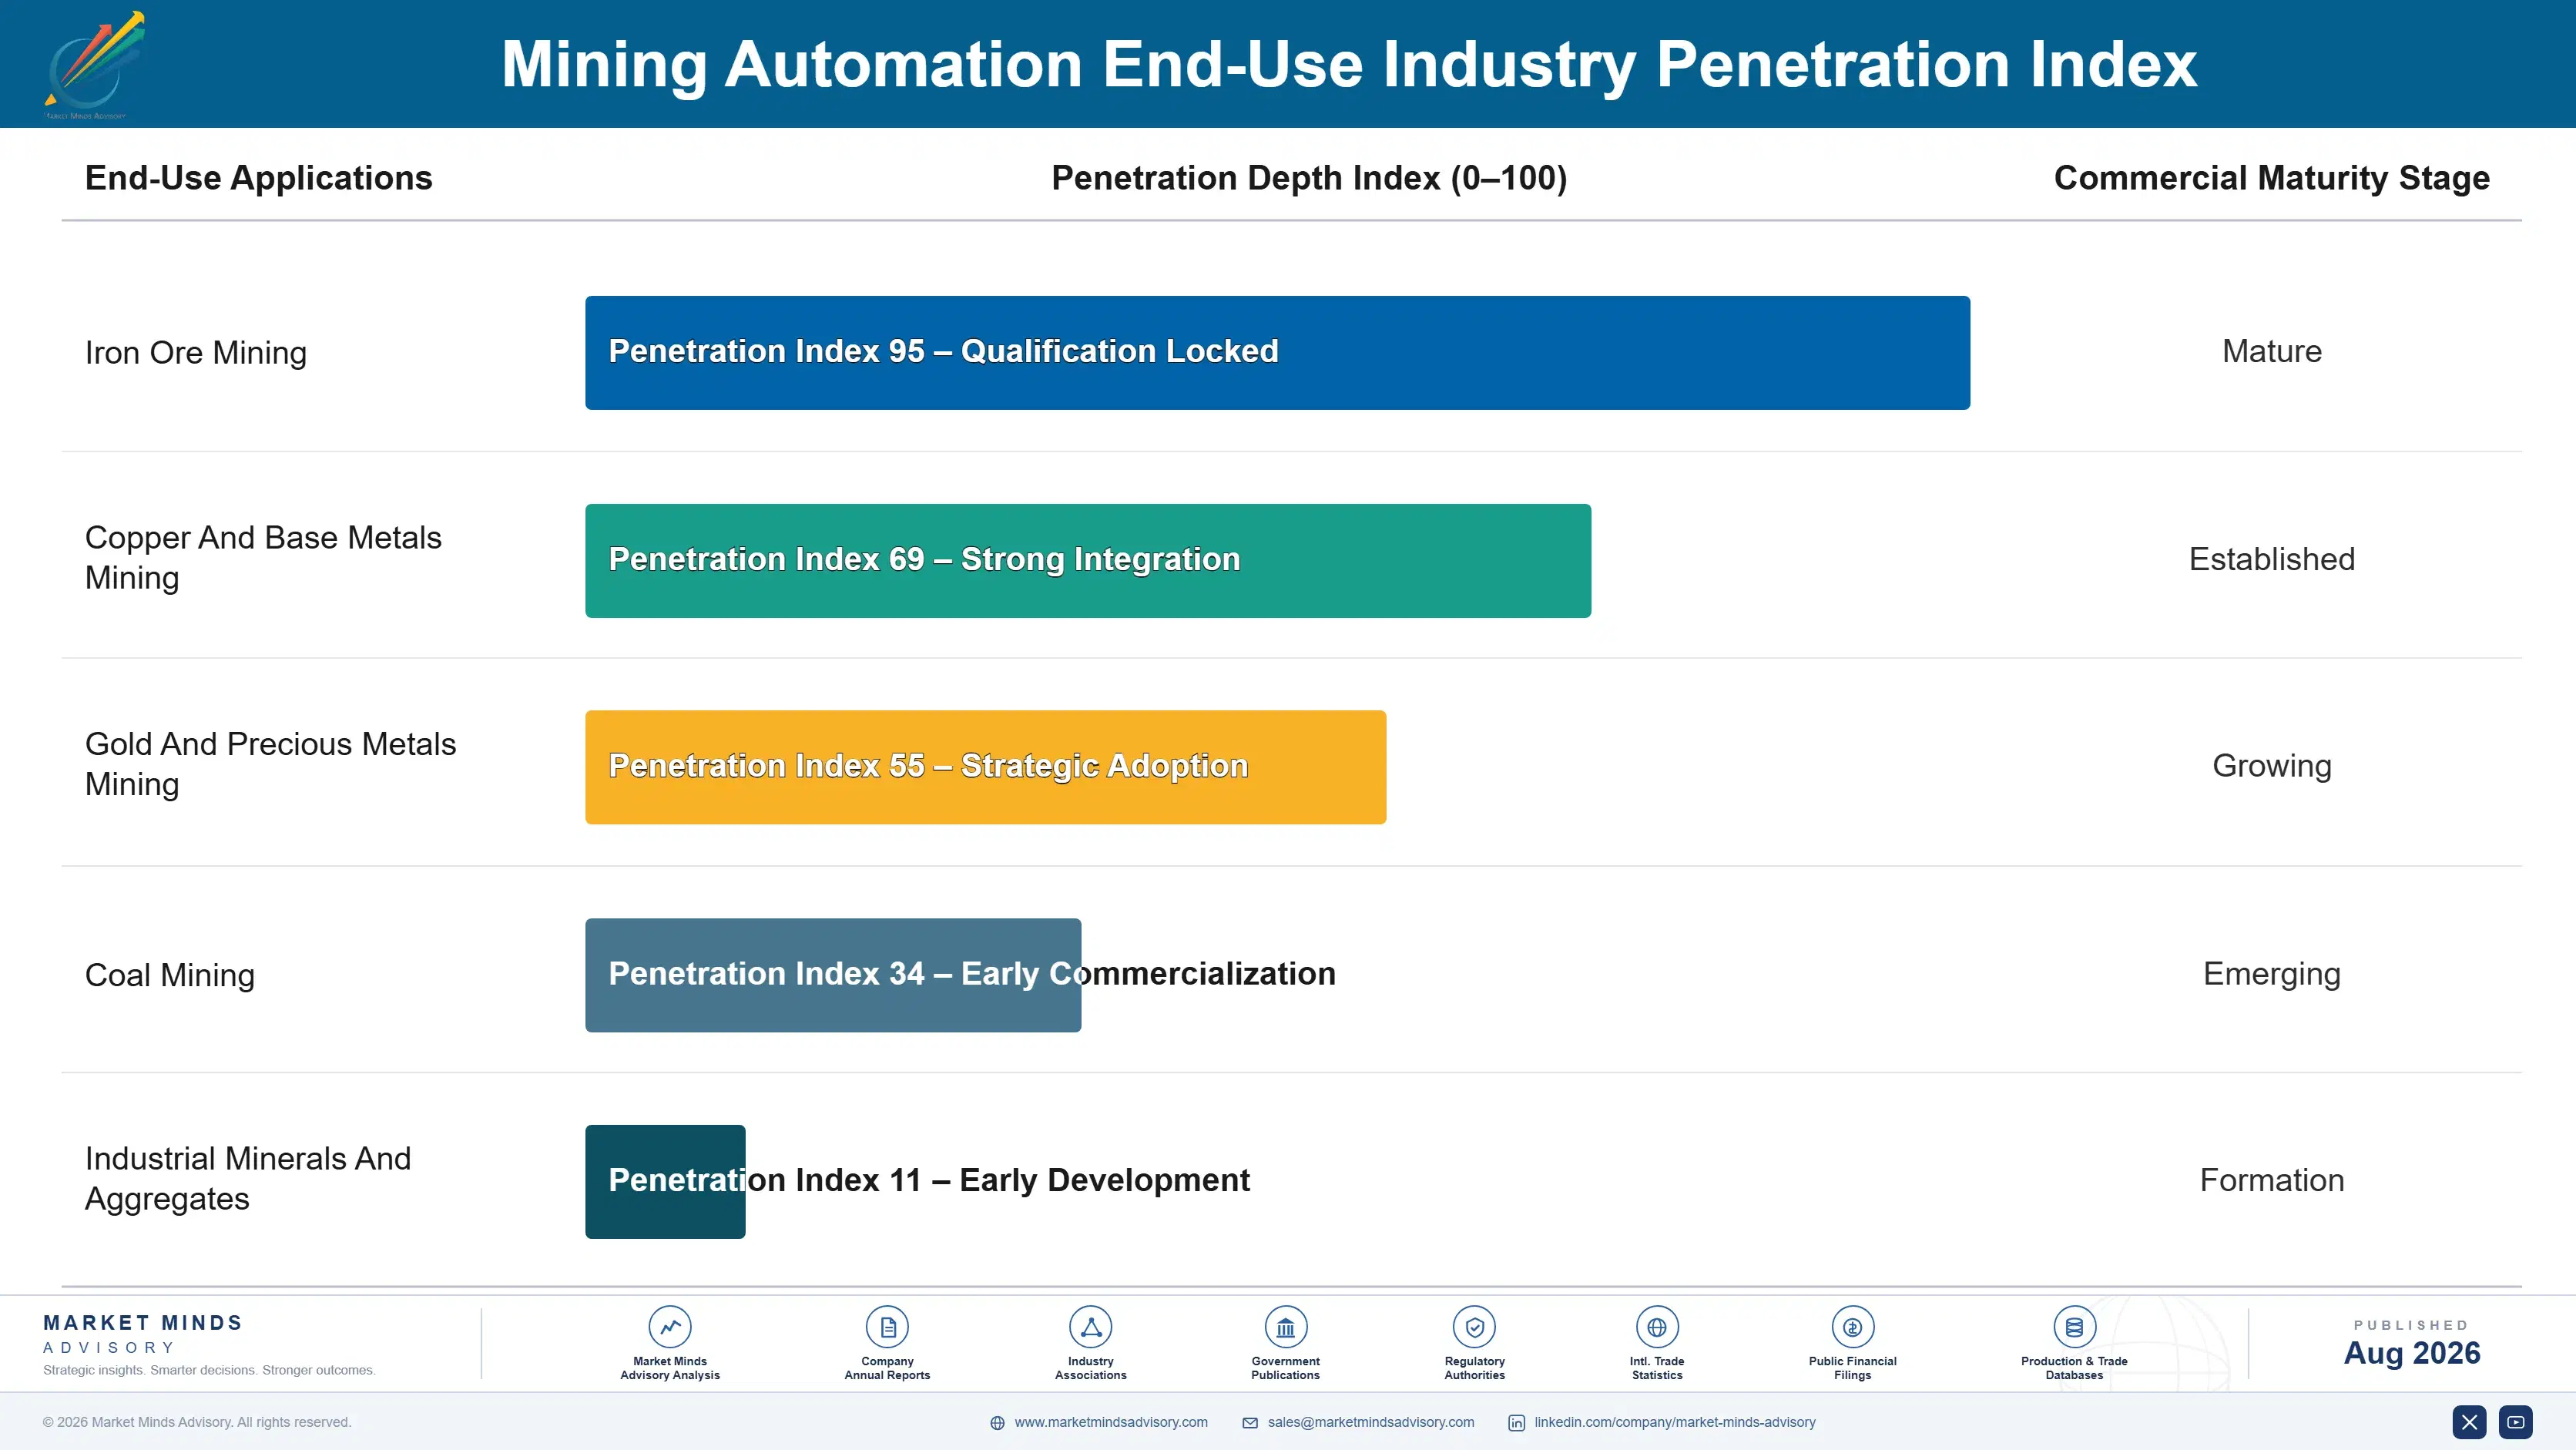
  • Iron Ore Mining
  • Copper And Base Metals Mining
  • Gold And Precious Metals Mining
  • Coal Mining
  • Industrial Minerals And Aggregates

By Commercial Model

  • Equipment Maker Bundled Automation
  • Independent System Retrofit Supply
  • Software Licensing And Subscription
  • Systems Integration And Commissioning Services
  • Managed Remote Operations Contracts

By Region

  • South Asia and Pacific
  • North America
  • Latin America
  • East Asia
  • Middle East and Africa
  • Western Europe
  • Eastern Europe

Scope, Methodology, and Coverage

Every figure in this report is reproducible from documented input assumptions. The scope below maps the historical period, the forecast horizon, the segmentation dimensions, and the countries covered, alongside the underlying primary and qualitative methodology.
Historical Period
2020 to 2025
Forecast Period
2026 to 2036
Base Year
2025 (USD billions; MMA Primary Research Dataset, August 2026)
Market Definition
This market comprises automation systems supplied to mining operations, measured at supplier revenue across equipment maker bundled, independent retrofit, software licensing, integration services, and managed operations channels. Coverage spans autonomous haulage systems, autonomous surface and underground drilling and blasting systems, underground automation and teleremote loading and hauling systems, fleet management and mine control software, and process plant and materials handling automation. Mining equipment sold without automation capability, exploration and geological modelling software, mine planning and resource estimation tools, general enterprise resource planning software, communications infrastructure procured separately from automation projects, and contract mining services fall outside scope.
Quantitative Units
USD billions (current prices); automated fleet units under management; deployment cost per converted unit; underground production tonnes under automated control
Segmentation Dimensions
By Automation System Type; By End-Use Industry; By Commercial Model; By Region
Regions Covered
South Asia and Pacific, North America, Latin America, East Asia, Middle East and Africa, Western Europe, Eastern Europe
Countries Covered
Australia, Indonesia, India, China, Mongolia, Japan, United States, Canada, Mexico, Chile, Peru, Brazil, South Africa, Zambia, Democratic Republic of Congo, Saudi Arabia, Sweden, Finland, Germany, United Kingdom, Poland, Kazakhstan, Russia, and additional markets relevant to this sector
Key Companies Profiled
Caterpillar, Komatsu, Sandvik, Epiroc, Hitachi Construction Machinery, ABB, Siemens, Hexagon, Wenco International Mining Systems, RCT, MST Global, Rockwell Automation, Schneider Electric, Trimble, Modular Mining Systems, Liebherr, Volvo Construction Equipment, Autonomous Solutions, Micromine, Metso
Quantitative Methodology
Primary survey, n=3,800 respondents, Q4 2025, six countries; demand-side model with trade association cross-validation
Qualitative Methodology
47 expert interviews, Q4 2025; applied to validate demand model assumptions, identify emerging dynamics, and assess competitive positioning
Report Format
PDF and XLSX data workbook (Word format preview document)
Publisher
Market Minds Advisory
Report Code
MMA-2026-TEC-777
Published
August 2026
Contact
sales@marketmindsadvisory.com | www.marketmindsadvisory.com

Purchase the full Mining Automation Market Report (2026 to 2036).

The full report sizes mining automation across five system types, five mining end-uses, five commercial models, and seven regions, with brownfield conversion production loss benchmarked against recorded deployments throughout. Mixed fleet interoperability blockage is assessed operation by operation, since that determines which conversions are currently possible at all. Underground network infrastructure requirements are costed separately from automation hardware. Competitive profiling covers twenty suppliers on automated fleet units under management, and control layer positions are assessed by equipment platform. Regional demand is built from orebody geography rather than from industrial output.
Brownfield conversion production loss benchmarked against recorded deployment data
Mixed fleet interoperability blockage assessed operation by operation
Underground network infrastructure costed separately from automation hardware
Control layer positions assessed by individual equipment maker platform
Underground penetration modelled against production tonnes rather than unit counts
Conversion sequencing tested against mine plans and scheduled pushbacks

Built For The People Who Decide

From boardroom strategy to bench-side execution, this report is read cover-to-cover by leaders shaping the next decade of their industry, turning demand scenarios, market dynamics and valuation benchmarks into decisions.
CXOs/ Presidents/ VPs/ Managers
M&A and Corporate Development
Strategy Teams and R&D Heads
Procurement and Product Directors
Regulatory and Compliance Leaders
Investor Relations and Equity Analysts