Market Minds Advisory
Low-Speed Vehicle Market

Low-Speed Vehicle Market: Low-Speed Vehicle Market: Commercial Fleet Substitution, Quadricycle Revival and Regulatory Patchwork

Industrial sites are replacing light trucks with low-speed vehicles on operating cost alone, European quadricycle rules have produced a genuine urban car substitute, and national regulation still determines where any of it is legal.

Lead Analyst

David Horsley

Published

August 2026

Make Smarter Decisions with Customized Research Insights

Request a free sample report and evaluate market opportunities, growth trends, and competitive dynamics relevant to your business needs.

2025 MARKET VALUE$3.4BMarket Size 2025
2036 FORECAST VALUE$9.3BBase Case , 2026 to 2036
CAGR 2026 TO 20369.6 %Bull 10.8% / Bear 8.4%
INCREMENTAL OPPORTUNITY$5.6BNet 10- year value creation
EXPANSION MULTIPLE2.50x2036 value over 2026 base
Strategic Levers
M&A Pipeline
Regional Outlook
Country Rankings
Competitive Intelligence
Segmental Deep-dive
Call-Us : 91 93563 13602

Executive Snapshot and Market Trajectory.

This category exists only where a regulator decided it should. A low-speed vehicle is defined by the rules it is homologated against rather than by anything about how it is built, and countries without such a class simply have no market at all, regardless of how much demand exists.
Commercial and industrial utility vehicles grow at 14.4%, a full 1.50 times the market rate, because a warehouse campus, an airport or a manufacturing site moving people and materials around internally has no good reason left to run a light truck. East Asia holds 37% of global value, above the standard band, because China combines the largest domestic demand anywhere with the manufacturing base supplying most of the world's units.
Concentration sits at 34% for the top five, and that figure conceals a market split three separate ways. American manufacturers built the category around cart-derived platforms, European ones built it around quadricycle regulation, and Chinese producers supply enormous volume under whatever badge an importer happens to prefer. Very few manufacturers compete across more than one of those worlds, and those few attempting it find that the engineering barely transfers between one world and the next.
Market Definition
This report covers four-wheel vehicles homologated to low-speed vehicle, neighbourhood electric vehicle or European quadricycle standards, spanning personal, commercial, industrial, hospitality and municipal applications. Golf carts sold for course use without road homologation, electric three-wheelers, motorcycles and mopeds, full-speed passenger cars, forklifts and warehouse handling equipment, and utility task vehicles without road certification are excluded from the sizing.
Base Year Value
$3.4B in 2025 (MMA Primary Research Dataset, August 2026)
Forecast Period
2026 to 2036, eleven discrete annual values
CAGR
9.6% base case. Bull 10.8%. Bear 8.4%.
Fastest Growth Segment
Commercial and Industrial Utility Vehicle: 14.4% CAGR
Fastest Growth Country
India: 12.6% CAGR
Fastest Growth Region
South Asia and Pacific: 11.8% CAGR
Largest Region
East Asia: 37% of 2025 global value
Market Leaders
Textron Specialized Vehicles, Club Car, Polaris, Waev and Guangdong Marshell Green Power lead on unit shipment volume. Source: MMA Analysis, July 2026.
Primary Survey
n=3,800 procurement and R&D decision-makers, Q4 2025, six countries
Methodology
Demand-side build-up, cross-validated against public data, 47 expert interviews

Low-Speed Vehicle Market Forecast Scenarios

low-speed-vehicle-market-analysis-trends-size-forecast-scenario-1787317042823
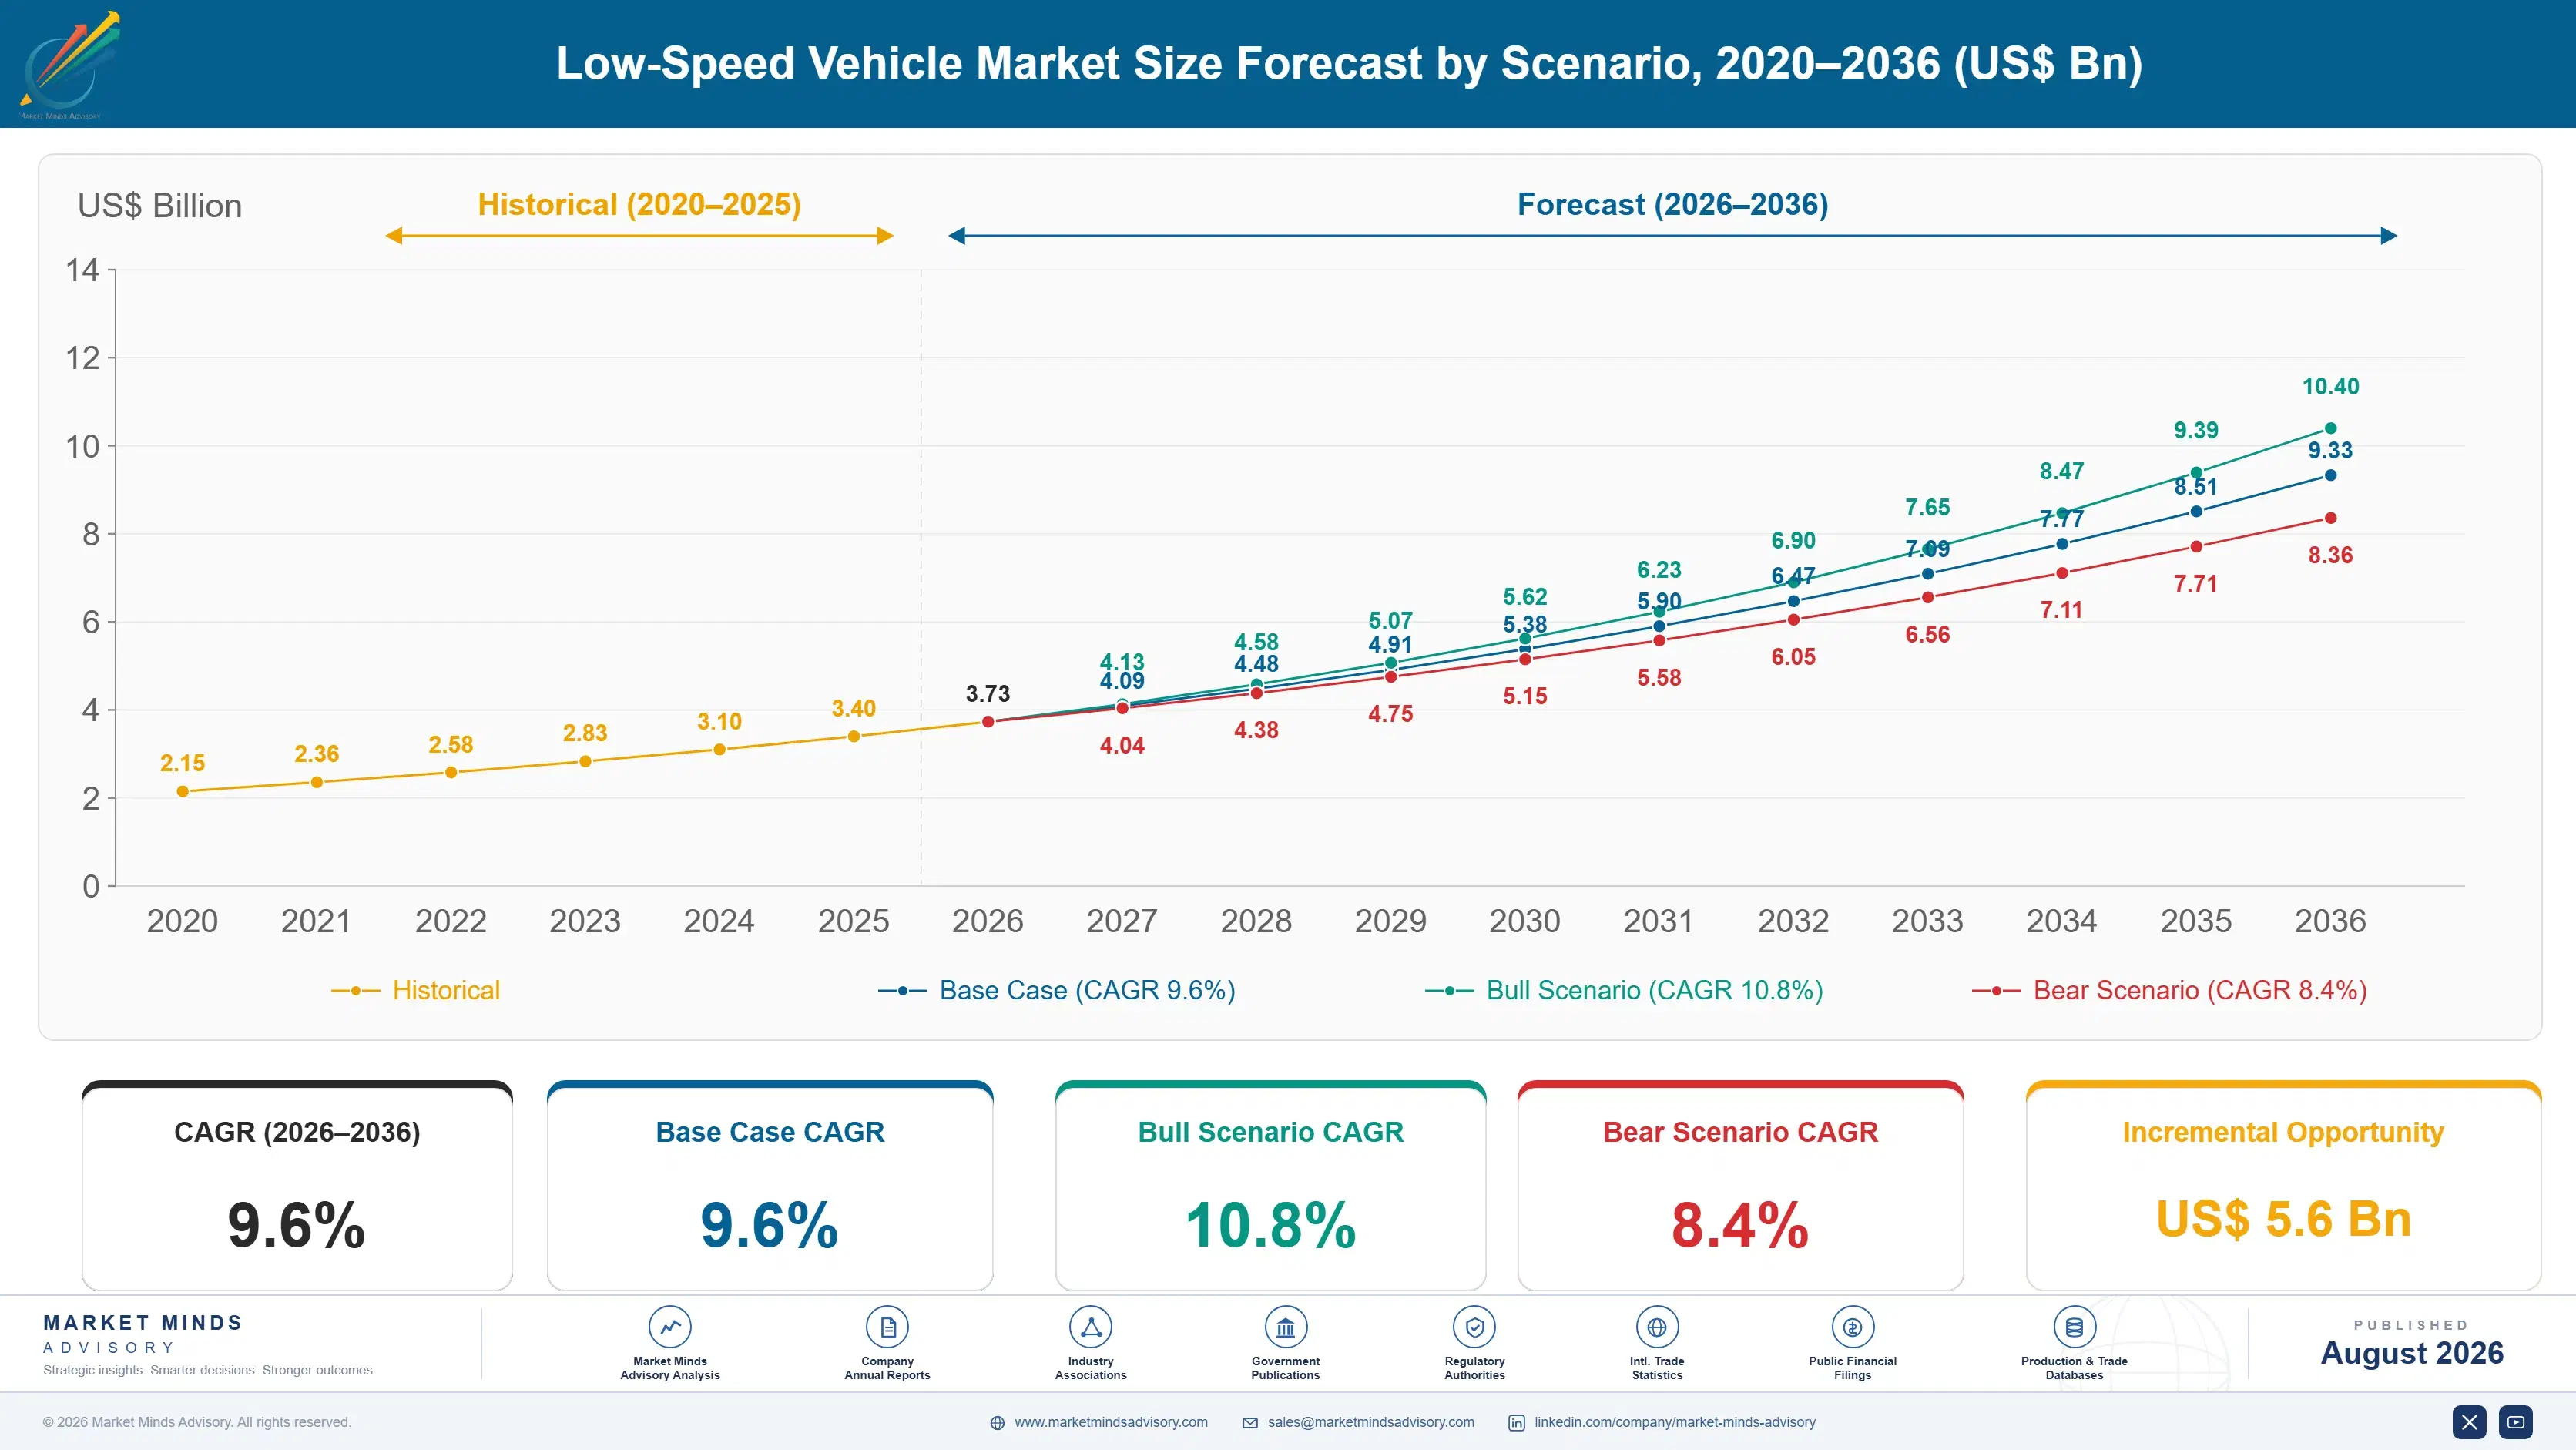
Between 2020 and 2025 the market compounded at 8.2%, and the growth came from two places nobody expected. American cart-legal residential communities expanded faster than developers had planned, turning a niche into a household purchase category. Chinese regulatory tightening after 2018 was expected to eliminate low-speed electric vehicles and instead pushed the segment toward properly homologated product at considerably higher realised value.
The base case at 9.6% rests on three mechanisms. Commercial and industrial fleet substitution keeps expanding as site operators run the arithmetic against light trucks and find it decisive. European quadricycle adoption grows on urban low emission zones, parking scarcity and a product generation that is finally desirable rather than merely legal. Residential ordinance expansion across American states continues widening where these vehicles may operate, and each change converts a private property market into a road market.
The bull case at 10.8% turns on more countries establishing a low-speed vehicle road class, which would create markets where none currently exists rather than merely growing existing ones. The bear case at 8.4% is a safety-driven regulatory tightening: these vehicles meet far lighter crash requirements than passenger cars, and a high-profile casualty pattern could restrict where they operate very quickly.

What Actually Determines Low-Speed Vehicle Value

Everything about this market follows from a regulatory definition. A low-speed vehicle is one certified against a standard that permits road use at limited speed with crash requirements far lighter than a passenger car faces, and that trade is what makes the vehicles cheap enough to be interesting.
TOP FIVE CONCENTRATION34%Share held by the five largest low-speed vehicle manufacturers
AVERAGE SELLING PRICE$12,400Typical transaction price for a street-legal passenger unit
REGULATED SPEED CEILING25 miles per hourMaximum speed permitted under low-speed vehicle homologation rules
BATTERY COST SHARE36% of COGSEnergy storage as portion of manufactured vehicle cost
PERMITTED ROAD SHARE40 statesAmerican jurisdictions permitting operation on posted local roads
HOMOLOGATION LEAD TIME14 monthsTypical time to certify a new model for road use
The consequence is that the market exists in some places and not others for reasons that have nothing to do with demand. The United States established its class decades ago and around 40 states permit road operation. Europe built a quite different framework around quadricycles that a teenager may legally drive in several countries. Most of Latin America, Africa and the Middle East have no class at all, which confines demand to private property regardless of how well the vehicles would suit the conditions.
Where the growth is strongest has little to do with any of that. Commercial and industrial operators buying for use inside their own sites need no homologation whatsoever, and the arithmetic against a light truck is simply decisive: lower purchase price, a fraction of the energy cost, minimal maintenance and no requirement for a licensed driver in many jurisdictions. That segment grows fastest and nobody regulates it.
"The most interesting thing about this industry is that its largest growth segment sits entirely outside the regulation that defines the category. A distribution centre buying forty utility vehicles has never read the homologation standard and never needs to."
Practice Director, Mobility and Specialty Vehicles, Market Minds Advisory · MMA

Market Trends

Industrial Sites Substitute Low-Speed Vehicles For Light Trucks

Distribution centres, manufacturing campuses, airports, ports and universities are systematically replacing pickups and vans used for internal movement with low-speed electric vehicles, and the argument is entirely financial. Purchase price runs roughly a third of a light truck, energy cost a fraction of fuel, and maintenance is minimal on a vehicle with no engine and few moving parts. Many jurisdictions also permit operation on private property without a driving licence. Site operators running that arithmetic across a forty-vehicle fleet reach the same conclusion consistently, whatever their view of electrification generally.
Market Impact: Covers 40 American states
European Quadricycle Products Become Genuinely Desirable Objects

The Citroën Ami, Microlino and Mobilize Duo have changed how the quadricycle class is perceived, moving it from a category associated with rural microcars toward something urban buyers actively want. Design quality rather than any regulatory change did that. The vehicles remain legally identical to what came before, limited to 45 kilometres per hour and drivable at sixteen in several countries, but they now compete for attention against small cars rather than against mobility scooters. Retail distribution through mainstream automotive dealership channels has followed accordingly, which changes who encounters the product.
Market Impact: Parks in 50% less space

Market Opportunities and Growth Drivers

Cart-Legal Ordinance Expansion Converts Private Markets To Road

Around 40 American states now permit low-speed vehicle operation on roads posted at or below thirty-five miles per hour, and municipalities keep extending that permission as developers demonstrate it sells houses. Each ordinance change converts a private property market into a road market, which is a step change rather than incremental growth because the vehicle becomes genuinely useful. Planned communities across the Sun Belt designed around cart-legal streets now support household ownership at real scale, and buyers in those developments treat the vehicle as a genuine second car rather than a leisure item.
Market Impact: Restricted to 35 mile roads

Urban Access Restriction Favours The Smallest Legal Format

European low emission zones, congestion charging and shrinking parking availability all penalise conventional cars in exactly the journeys quadricycles handle well. A vehicle roughly half the length of a small car parks where nothing else fits at all, and enters zones that exclude combustion vehicles entirely. Several cities have already introduced parking concessions specifically for the smallest vehicle categories. The commercial effect compounds with product improvement, since buyers who would once have dismissed the whole format now find vehicles they would actually choose to be seen driving around a city.
Market Impact: Requires 14 month recertification

Market Restraints and Challenges

Crash Protection Limits Where Vehicles May Legally Operate

Low-speed vehicles meet crash requirements far lighter than passenger cars, which is what makes them affordable and also what confines them to roads posted at low speed. The root cause is unavoidable physics rather than manufacturer reluctance, since meeting full passenger car standards would eliminate the weight and cost advantage entirely. Commercially this caps the addressable journey pool and makes regulators genuinely cautious about widening access further. Participants are responding with reinforced body designs, seatbelt and airbag fitment beyond requirement, and speed-limited zone geofencing that demonstrates genuine operational discipline to regulators.
Market Impact: Costs 33% of light truck

Regulatory Patchwork Fragments Distribution And Model Planning

Every jurisdiction defines the class differently, and a vehicle homologated in one market frequently cannot be sold in another without redesign and recertification taking around 14 months. The root cause is that these classes were created independently by national regulators with no coordination between them. Commercially this fragments model planning, prevents global platforms and forces manufacturers to choose which regulatory world to serve. Participants are responding by designing to the most restrictive applicable standard, by holding multiple homologations on shared platforms, and by lobbying regulators for mutual recognition between the existing classes.
Market Impact: Drivable from age 16
4 additional market trends, 3 additional growth drivers, and 2 additional restraints and challenges are covered in the full report. Contact sales@marketmindsadvisory.com to access the complete intelligence.

Segment CAGR and Growth Architecture

Segmentation follows vehicle application class, because who uses the vehicle determines the homologation route required, the body and equipment specification, the sales channel that reaches the buyer and the price the market will bear. Battery chemistry, chassis architecture and feature content all sit downstream of that application decision and are priced directly against it.
low-speed-vehicle-market-analysis-trends-market-share-analysis-1787317043357

Commercial and Industrial Utility Vehicle

The fastest segment at 14.4%, a full 1.50 times the market rate, covering vehicles bought by distribution centres, manufacturing campuses, airports, ports, universities and hospitals for moving people, tools and materials inside their own sites. The argument is entirely financial and it is decisive. Purchase price runs roughly a third of a light truck, energy costs a fraction of fuel, maintenance is minimal on a vehicle with no engine, and many jurisdictions permit operation on private property without a licensed driver. Homologation is frequently unnecessary because the vehicle never leaves the site, which removes the regulatory constraint that defines the rest of this market and makes the segment considerably easier to serve globally.
CAGR 14.4%

Micro Cargo and Last-Mile Delivery Vehicle

Growing at 12.0% on small enclosed cargo vehicles serving last-mile parcel, grocery and food delivery in dense urban areas where vans are increasingly restricted or simply impractical to park. Access rather than cost drives adoption here. Low emission zones, pedestrianised centres and delivery time windows all penalise conventional vans, and a quadricycle-class cargo vehicle threads through restrictions that stop a van entirely. Payload is the obvious constraint here, since the weight limits defining the class cap what the vehicle may legally carry. What makes the segment work commercially is route density, because operators running many short drops per shift recover the payload disadvantage entirely through avoided parking and access delays.
CAGR 12.0%
Full segment breakdown across 5 segments available in the complete report.

Regional Architecture and Country Demand Map

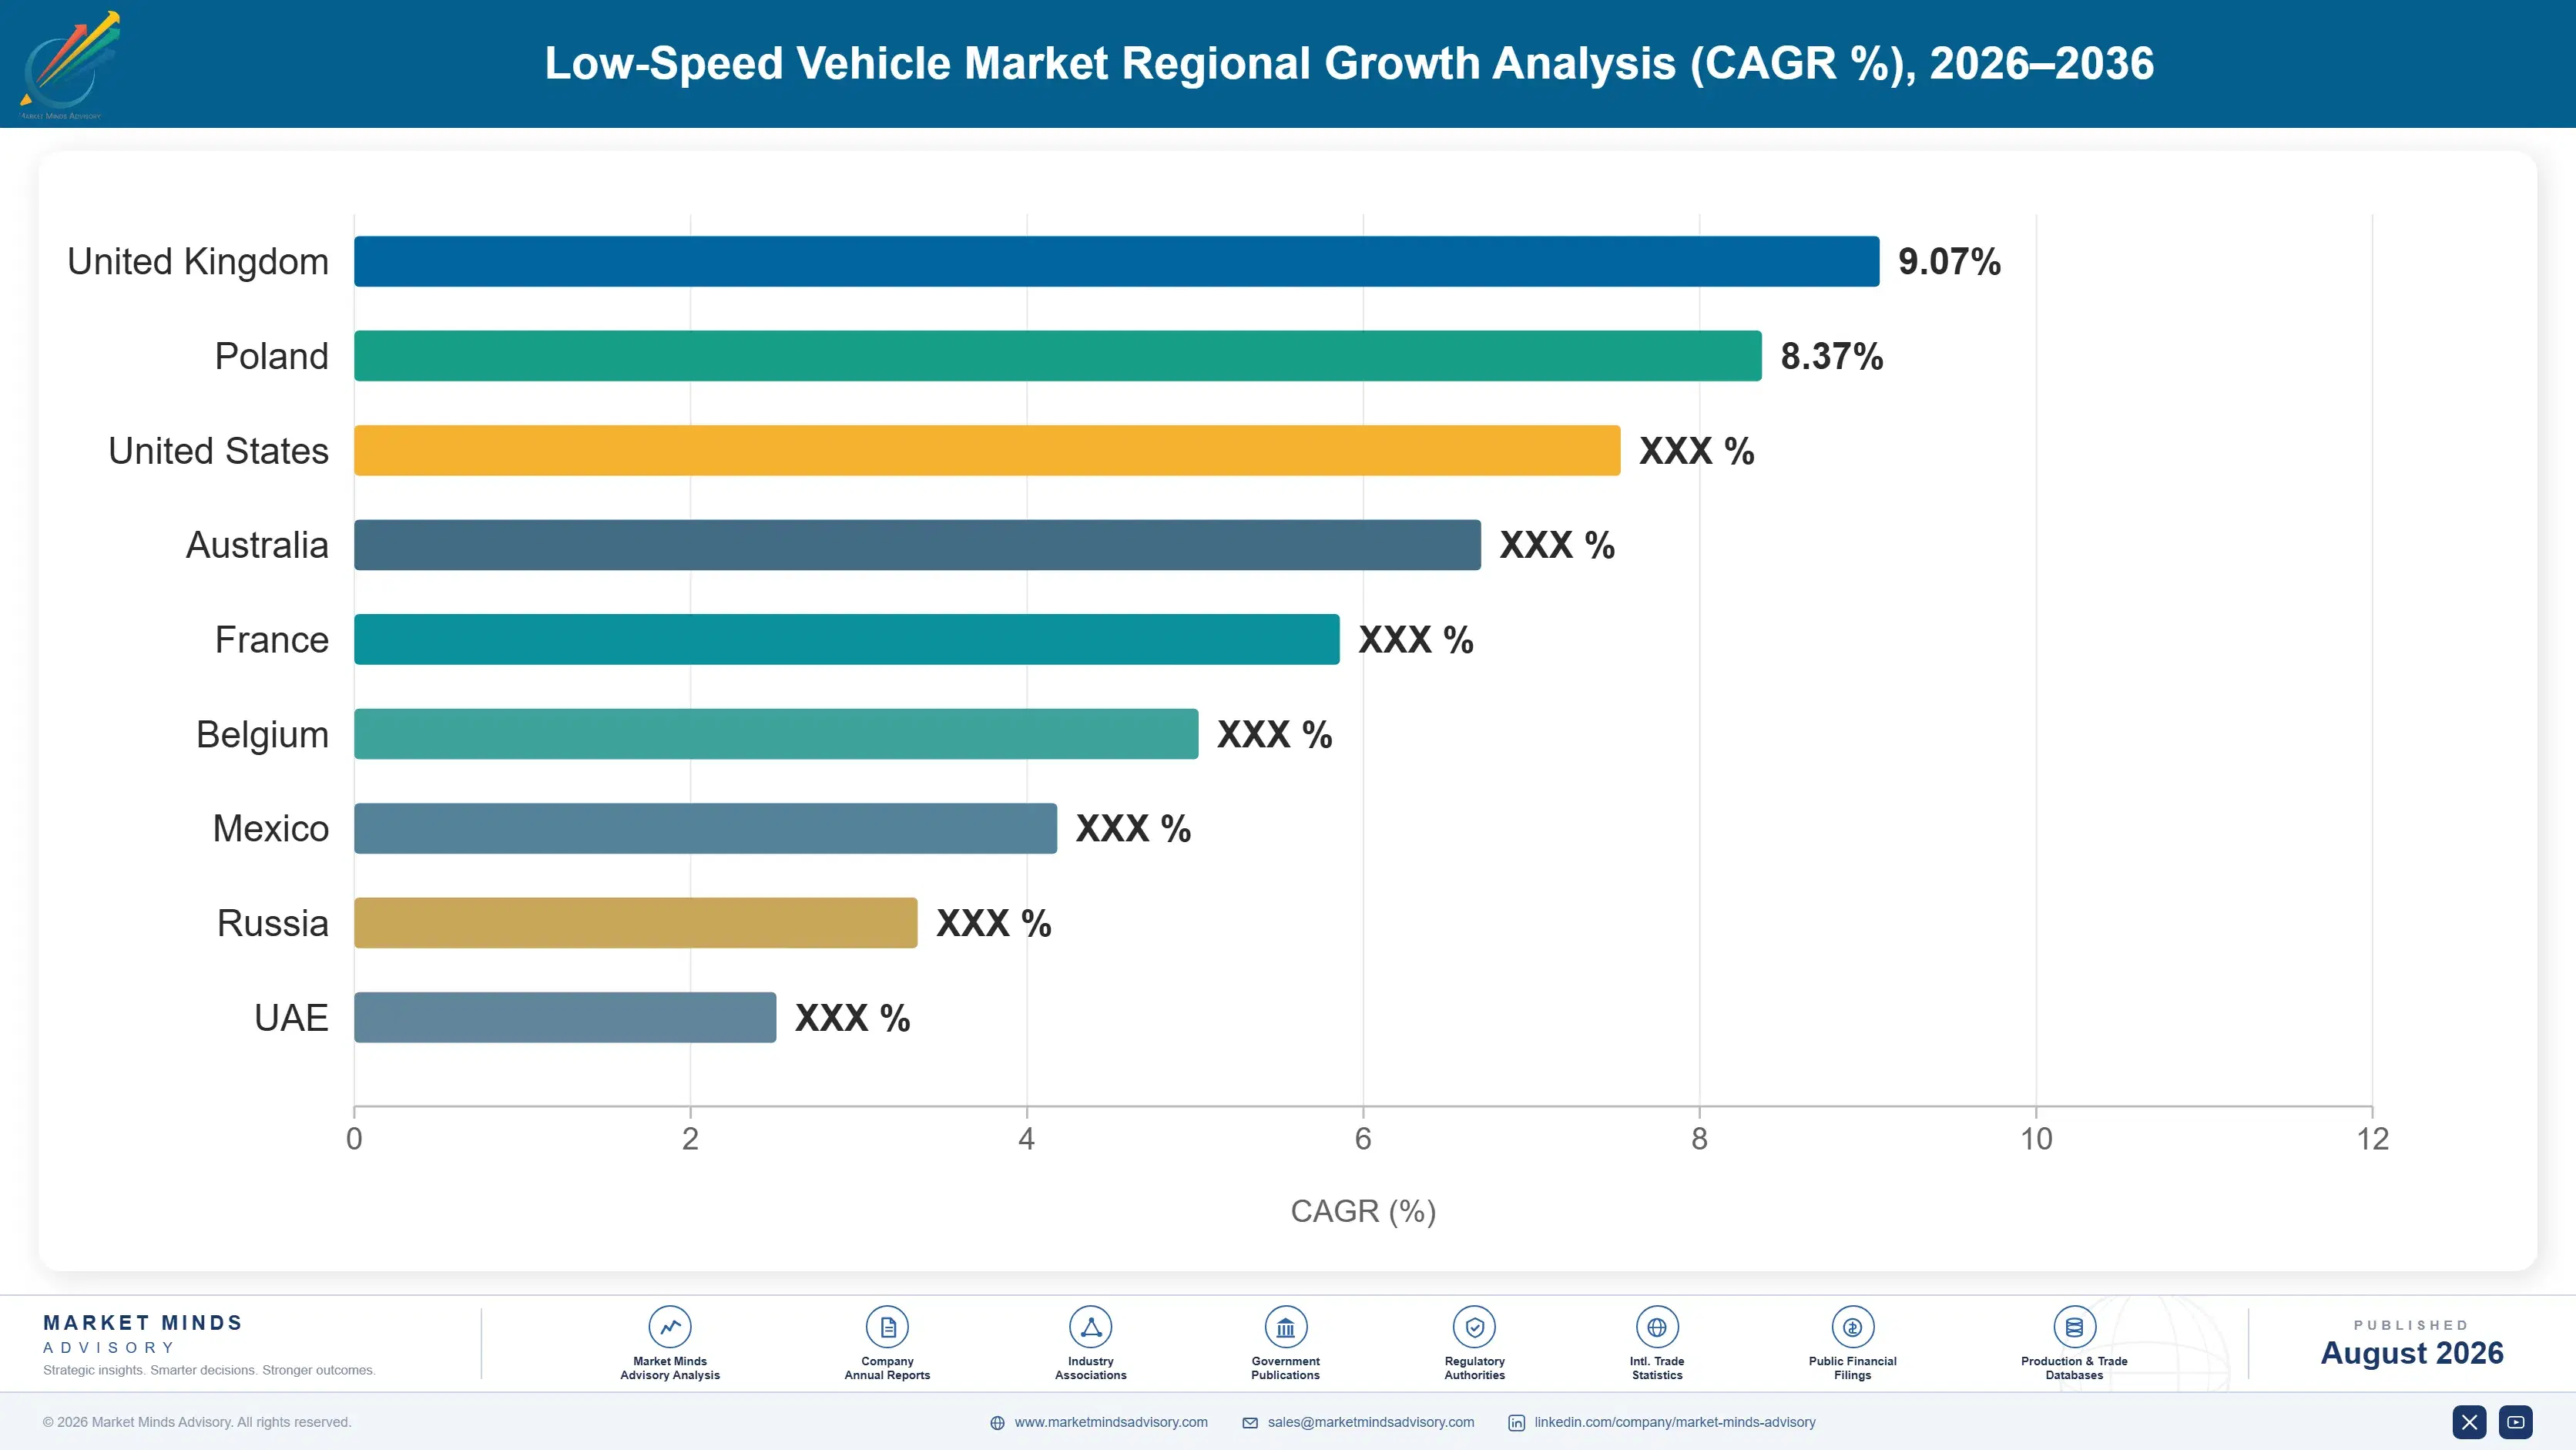
East Asia holds 37% of global value on Chinese domestic demand and the manufacturing base supplying most of the world's units. North America follows on genuine regulatory clarity and cart-legal communities, while growth runs fastest across South Asia and Pacific on urban journey substitution economics.

East Asia

Note: East Asia holds 37% against a 22 to 30% band because China combines the largest domestic low-speed electric vehicle demand anywhere with the manufacturing base supplying most of the world's units. Guangdong and Shandong producers build for domestic buyers and export heavily under other companies' badges into North America and Europe. Chinese demand sits in smaller cities and county towns where a low-speed four-wheeler substitutes for a car nobody can afford to run, and regulatory tightening after 2018 pushed that segment toward properly homologated vehicles rather than eliminating it. Japanese and Korean demand concentrates in resort, campus and industrial site applications instead. Manufacturing and demand reinforce each other here in ways no other region matches.
Share: 37% | CAGR: 10.8% (2026 to 2036)

North America

Regulatory clarity makes this region unusual. Federal Motor Vehicle Safety Standard 500 established a genuine low-speed vehicle class decades ago, and around 40 states permit operation on roads posted at thirty-five miles per hour or below, which created a legitimate market rather than a grey area. Planned communities across Florida, Arizona, Texas, Georgia and the Carolinas designed around cart-legal streets now support household ownership at real scale. Commercial and industrial adoption is the faster-growing half, with warehouse campuses, airports, universities and manufacturing sites replacing light trucks for internal logistics on straightforward operating cost arithmetic. Regulatory clarity created a genuine market here rather than a grey area, and that distinction explains almost everything about how the region behaves.
Share: 26% | CAGR: 9.1% (2026 to 2036)
Regional intelligence for 5 additional markets available in the complete report: Western Europe, South Asia and Pacific, Latin America, Middle East and Africa, Eastern Europe. Contact sales@marketmindsadvisory.com.
low-speed-vehicle-market-analysis-trends-country-cagr-analysis-1787317043873

Where Low-Speed Vehicle Margin Is Won

Four positions separate manufacturers building durable businesses from those assembling badged imports: selling total cost of ownership to fleet buyers rather than price to consumers, holding homologation across several regulatory worlds on one platform, building service networks that fleet customers demand, and reaching residential buyers through the kind of dealers who have never sold anything remotely similar before.

Sell Total Cost Of Ownership To Fleet Buyers

A distribution centre or airport replacing light trucks is running an arithmetic exercise, not making a preference decision, and manufacturers who can demonstrate energy, maintenance and driver cost across a five year horizon win the comparison outright. Suppliers presenting documented fleet operating data realise 22% to 30% higher unit pricing than those quoting a purchase price alone, because the buyer is comparing against a truck rather than against a competitor. The work involved is commercial analysis rather than engineering, which makes it considerably quicker to build than any product capability.
Market Impact: Realises 30% higher pricing across

Hold Homologation Across Several Regulatory Worlds

American low-speed vehicle rules and European quadricycle classes define genuinely different vehicles, and recertifying between them takes around 14 months plus the kind of redesign work that nobody budgets for. Manufacturers engineering one platform to satisfy several standards from the very outset reach two or three times the addressable market on a single development programme, and they hold 18% to 25% better return on that engineering spend as a result. The discipline required is designing to the most restrictive requirement at the very start, which is considerably cheaper than retrofitting compliance afterwards.
Market Impact: Reaches 3 times the addressable mar

Build Service Networks Fleet Customers Genuinely Require

A site operator running forty vehicles on internal logistics cannot have several of them off the road waiting on parts, and that single fact excludes most manufacturers from serious fleet tenders entirely. Suppliers holding authorised service coverage and stocking spares across their territories win fleet business at 20% to 27% higher realised prices, because uptime rather than purchase price is what the buyer is actually purchasing. The investment required is inventory and partner management rather than any manufacturing capital at all, which makes it achievable within a single planning cycle.
Market Impact: Wins fleet work at 27% higher reali

Reach Residential Buyers Through Unconventional Dealer Channels

Households in cart-legal communities shop powersports, marine and independent outlets rather than automotive dealerships, and manufacturers signing those territories early hold 15% to 22% higher realised price than any competitor reaching the same buyer through golf or industrial channels. Territory across the Sun Belt states driving this growth is genuinely finite and is being claimed right now. The build cost here is dealer recruitment, floor plan financing and ongoing territory management rather than any engineering, which makes it considerably faster to execute than any product programme. Timing rather than capability decides this one.
Market Impact: Adds 22% realised price across the

Who Controls the Margin Pool

Concentration sits at 34% for the top five measured on unit shipment volume, the basis used throughout this section. Textron Specialized Vehicles and Club Car lead through cart-derived platforms and established dealer coverage, Polaris and Waev hold strong commercial and industrial positions, and Guangdong Marshell supplies enormous volume including substantial output badged for other companies. The gap to the next tier is narrow in units and considerably wider in service coverage.
Competitive activity runs on three fronts. Fleet service capability is the first, since commercial buyers specify uptime guarantees that most manufacturers cannot support. Multi-market homologation is the second, and it determines how much addressable market one development programme can reach. The third is residential dealer territory, where challengers have moved fastest and traditional manufacturers were simply unprepared for the channel.

Pressure arrives from two directions. Chinese manufacturers supply finished vehicles at delivered costs no Western assembler approaches, frequently as unbranded product carrying whatever badge an importer prefers. Separately, European automotive manufacturers have entered the quadricycle class with genuine design capability and distribution. Rankings will shift as commercial fleet volume overtakes personal ownership, which on current trajectory happens before 2032.
low-speed-vehicle-market-analysis-trends-company-positioning-matrix-1787317044393

Competitive Moat and Risk Dimensions

POLARIS

Moat: Commercial fleet distribution depth

An established dealer and service network built across powersports and utility vehicles reaches exactly the commercial and industrial buyers now driving growth, and it supports the uptime guarantees fleet tenders increasingly demand. Manufacturing scale across adjacent vehicle categories also spreads engineering and component purchasing across volumes a low-speed specialist cannot approach.
POLARIS

Risk: Discretionary demand cycle exposure

The wider powersports business swings sharply with consumer confidence and interest rates, and downturns there consume management attention and capital that the low-speed vehicle business needs. Commercial fleet demand behaves quite differently, but it competes internally against recreational products with faster payback and louder advocates inside the organisation.
TEXTRON SPECIALIZED VEHICLES

Moat: Platform breadth and manufacturing scale

A common chassis architecture spanning golf, commercial transport, campus utility and street-legal residential configurations spreads engineering and tooling across far more units than any single-segment manufacturer supports. That breadth also gives dealers a fuller catalogue, which improves territory economics and makes the brand harder to displace at distributor level.
TEXTRON SPECIALIZED VEHICLES

Risk: Weak residential channel presence

Distribution built around golf facilities counts for very little with households in cart-legal communities, who shop powersports and independent outlets where challengers have signed territory aggressively. Rebuilding reach there means competing for showroom space against brands already established, and the residential segment is where personal ownership growth actually sits.

Players Tracked

Prominent Players

Textron Specialized Vehicles
Club Car
Polaris
Waev
Guangdong Marshell Green Power

Other Key Players

ICON Electric Vehicles
Evolution Electric Vehicles
Bintelli
Tomberlin
STAR EV
Ligier Group
Aixam
Micro Mobility Systems
Stellantis
Renault Group
Yadea Technology Group
Dongguan Excar Electric Vehicle
Xiamen Dalle New Energy
Columbia Vehicle Group
Moto Electric Vehicles

Recent Developments

MARCH 2025

Distribution operator replaces light truck fleet with low-speed vehicles

A major logistics operator replaced the light trucks used for internal site movement across several distribution centres with electric low-speed vehicles during the year, citing energy, maintenance and driver licensing costs rather than any emissions commitment at all as the deciding commercial factor behind the change.
Signal: Commercial fleet substitution is being dri
AUGUST 2025

European quadricycle range extended through automotive retail channels

A major European automotive manufacturer extended its quadricycle range and moved its distribution into mainstream automotive dealership networks rather than the specialist outlets used previously, which treats the format as a genuine urban vehicle proposition rather than as the regulatory curiosity it had long been considered.
Signal: Quadricycles are being sold as urban cars
NOVEMBER 2025

Additional state ordinance opens road access to residential communities

A further American state adopted full low-speed vehicle road access provisions during the year covering local roads posted at or below thirty-five miles per hour, which converted what had been a private property market across its planned communities into a genuine road vehicle market almost overnight.
Signal: Each ordinance change converts a private p

What Drives Low-Speed Vehicle Cost

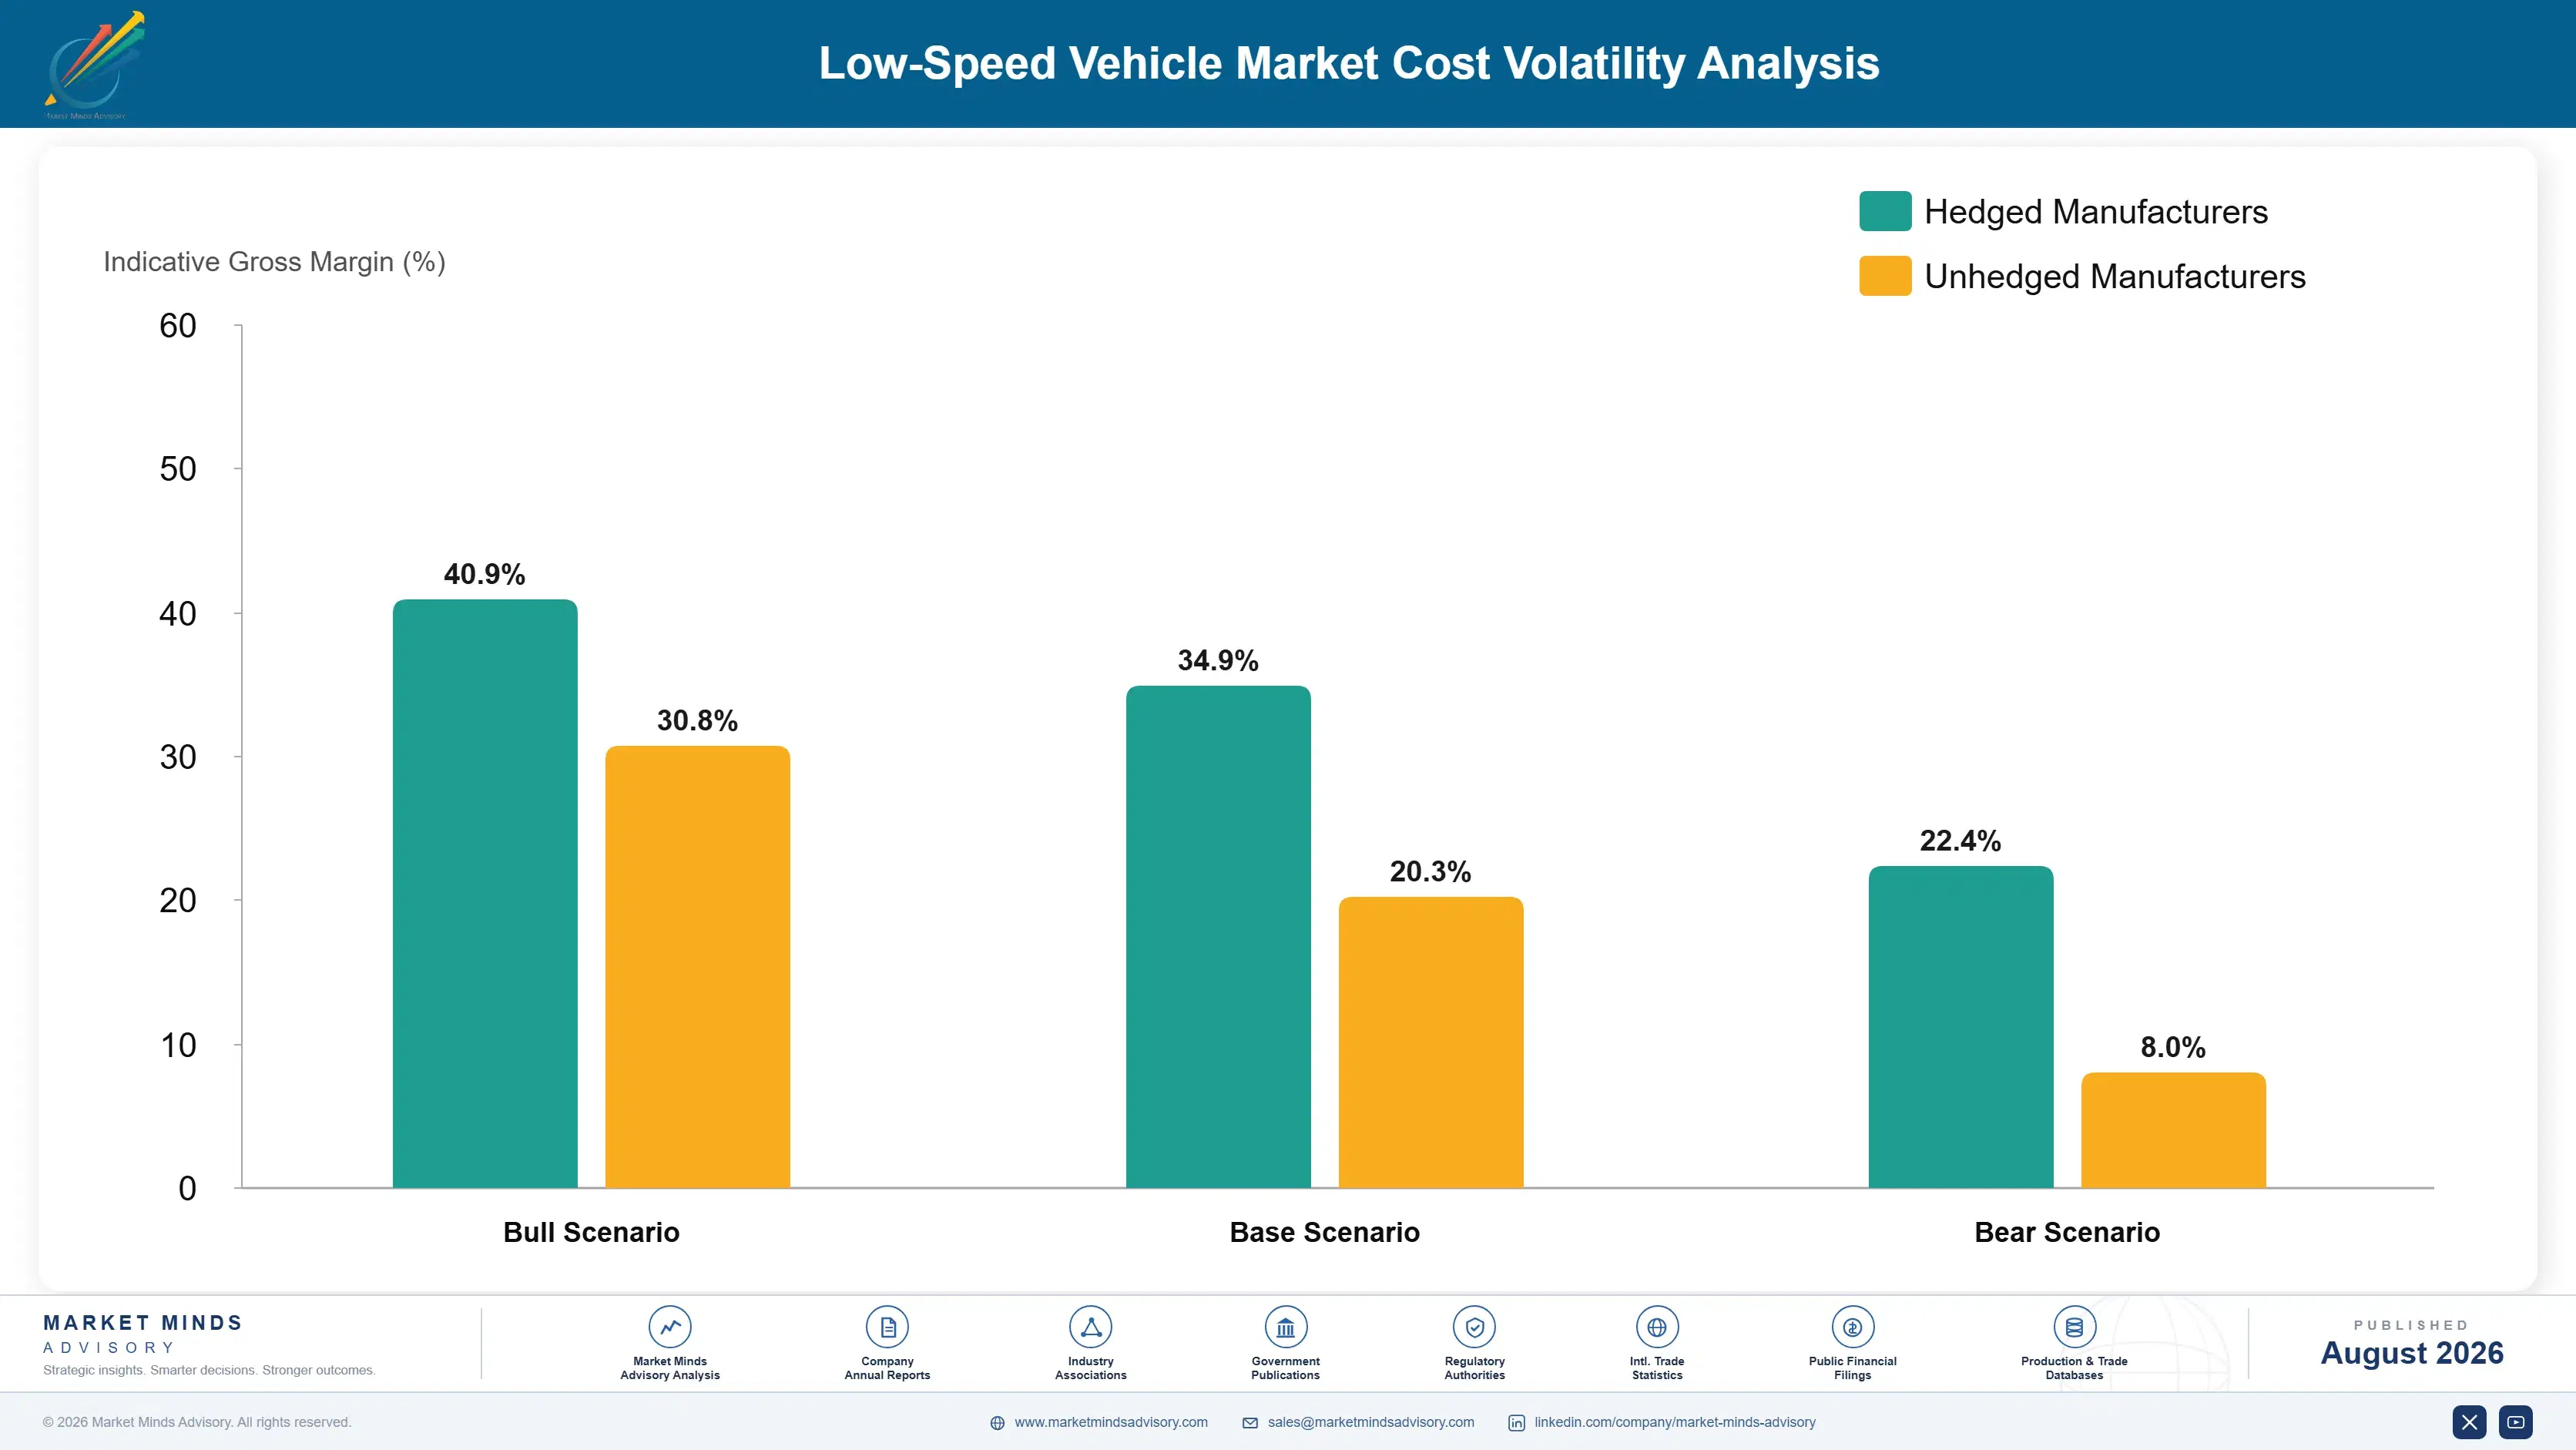
Battery cells and pack assembly account for roughly 36% of manufactured cost, sourced almost entirely from Chinese and Korean producers regardless of where the vehicle is assembled. Steel and aluminium chassis content adds around 17%, body panels, glazing and interior trim roughly 12%, and motor plus controller a further 11%. Homologation, testing and compliance documentation contribute about 5% on road-certified product, a cost private property applications avoid.
Lithium carbonate pricing collapsed through 2023 and 2024 after the 2022 spike, cutting pack costs materially and passing through as larger batteries at unchanged retail rather than lower prices. IEA battery price tracking shows that decline clearly. Cell tariff measures during 2025 moved the other way for North American assemblers specifically, and Polaris Annual Report 2025 identifies input cost and tariff exposure as continuing factors.

The disadvantage mechanism is homologation cost spread rather than component purchasing. A manufacturer certifying one platform against a single national standard amortises that spending across a much smaller volume than one holding several homologations on a shared architecture, and the gap runs to real money per unit at modest volumes. Exposure varies by application too: private property fleet product avoids certification entirely, which partly explains its better margins.
low-speed-vehicle-market-analysis-trends-cost-volatility-analysis-1787317044589

Design one platform against the most restrictive standard

Engineering a shared architecture to satisfy the strictest applicable homologation from the outset, then certifying it in several markets, spreads compliance cost across far more units than sequential market-by-market development does. The discipline is upfront rather than retrofitted, which is where most manufacturers get it wrong. It also opens markets that would otherwise need a separate programme.

Standardise pack format across the whole model range

A single cell format and pack architecture spanning several models concentrates purchasing volume, allows shared certification test evidence and simplifies the spare parts position across fleet service networks. The constraint is design flexibility, since every model must then work within one pack envelope. On a product where cells exceed a third of cost, that constraint is worth accepting.

Assemble regionally where tariff exposure justifies the cost

Cell and component tariff measures have made fully imported vehicles progressively less competitive in several markets, and regional assembly is modest investment compared with full manufacturing since powertrain content still arrives from established suppliers. The decision turns on whether the tariff regime looks durable enough to justify committing capacity against it, which is a political judgement rather than engineering.

Portfolio Architecture for Margin Defence

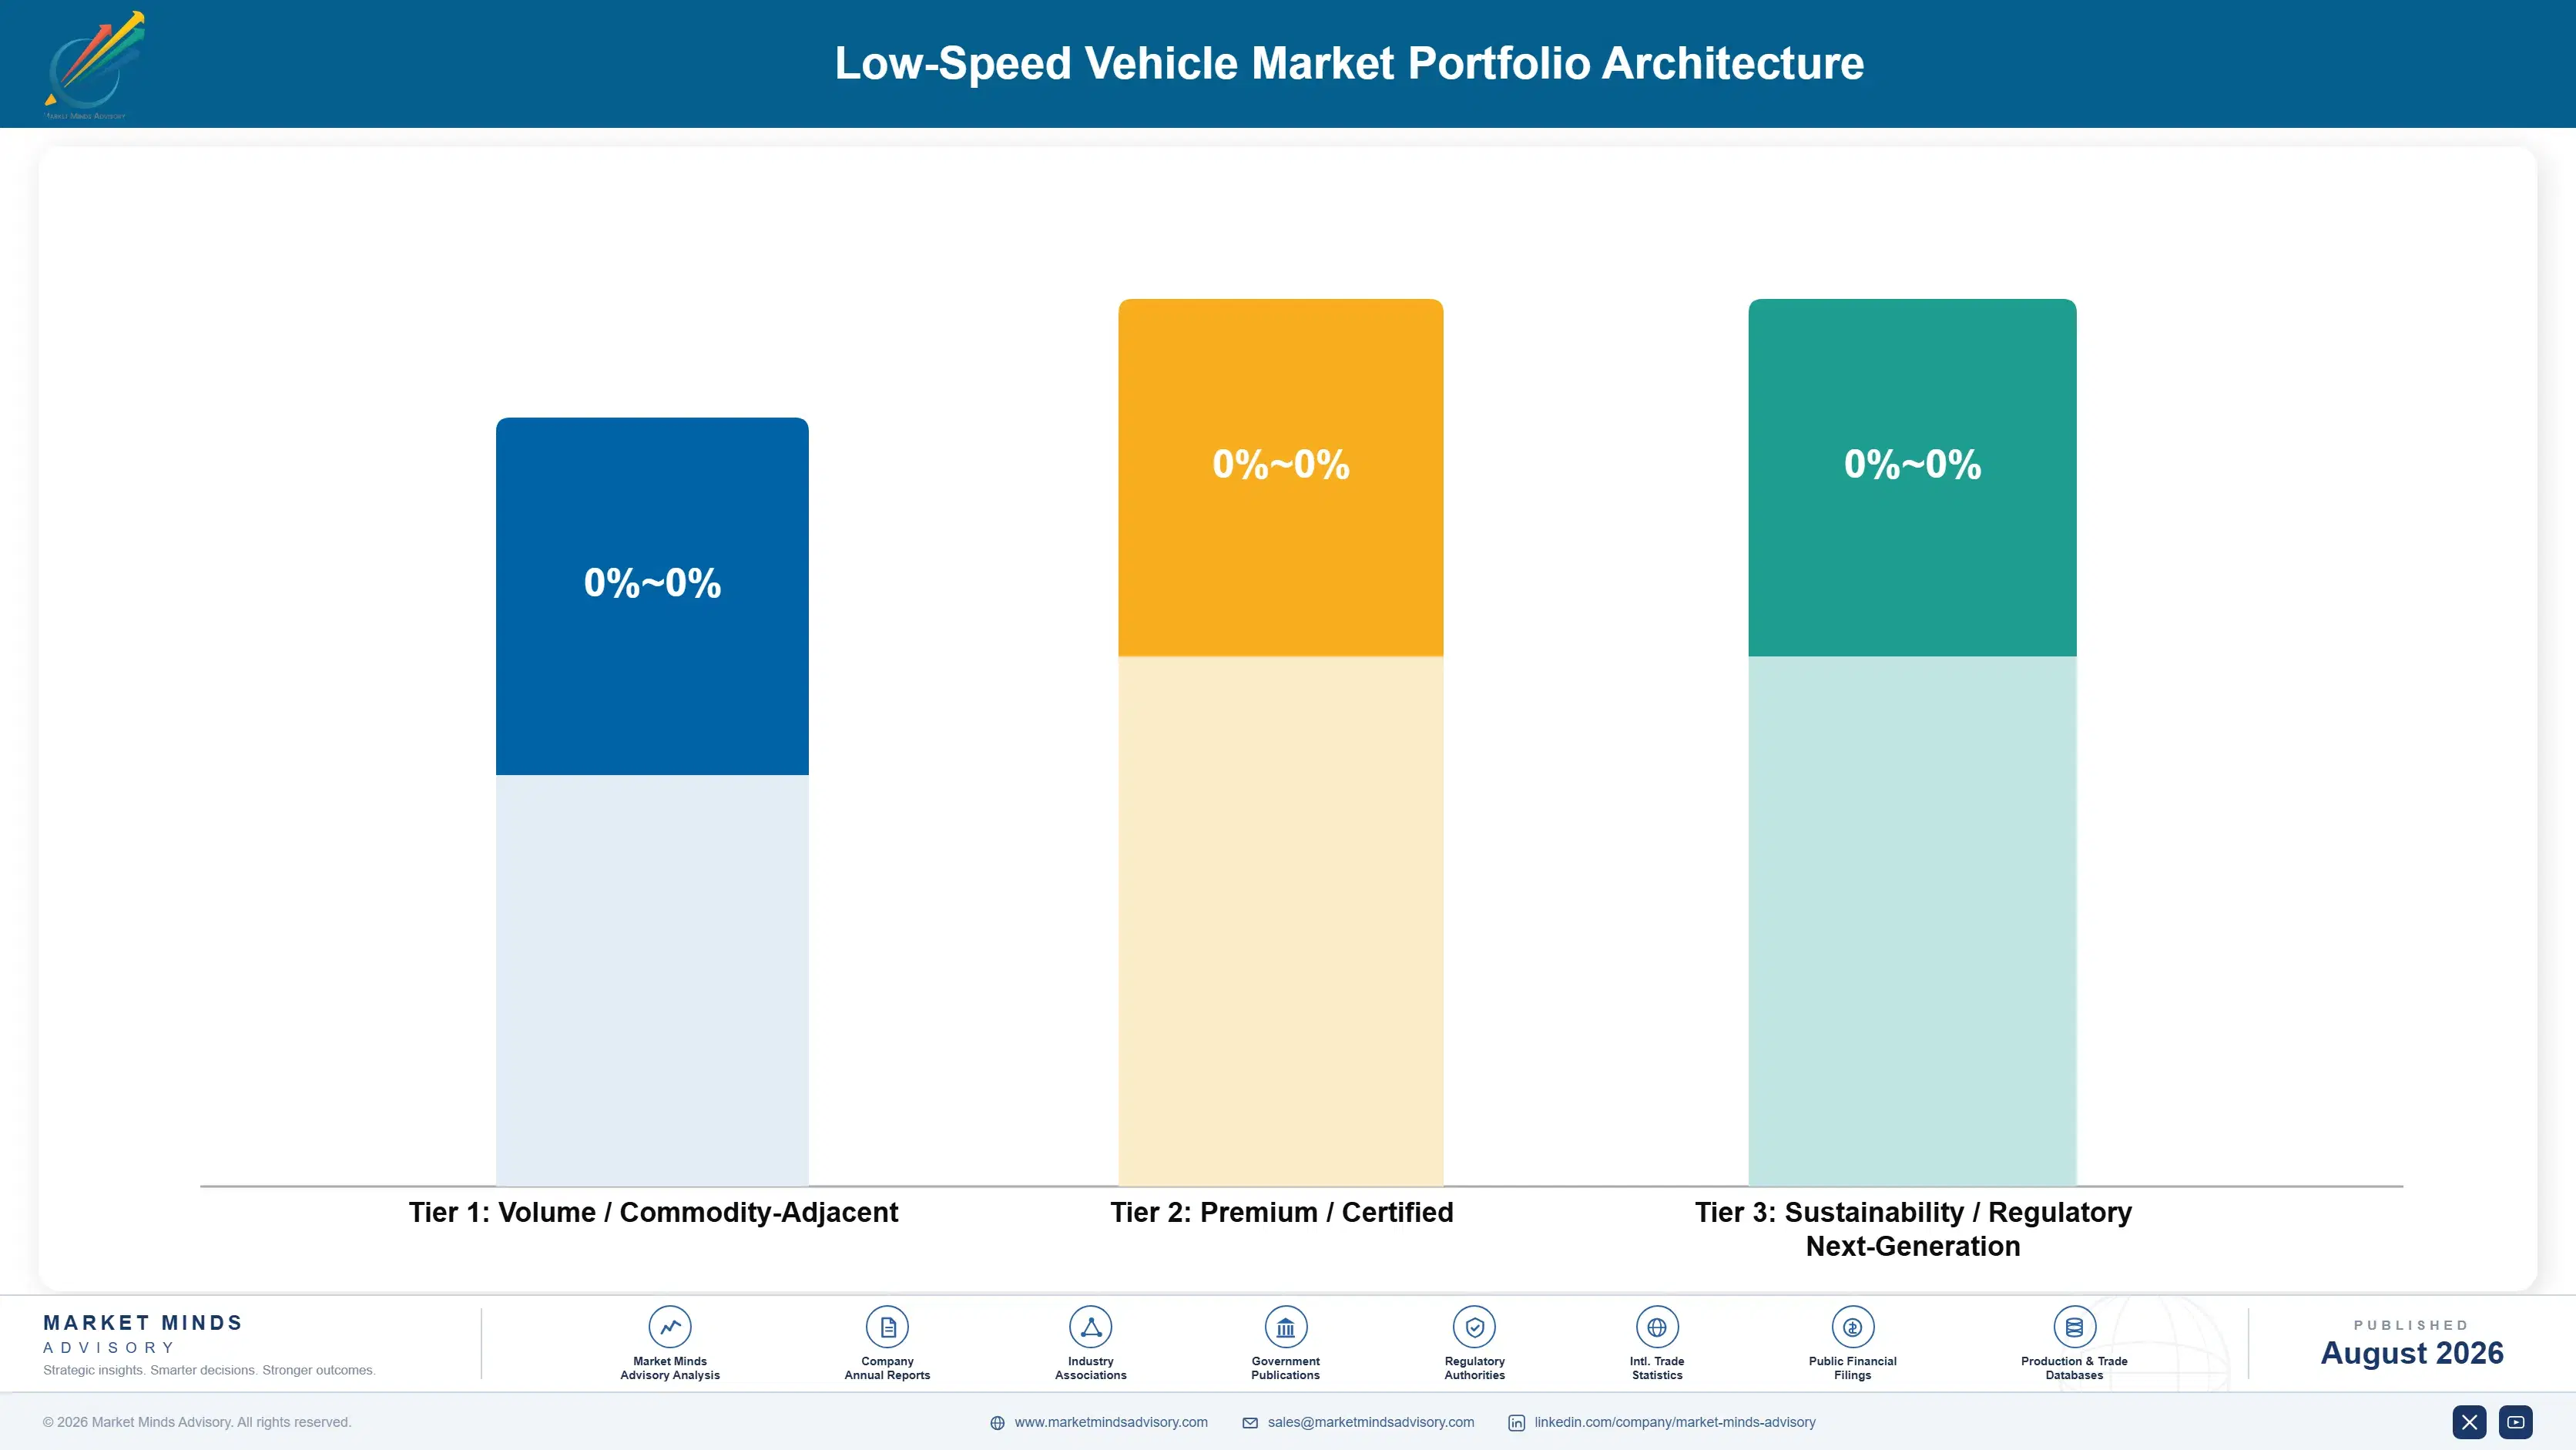
Portfolio economics here divide on buyer and homologation rather than on vehicle configuration. Entry-level personal vehicles sold through general retail earn gross margins in the mid teens, because Chinese-supplied product is a close substitute at any specification, the badge carries limited pricing power and buyers at that price point compare feature lists directly against each other. Volume secures shelf presence rather than any margin.
The premium tier is street-legal residential product sold through specialist dealers. Homologation content, comfort and safety equipment, service support and financing together command considerably higher pricing on a chassis costing only modestly more to build, and margins run in the high twenties to mid thirties across that work. Dealer quality decides where in that range a brand lands.

Above both sits commercial and industrial fleet supply. The buyer is comparing against a light truck rather than against a competitor's vehicle, uptime rather than purchase price decides the award, and multi-year fleet agreements carry parts and service revenue behind the hardware. Private property applications also avoid homologation cost entirely. Margins reach the high thirties, and the demand grows on operating cost arithmetic that no consumer sentiment cycle disturbs.

Volume / Commodity-Adjacent

Entry-level personal vehicles sold through general retail channels. Chinese-supplied product is a close substitute at almost any specification, the badge carries limited pricing power, and buyers compare feature lists directly.
Gross Margin: 14 to 19%

Premium / Certified

Street-legal residential vehicles with full homologation, safety equipment and dealer service support. The range is wide because homologation scope and dealer network quality both vary considerably between manufacturers and markets.
Gross Margin: 27 to 35%

Sustainability / Regulatory / Next-Generation

Commercial and industrial fleet supply under multi-year agreements with parts and service attached. The range reflects the gap between single fleet orders and full supply partnerships carrying genuine uptime obligations.
Gross Margin: 34 to 42%
low-speed-vehicle-market-analysis-trends-portfolio-architecture-1787317045094

High-value Sub-segments and Strategic Watch-out

Industrial Site Fleet Supply Agreements

High value and high growth sitting very squarely together. The buyer here compares against a light truck rather than against any rival vehicle, private property use avoids homologation cost altogether, and multi-year supply agreements carry parts, battery and service revenue along behind the hardware itself.
Gross Margin: 36 to 43%

Certified Residential Street-Legal Product

High value running on genuinely strong growth. Homologation, safety equipment and comfort content stack onto one chassis, the buyer is a household rather than a procurement committee, and Sun Belt dealer territories across the growth states are still being signed for the very first time.
Gross Margin: 29 to 36%

Hospitality And Campus Shuttle Fleets

The volume core that keeps assembly lines loaded and dealer relationships alive right across the cycle. Resort, university and campus operators all replace on schedule and specify on guest experience or duty cycle, which holds realised pricing considerably steadier than any consumer retail channel ever manages.
Gross Margin: 22 to 29%

Entry-Level Personal Vehicle Sales

The strategic watch-out sitting squarely inside this particular portfolio. Volumes here are genuinely large and the channel is easy to enter, but Chinese-supplied product substitutes very closely indeed at almost any given specification and the badge printed on the vehicle carries very little pricing power indeed.
Gross Margin: 14 to 19%

How Low-Speed Vehicle Demand Repeats

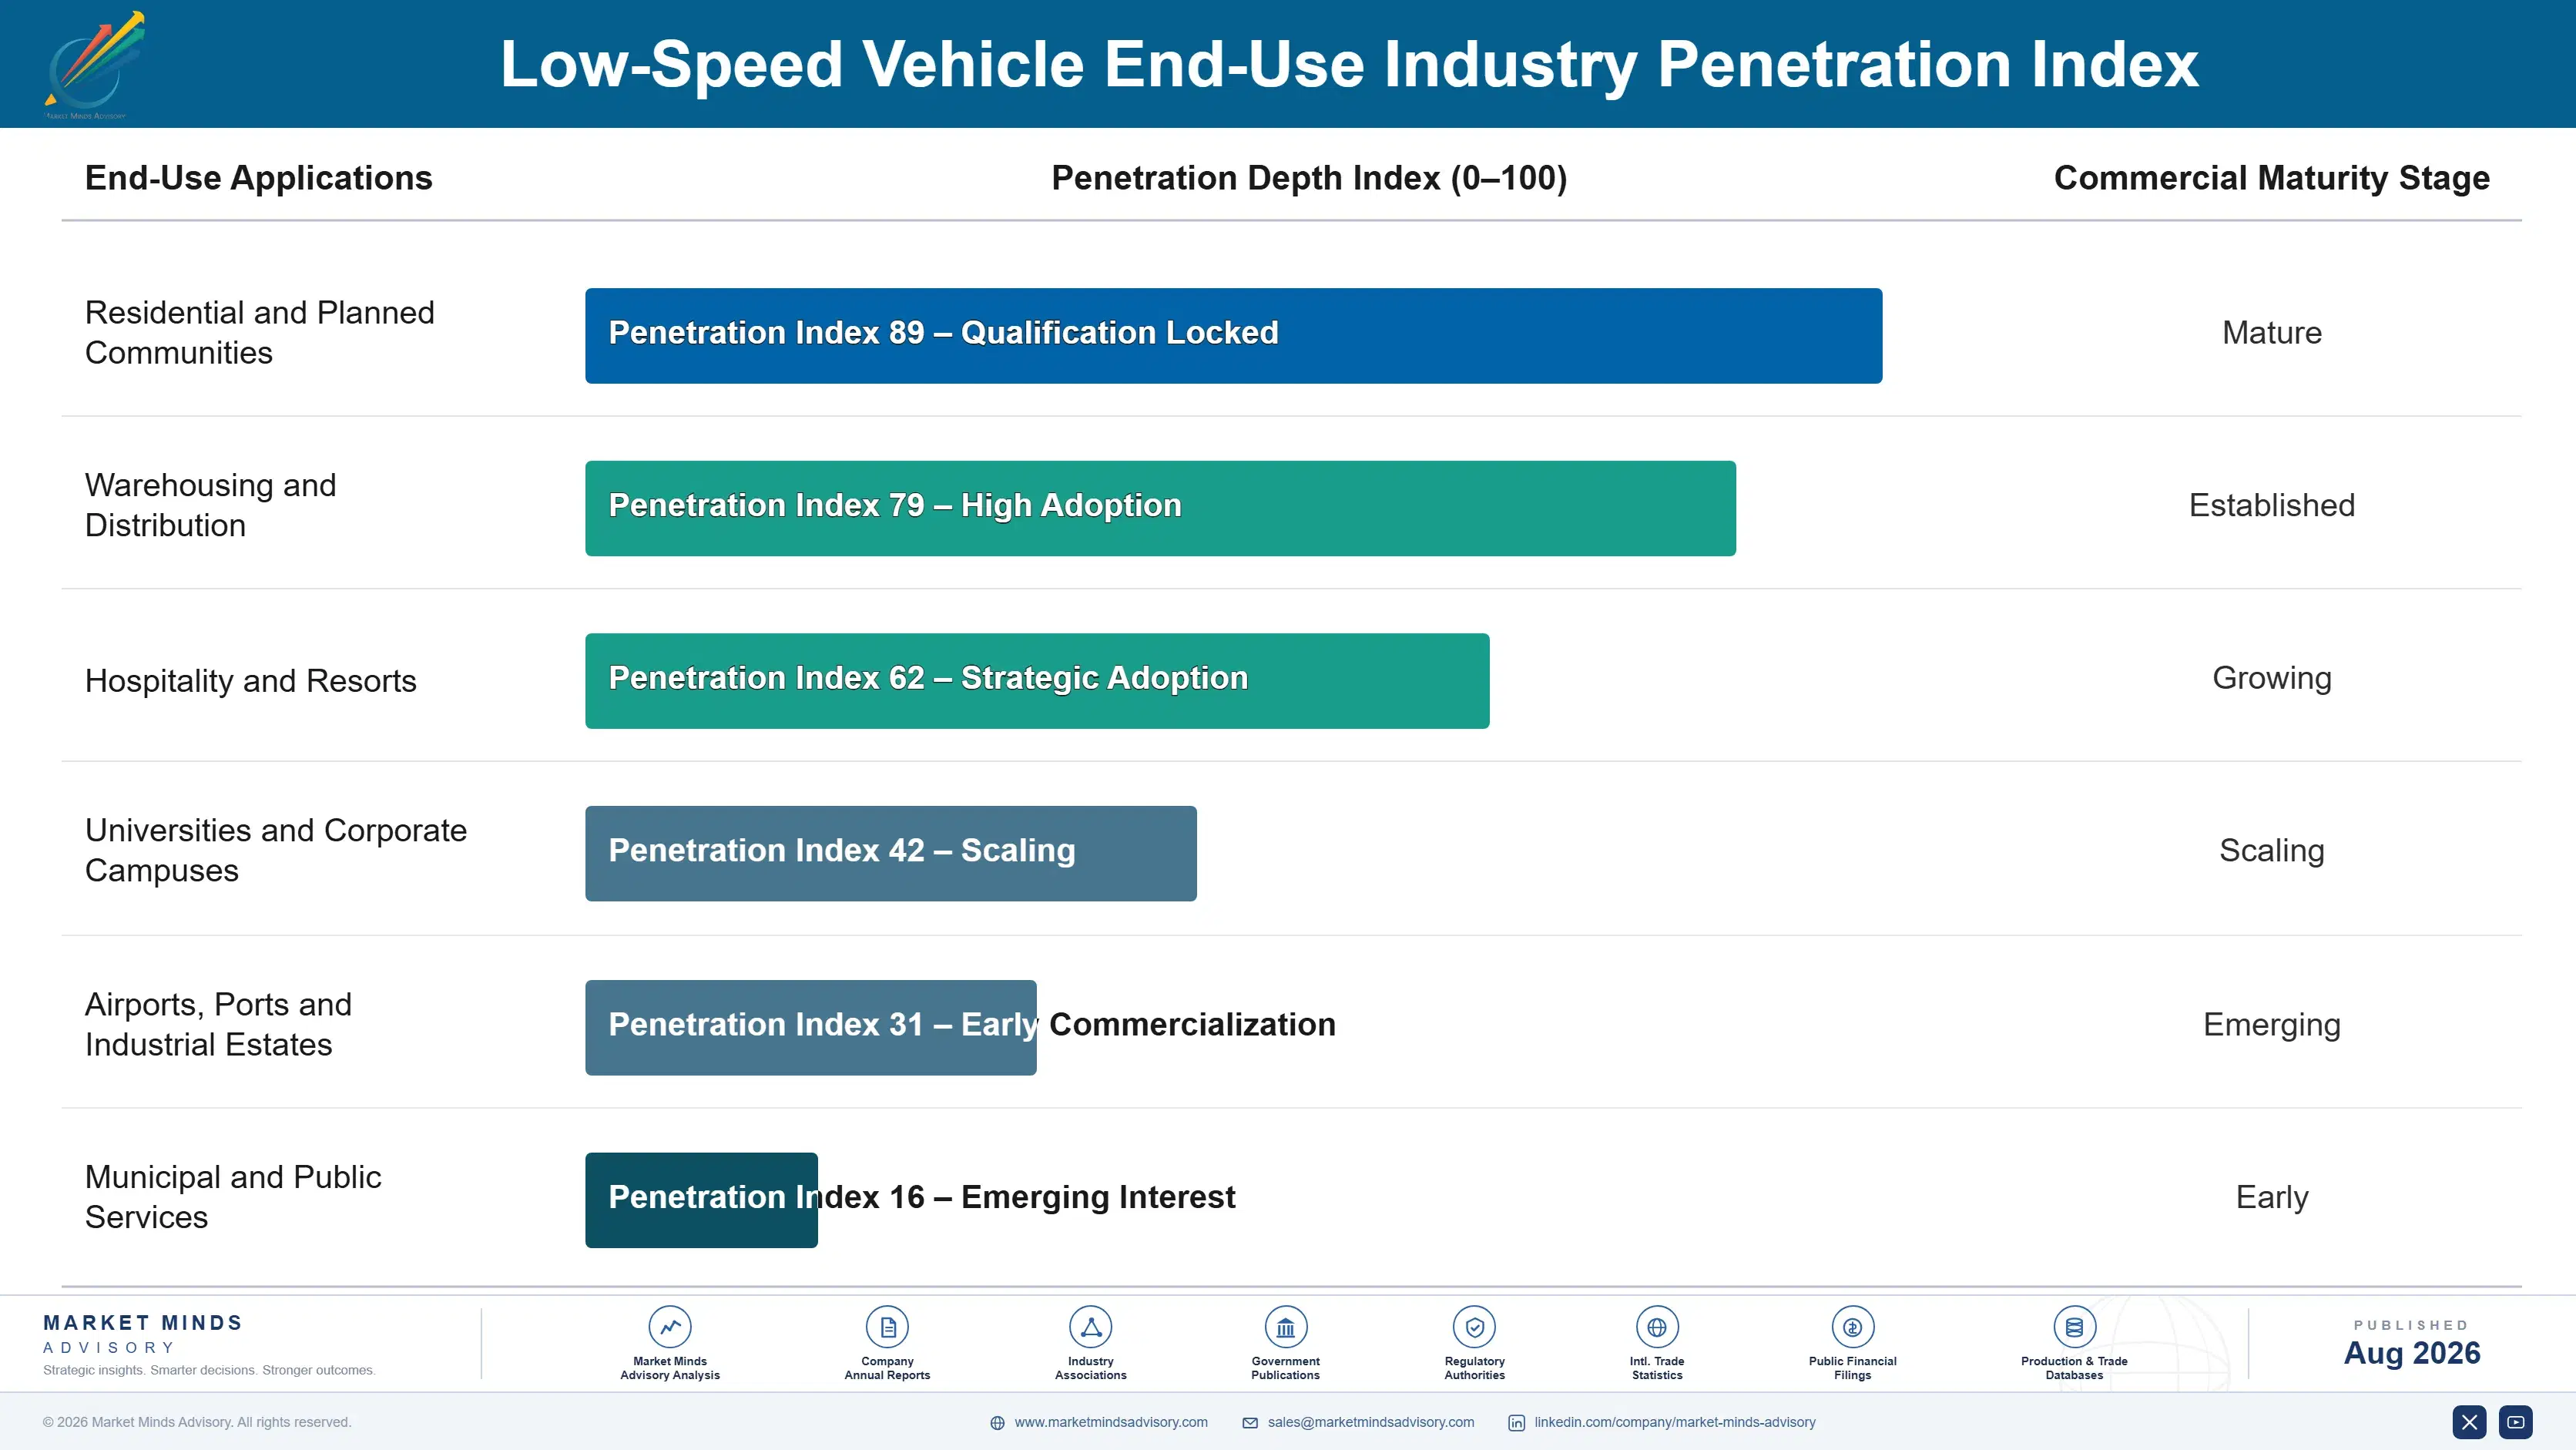
The two halves of this market repeat quite differently. A commercial fleet generates replacement demand on a roughly six year cycle plus continuous parts, battery and service revenue throughout that period, all of it contracted and predictable against site operating budgets. A personal purchase generates a battery replacement around year six and little else, unless the manufacturer holds the dealer relationship that eventually produces a repurchase decision.
Stickiness varies sharply by buyer. Industrial site operators are the stickiest, because switching manufacturer means retraining maintenance staff, restocking parts and revalidating the vehicles against site safety procedures. Hospitality and campus operators sit close behind, replacing on schedule and valuing continuity. Residential buyers are considerably less sticky, comparing specification openly across dealers. General retail buyers show no loyalty at all and never have.

The buyer profile has shifted noticeably. Early purchasers were enthusiasts and golf communities buying something adjacent to what they already knew. Today the growth buyer is a facilities manager running a fleet arithmetic exercise or a household replacing a second car, and both evaluate operating cost, service coverage and resale value alongside the vehicle itself rather than in isolation from it.
low-speed-vehicle-market-analysis-trends-end-use-penetration-index-1787317045579

Where To Compete And Why

These are among the four positions where our research anticipates prominent divergence between winners and laggards over the coming forecast period. Each is grounded in the demand model, the regulatory perimeter, and the announced capacity pipeline.
01 / FLEET ECONOMICS SELLING

Sell against the truck not the competitor

A distribution centre or airport replacing light trucks is running an arithmetic exercise rather than expressing any preference, and manufacturers demonstrating energy, maintenance and driver cost across a five year horizon win that comparison outright. Suppliers presenting documented fleet operating data realise 22% to 30% higher unit pricing than competitors quoting a purchase price alone. The work involved here is commercial analysis rather than engineering, which makes it faster to build than any product capability and considerably cheaper to fund.
02 / MULTI-MARKET HOMOLOGATION BREADTH

One platform certified in several worlds

American low-speed vehicle rules and European quadricycle classes define genuinely different vehicles, and recertifying between them takes around 14 months plus redesign work nobody budgets for. Manufacturers engineering one platform to satisfy several standards from the outset reach two or three times the addressable market on a single development programme, holding 18% to 25% better return on that spend. The discipline required is designing to the strictest requirement first, which is far cheaper than retrofitting compliance onto a finished platform afterwards.
03 / FLEET SERVICE COVERAGE

Uptime is what the fleet buyer purchases

A site operator running forty vehicles for internal logistics cannot have several of them off the road waiting on parts, and that single fact excludes most manufacturers from serious fleet tenders before any commercial discussion even begins. Suppliers holding authorised service coverage and stocked spare parts across their territories win fleet business at 20% to 27% higher realised prices. The investment required is inventory and partner management rather than any manufacturing capital, which makes it achievable inside a single planning cycle.
04 / RESIDENTIAL CHANNEL TIMING

Sign territories before the ordinances spread

Households in cart-legal communities shop powersports, marine and independent outlets rather than car dealerships, and manufacturers signing those territories early hold 15% to 22% higher realised price than competitors routing the same buyer through golf or industrial channels. Sun Belt dealer territory is genuinely finite and is being claimed right now as ordinances keep spreading. The build cost involved is dealer recruitment and floor plan financing rather than engineering, which makes this purely a timing question rather than a strategic one.

Engagement Snapshot From the Field

A live engagement with an industry participant carrying material or product regulatory and market exposure ahead of a defining policy shift, showing how our research translates into a defensible multi-year portfolio strategy.
MARKET MINDS ADVISORY · CLIENT ENGAGEMENT SUMMARY
Low-Speed Vehicle Producer Strategic Portfolio Review and Transition Roadmap 2026·Investment Scenario on Low-Speed Vehicle Exposure Evaluation 2025-26
CLIENT PROFILE
A North American manufacturer of electric utility and personal transport vehicles with annual revenue near $165 million (client-reported, unverified by MMA), roughly 72% of it from hospitality and campus shuttle fleets sold through a specialist dealer network. The business held solid engineering and long customer relationships but almost no industrial fleet presence, and it had never certified any platform outside the American low-speed vehicle standard.
STRATEGIC CHALLENGE
Hospitality fleet volumes had flattened while industrial site substitution was growing at double digits and being served by competitors the client had never encountered before. Management needed to decide between building an industrial fleet proposition, certifying an existing platform for European quadricycle markets, or entering the residential channel where household ownership was expanding fastest across the Sun Belt.
MMA APPROACH
MMA sized industrial site fleet demand by facility type across five states, mapped European quadricycle certification requirements against the client's existing platform architecture, and modelled dealer territory availability in cart-legal residential markets. Twenty-one expert interviews with facilities managers, dealer principals and fleet procurement officers tested where purchase decisions were genuinely being made and on what basis.
KEY FINDINGS
  1. Facilities managers ranked service response time and parts availability above purchase price in every interview conducted, which favoured a manufacturer willing to build coverage over one competing on delivered cost.
  2. European quadricycle certification would have required substantial redesign of the client's chassis and restraint systems, taking roughly 20 months against management's twelve month assumption.
  3. Industrial fleet pricing tested 26% above the client's hospitality shuttle realisations for broadly comparable vehicles, because the buyer was comparing against light trucks rather than against other shuttles.
  4. Residential dealer territories in the client's three strongest states were already substantially claimed, leaving only secondary markets available at meaningfully weaker outlet quality.
CLIENT PROFILE
A North American manufacturer of electric utility and personal transport vehicles with annual revenue near $165 million (client-reported, unverified by MMA), roughly 72% of it from hospitality and campus shuttle fleets sold through a specialist dealer network. The business held solid engineering and long customer relationships but almost no industrial fleet presence, and it had never certified any platform outside the American low-speed vehicle standard.
STRATEGIC CHALLENGE
Hospitality fleet volumes had flattened while industrial site substitution was growing at double digits and being served by competitors the client had never encountered before. Management needed to decide between building an industrial fleet proposition, certifying an existing platform for European quadricycle markets, or entering the residential channel where household ownership was expanding fastest across the Sun Belt.
MMA APPROACH
MMA sized industrial site fleet demand by facility type across five states, mapped European quadricycle certification requirements against the client's existing platform architecture, and modelled dealer territory availability in cart-legal residential markets. Twenty-one expert interviews with facilities managers, dealer principals and fleet procurement officers tested where purchase decisions were genuinely being made and on what basis.
KEY FINDINGS
  1. Facilities managers ranked service response time and parts availability above purchase price in every interview conducted, which favoured a manufacturer willing to build coverage over one competing on delivered cost.
  2. European quadricycle certification would have required substantial redesign of the client's chassis and restraint systems, taking roughly 20 months against management's twelve month assumption.
  3. Industrial fleet pricing tested 26% above the client's hospitality shuttle realisations for broadly comparable vehicles, because the buyer was comparing against light trucks rather than against other shuttles.
  4. Residential dealer territories in the client's three strongest states were already substantially claimed, leaving only secondary markets available at meaningfully weaker outlet quality.
RECOMMENDED STRATEGY
Phase 1: Phase one: build an industrial fleet proposition around documented operating cost data and service coverage, targeting distribution and manufacturing sites within existing dealer territories. Phase 2: Phase two: expand authorised service partner coverage ahead of fleet volume, since uptime commitments cannot be made credibly without it in place first. Phase 3: Phase three: defer European certification until the industrial business is established, rather than committing engineering capacity against a longer programme than assumed.
OUTCOME
The client launched its industrial fleet proposition within seven months and reported first-year industrial revenue of $23 million against a $15 million plan (client-reported, unverified by MMA). Service partner coverage now spans nine states, blended gross margin improved by roughly five points, and European certification remains deliberately deferred.

Frequently Asked Questions

Foundational context covering the market sizes, CAGR, scope, country, region and competition that inform every finding below. This section is provided to cover basics and most often pre-purchase conversations, answered from the MMA Primary Research Dataset.

What is the current size of the Low-Speed Vehicle Market?

The global low-speed vehicle market was valued at $3.40 billion in 2025, reaching an estimated $3.73 billion in 2026. That covers four-wheel vehicles homologated to low-speed, neighbourhood electric or quadricycle standards.

How large will the Low-Speed Vehicle Market be by 2036?

MMA forecasts the market reaching $9.33 billion by 2036, an increase of $5.60 billion over the 2026 base. That represents an expansion multiple of 2.50 times across the forecast period.

What is the CAGR for the Low-Speed Vehicle Market 2026 to 2036?

The base case compound annual growth rate is 9.6%, with a bull case of 10.8% and a bear case of 8.4%. Historical growth between 2020 and 2025 ran at 8.2% annually.

Which segment is growing fastest?

Commercial and industrial utility vehicles grow at 14.4%, a full 1.50 times the market rate, as sites replace light trucks on operating cost. Micro cargo and last-mile delivery vehicles follow at 12.0%.

Who are the major companies in the Low-Speed Vehicle Market?

Textron Specialized Vehicles, Club Car, Polaris, Waev and Guangdong Marshell Green Power lead on unit shipment volume. Together they account for roughly 34% of global shipments across all applications.

Which country is growing fastest?

India grows fastest at 12.6% annually, driven by low-speed passenger and cargo vehicles serving short urban journeys at operating costs no alternative matches. Vietnam and Indonesia follow on resort and industrial demand.

Report Segmentation Architecture

The full report scope spans multiple orthogonal segmentation dimensions, with cross-tabulated demand data provided for each dimension pair. Coverage extends further to regional breakdowns, trend trajectories, and the competitive detail needed to support segment-level decision-making.

By Vehicle Application Class

  • Commercial and Industrial Utility Vehicle
  • Micro Cargo and Last-Mile Delivery Vehicle
  • Personal Neighbourhood Passenger Vehicle
  • Resort and Campus Shuttle Vehicle
  • Municipal and Security Patrol Vehicle

By End-Use Industry

  • Residential and Planned Communities
  • Warehousing and Distribution
  • Hospitality and Resorts
  • Universities and Corporate Campuses
  • Airports, Ports and Industrial Estates
  • Municipal and Public Services

By Commercial Dimension

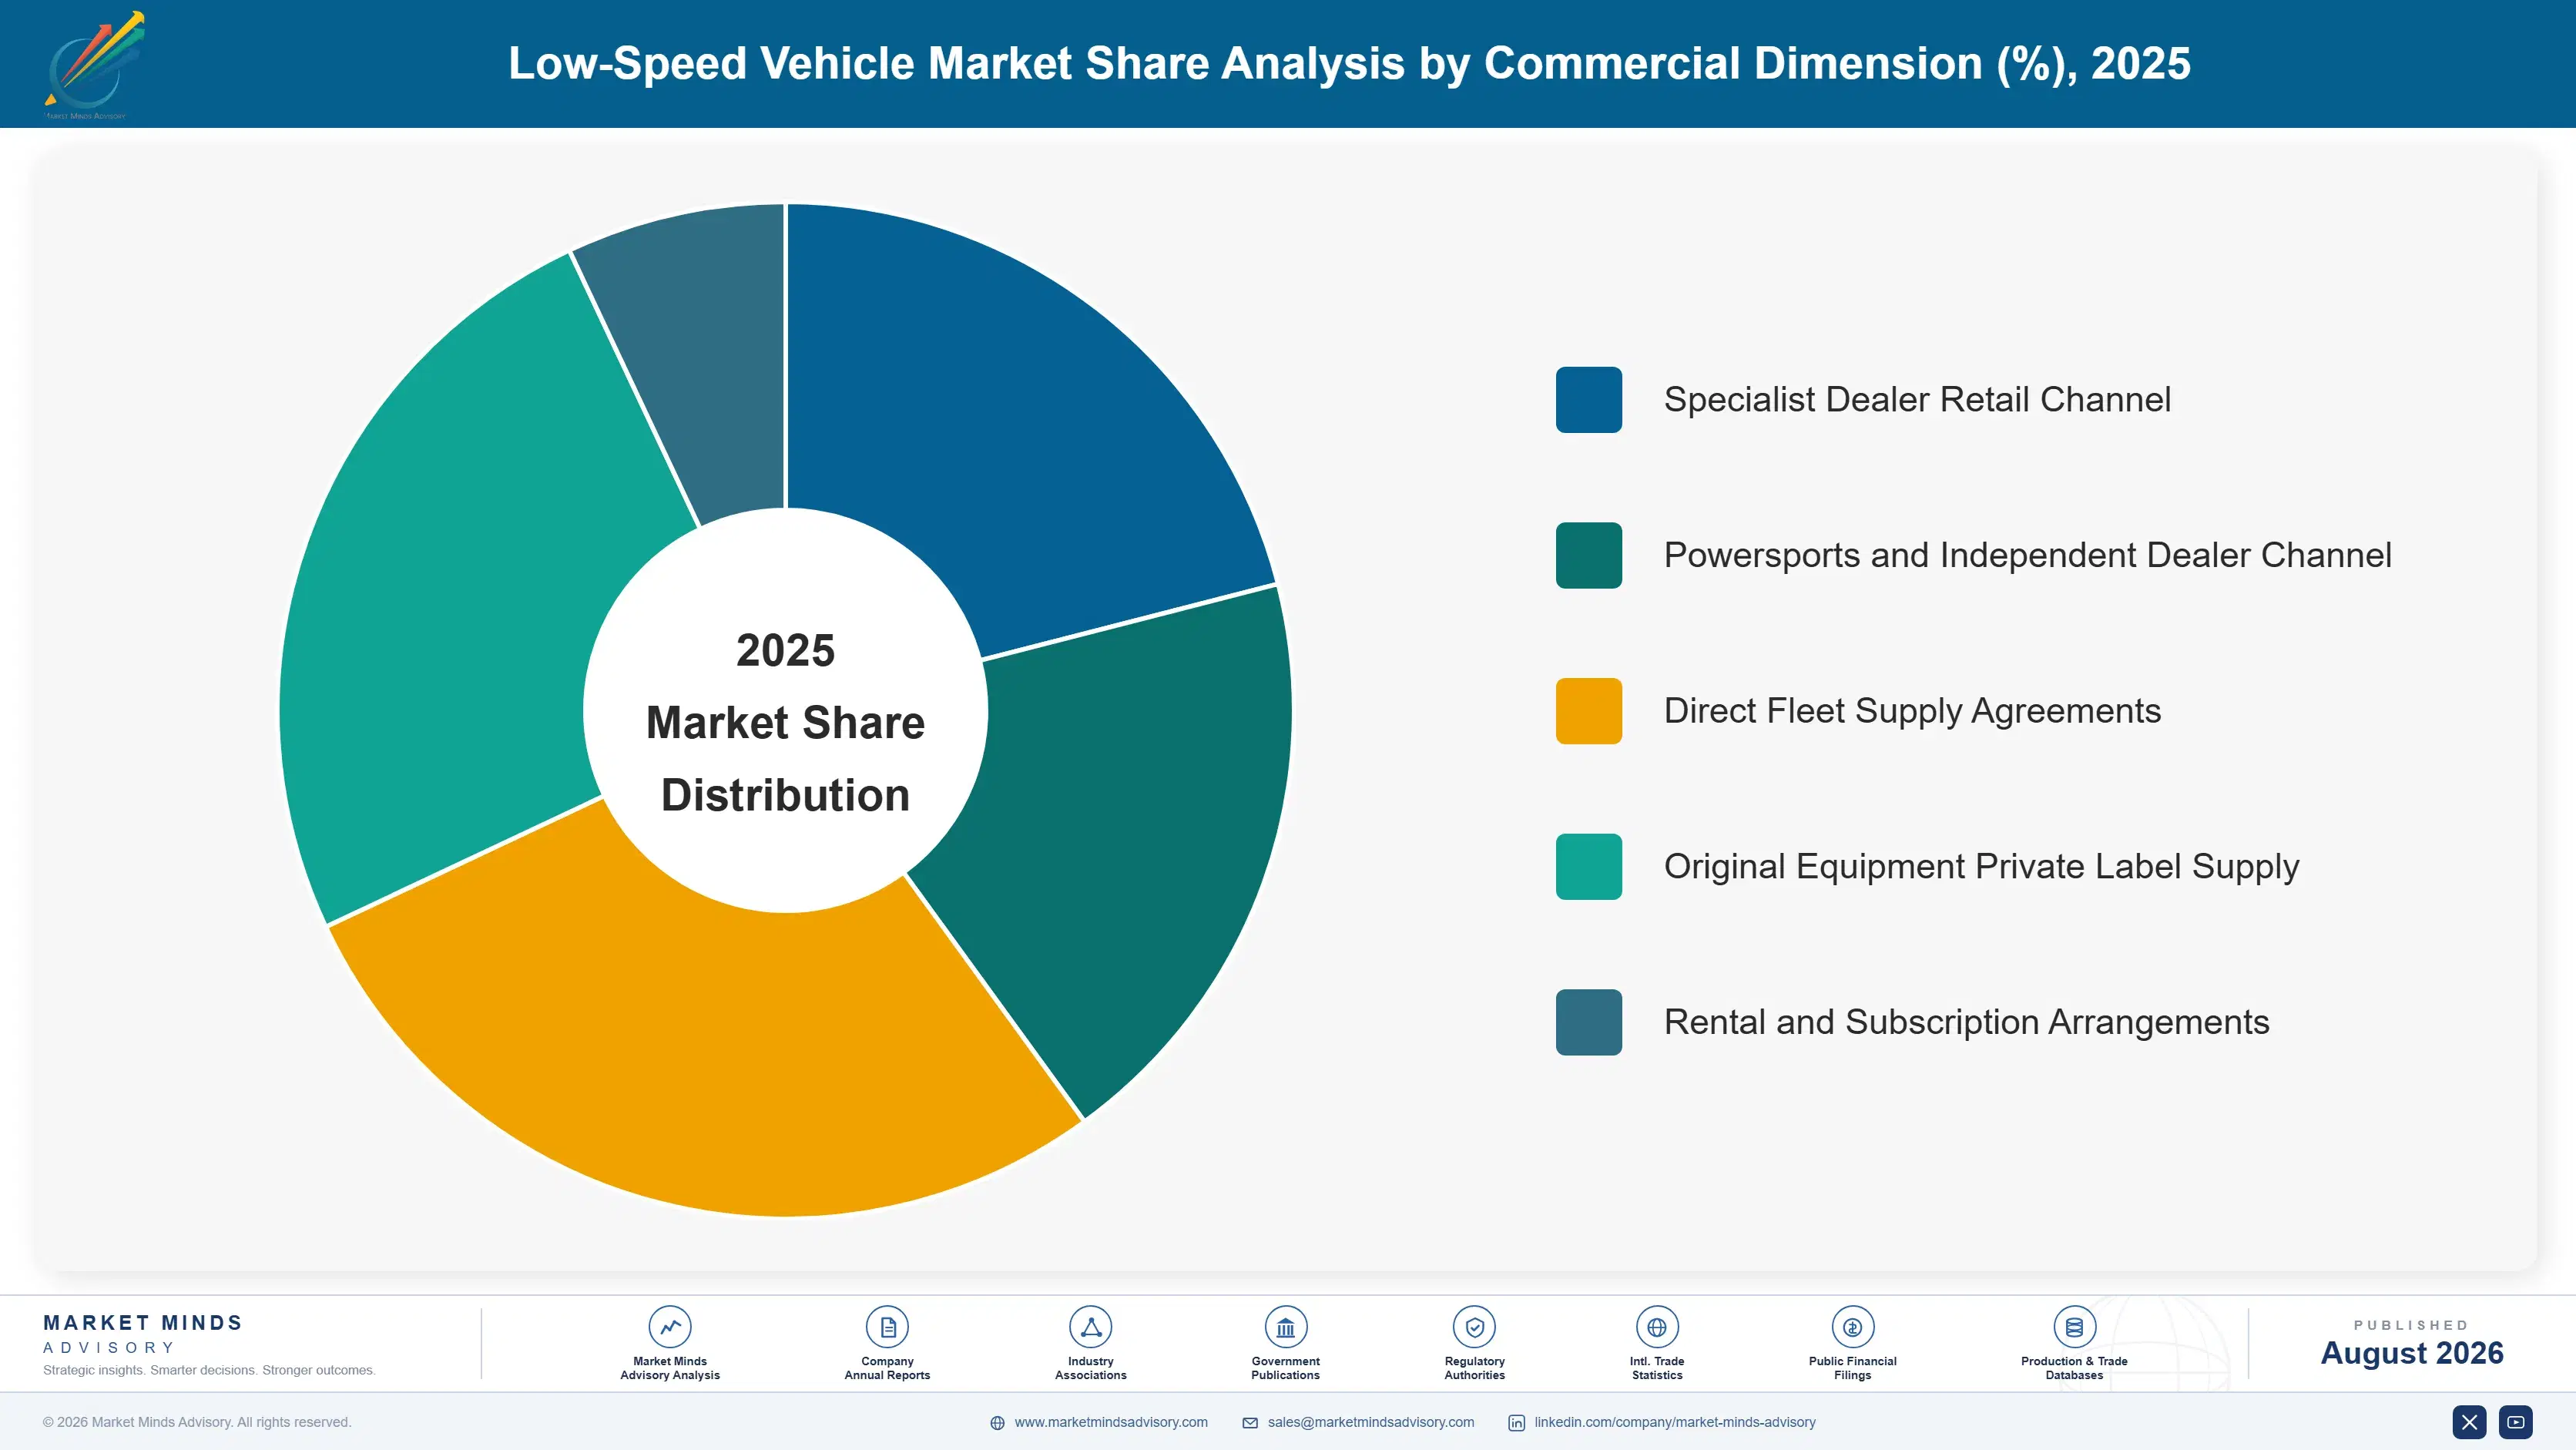
  • Specialist Dealer Retail Channel
  • Powersports and Independent Dealer Channel
  • Direct Fleet Supply Agreements
  • Original Equipment Private Label Supply
  • Rental and Subscription Arrangements

By Region

  • North America
  • Western Europe
  • East Asia
  • South Asia and Pacific
  • Latin America
  • Middle East and Africa
  • Eastern Europe

Scope, Methodology, and Coverage

Every figure in this report is reproducible from documented input assumptions. The scope below maps the historical period, the forecast horizon, the segmentation dimensions, and the countries covered, alongside the underlying primary and qualitative methodology.
Historical Period
2020 to 2025
Forecast Period
2026 to 2036
Base Year
2025 (USD billions; MMA Primary Research Dataset, August 2026)
Market Definition
This report covers four-wheel vehicles homologated to low-speed vehicle, neighbourhood electric vehicle or European quadricycle standards, plus comparable vehicles supplied for private property fleet use, across personal, commercial, industrial, hospitality, campus and municipal applications. Golf carts sold for course use without road homologation, electric two and three-wheelers, motorcycles and mopeds, full-speed passenger cars, forklifts and warehouse handling equipment, and utility task vehicles lacking road certification are excluded from the sizing.
Quantitative Units
USD billions at manufacturer realised value; unit shipments in thousands; average realised price in USD per vehicle.
Segmentation Dimensions
By vehicle application class; by end-use industry; by commercial dimension; by region.
Regions Covered
North America, Western Europe, East Asia, South Asia and Pacific, Latin America, Middle East and Africa, Eastern Europe
Countries Covered
United States, Canada, Mexico, France, Italy, Spain, Germany, Netherlands, Switzerland, China, Japan, South Korea, India, Thailand, Indonesia, Australia, Brazil, United Arab Emirates, South Africa, Poland.
Key Companies Profiled
Textron Specialized Vehicles, Club Car, Polaris, Waev, Guangdong Marshell Green Power, ICON Electric Vehicles, Evolution Electric Vehicles, Bintelli, STAR EV, Ligier Group, Aixam, Micro Mobility Systems, Stellantis, Renault Group and others.
Quantitative Methodology
Primary survey, n=3,800 respondents, Q4 2025, six countries; demand-side model with trade association cross-validation
Qualitative Methodology
47 expert interviews, Q4 2025; applied to validate demand model assumptions, identify emerging dynamics, and assess competitive positioning
Report Format
PDF and XLSX data workbook (Word format preview document)
Publisher
Market Minds Advisory
Report Code
MMA-2026-AUT-977
Published
August 2026
Contact
sales@marketmindsadvisory.com | www.marketmindsadvisory.com

Purchase the full Low-Speed Vehicle Market Report (2026 to 2036).

The full report sizes the low-speed vehicle market across five application classes, six end-use industries and seven regions, with unit shipment and realised pricing detail behind every value estimate. It profiles twenty global manufacturers on homologation breadth, fleet service network coverage and distribution channel reach. Regional chapters cover low-speed vehicle and quadricycle regulation, road access ordinance status and local assembly economics by market. Fleet analysis quantifies operating cost against light truck alternatives by application. Cost analysis tracks cell pricing, tariff exposure and homologation spending across manufacturing regions.
Unit shipment and pricing detail by application class
Road access ordinance status by American state
Industrial fleet substitution forecasts through 2036
Homologation requirement comparison across regulatory classes
Competitive position assessments across twenty global manufacturers
Fleet operating cost benchmarking against light trucks

Built For The People Who Decide

From boardroom strategy to bench-side execution, this report is read cover-to-cover by leaders shaping the next decade of their industry, turning demand scenarios, market dynamics and valuation benchmarks into decisions.
CXOs/ Presidents/ VPs/ Managers
M&A and Corporate Development
Strategy Teams and R&D Heads
Procurement and Product Directors
Regulatory and Compliance Leaders
Investor Relations and Equity Analysts