Market Minds Advisory
Long-Term Post-Acute Care Software Market

Long-Term Post-Acute Care Software Market: The Sector Federal Incentives Skipped, and What Payment Reform Did Instead

Nursing homes and home health agencies received nothing from the federal electronic records incentive programme that paid hospitals billions, so payment reform rather than subsidy eventually forced the software purchase.

Lead Analyst

Alice Ballenger

Published

August 2026

Make Smarter Decisions with Customized Research Insights

Request a free sample report and evaluate market opportunities, growth trends, and competitive dynamics relevant to your business needs.

2025 MARKET VALUE$4.2BMarket Size 2025
2036 FORECAST VALUE$12.5BBase Case , 2026 to 2036
CAGR 2026 TO 203610.4 %Bull 11.6% / Bear 9.2%
INCREMENTAL OPPORTUNITY$7.8BNet 10- year value creation
EXPANSION MULTIPLE2.69x2036 value over 2026 base
Strategic Levers
M&A Pipeline
Regional Outlook
Country Rankings
Competitive Intelligence
Segmental Deep-dive
Call-Us : 91 93563 13602

Executive Snapshot and Market Trajectory

Post-acute providers were excluded from the federal electronic health record incentive payments that funded hospital and physician adoption after 2009. Payment reform did the job instead, and it did it by making documentation quality decide revenue directly rather than by writing any provider a cheque.
Analytics, quality reporting and value-based care software compounds at 15.6%, a full 1.50x the market rate, because Medicare Advantage plans and hospital networks now pick post-acute partners on measured readmission and length-of-stay performance. North America holds 58% of global value, an unusually concentrated position explained below by the fact that the assessment instruments and payment models driving purchase are United States federal constructions. That share is explained in the regional section below.
Concentration is moderate at 64%, with PointClickCare holding the deepest skilled nursing footprint and MatrixCare covering the widest span of care settings. Switching costs are severe: an operator replacing a clinical platform faces roughly seven months of implementation and retraining, and renewal rates near 94% show how rarely that happens. Competitive movement therefore comes through acquisition and adjacent module attachment far more than through displacement. Little else moves.
Market Definition
This market covers software purchased by long-term and post-acute care providers, spanning clinical electronic health record and assessment platforms, revenue cycle and reimbursement software, care coordination and referral management, workforce scheduling and staffing compliance, analytics and value-based care reporting, and medication management. Buyers include skilled nursing facilities, home health and hospice agencies, assisted and senior living operators, and long-term acute care hospitals. Acute hospital electronic health records, physician practice systems, payer platforms, remote monitoring hardware, and staffing agency services are excluded.
Base Year Value
$4.2B in 2025 (MMA Primary Research Dataset, August 2026)
Forecast Period
2026 to 2036, eleven discrete annual values
CAGR
10.4% base case. Bull 11.6%. Bear 9.2%.
Fastest Growth Segment
Analytics, Quality Reporting and Value-Based Care Software: 15.6% CAGR
Fastest Growth Country
China: 13.2% CAGR
Fastest Growth Region
South Asia and Pacific: 12.6% CAGR
Largest Region
North America: 58% of 2025 global value
Market Leaders
PointClickCare, MatrixCare, WellSky, Netsmart Technologies, and Homecare Homebase. Source: MMA Primary Research Dataset, July 2026.
Primary Survey
n=3,800 procurement and R&D decision-makers, Q4 2025, six countries
Methodology
Demand-side build-up, cross-validated against public data, 47 expert interviews

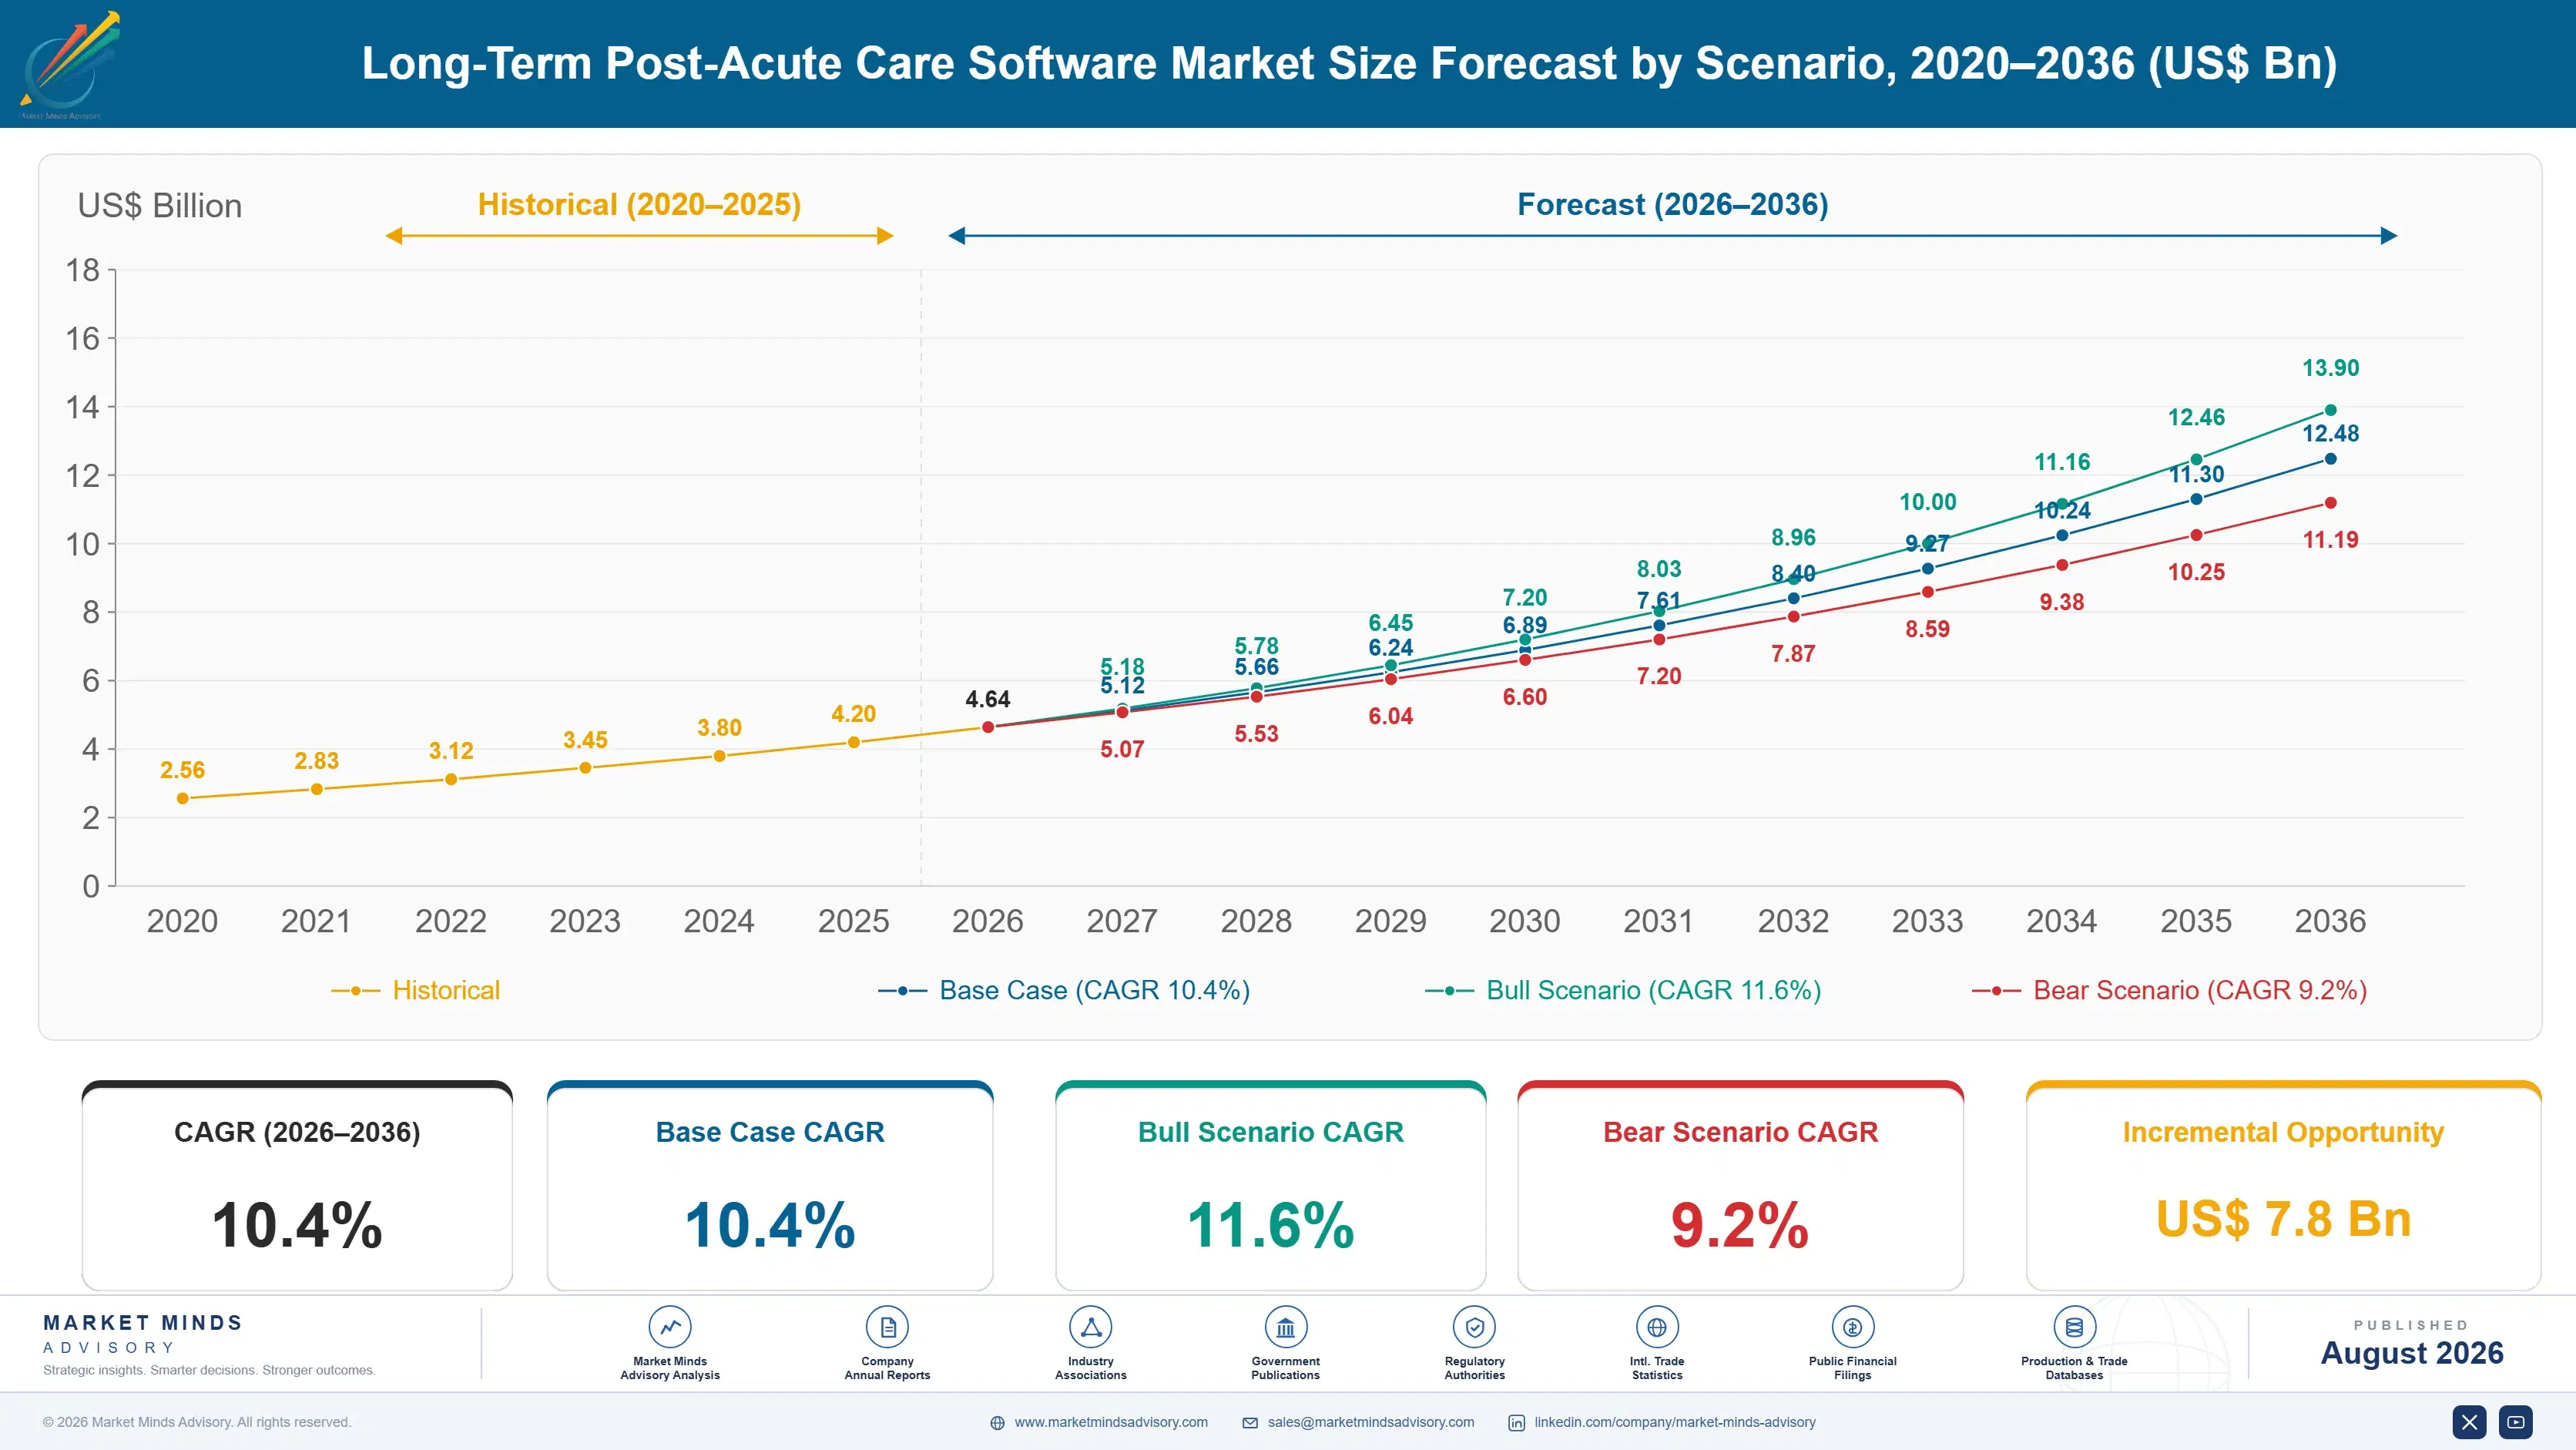
Long-Term Post-Acute Care Software Market Forecast Scenarios

long-term-post-acute-care-software-market-size-forecast-scenario-1787305723332
Growth ran near 9.0% from 2020 to 2025, and two payment models drove most of it. The Patient-Driven Payment Model for skilled nursing and the Patient-Driven Groupings Model for home health both moved reimbursement away from therapy volume toward documented patient characteristics. Operators discovered within two quarters that coding accuracy decided revenue, and software budgets moved accordingly.
Base case growth of 10.4% rests on three mechanisms. Medicare Advantage now covers more than half of Medicare beneficiaries, and those plans steer referrals to post-acute providers who can evidence outcomes. Federal interoperability rules pull post-acute providers into data exchange obligations they previously sat outside. And chronic staffing shortage keeps workforce scheduling and compliance software attached to platforms that were sold as clinical records. All three are already visible in operator purchasing behaviour rather than being forecast assumptions.
The bull case at 11.6% assumes value-based arrangements extend into post-acute care faster than expected, making analytics a condition of network participation rather than an advantage within it. The bear case at 9.2% reflects Medicaid rate pressure on nursing home operators whose margins are thin enough that discretionary module purchases stop, and platform replacement cycles stretch beyond nine years.

Post-Acute Software: Assessments, Referrals and Retention

The federal electronic health record incentive programme that began in 2009 paid hospitals and eligible physicians to adopt certified systems. Nursing homes, home health agencies and hospice providers were not eligible, and received nothing. Adoption in post-acute care consequently lagged the acute sector by more than a decade, and the vendors who eventually filled the gap did so selling subscriptions to operators paying from their own thin margins rather than from a federal incentive pool.
TOP FIVE CONCENTRATION64%Concentrated among platform vendors serving nursing and home health
FACILITY PENETRATION RATE68%Share of skilled nursing beds running a dedicated clinical platform
PRICE PER BED MONTHLY$41Typical subscription a facility pays for its clinical software
CONTRACT RENEWAL RATE94%Share of operator contracts renewed at the end of term
PLATFORM SWITCHING INTERVAL9 yearsAverage time an operator keeps one clinical software platform
SOFTWARE SHARE OF OPEX1.9%Portion of facility operating expenditure absorbed by clinical software
What changed the purchase decision was reimbursement design. Both major post-acute payment models tie payment to documented patient characteristics captured in federally mandated assessment instruments, so a coding error is a revenue error. That converted the clinical record from an administrative burden into the instrument that determines what a facility gets paid, which is a considerably stronger purchase argument than compliance ever was.
Retention follows from that. Replacing a clinical platform means retraining nursing staff who document at the bedside, remapping assessment workflows and risking a reimbursement gap during transition. Operators keep platforms for around nine years and renew at roughly 94%. Competition therefore concentrates on winning new operators and on attaching modules to existing accounts rather than on displacing incumbents, which almost never works.
"The most valuable thing a post-acute platform owns is not its clinical record, it is the referral relationship with hospitals and health plans. A nursing home that cannot show a health plan its readmission numbers stops receiving patients, and no amount of documentation quality fixes that."
Principal Analyst, Healthcare Provider Technology and Post-Acute Practice · MMA

Market Trends

Medicare Advantage plans decide which post-acute providers receive referrals

More than half of Medicare beneficiaries are now enrolled in Medicare Advantage, and those plans run narrow post-acute networks selected on measured performance. A skilled nursing facility that cannot report readmission rates, length of stay and functional improvement to a plan simply drops out of the referral flow. That has moved analytics and quality reporting from a management convenience to a condition of receiving patients at all, and it explains why that segment compounds at 15.6% against a market rate of 10.4%. Operators buy the reporting module because the referral depends on it.
Market Impact: Reimbursement variance near 6% from
Platform vendors buy their way into the interoperability layer

The clinical record alone no longer differentiates. Vendors have instead acquired care coordination networks and health data exchange infrastructure, positioning themselves between hospitals discharging patients and the post-acute providers receiving them. PointClickCare's purchases of Collective Medical and Audacious Inquiry both followed that logic directly. The value sits in knowing where a patient is going and telling the receiving facility before arrival, which no standalone documentation product can replicate. Vendors without that connectivity find themselves selling a record while competitors sell a position in the discharge pathway. The record itself has become the entry ticket rather than the product.
Market Impact: Staffing modules growing 12.4% annu

Market Opportunities and Growth Drivers

Payment models tie reimbursement to documented patient characteristics

The Patient-Driven Payment Model for skilled nursing and the Patient-Driven Groupings Model for home health both replaced therapy-volume reimbursement with payment based on patient characteristics captured in federally mandated assessment instruments. A missed diagnosis or a mis-coded functional score reduces payment for the entire stay. Operators who tested the models found revenue variances of several per cent traceable purely to documentation quality, which made assessment support software a revenue instrument rather than an overhead line. That reframing is the single largest reason post-acute software spending grew through the period. Nothing else in the period moved budgets comparably.
Market Impact: Software capped near 1.9% of opex

Staffing shortage forces scheduling and compliance software attachment

Nursing home operators run persistent vacancy rates that make shift coverage a daily crisis rather than a planning exercise. Federal proposals setting minimum nurse hours per resident day, together with state-level staffing requirements already in force, mean coverage gaps carry regulatory consequences and not just clinical ones. Workforce scheduling and staffing compliance software attaches readily to platforms already holding resident census and acuity data, and it sells to an administrator who has a problem this week. That segment compounds at 12.4%, well above the market. It is also one of the few purchases an administrator can justify alone.
Market Impact: Implementation running about 7 mont

Market Restraints and Challenges

Operator margins limit what any facility can spend

Skilled nursing operators dependent on Medicaid reimbursement run margins thin enough that a subscription increase becomes a board discussion. The root cause is that Medicaid rates are set by states under budget pressure and frequently sit below the cost of care, so the buyer's ability to pay is capped by a payer decision the vendor cannot influence. Commercial impact shows in module attachment rates well below what clinical need would suggest. Vendors respond with outcome-linked pricing, bundled multi-year terms and pricing tied to reimbursement capture rather than to bed count.
Market Impact: Analytics compounding at 15.6% year

Implementation length deters operators from switching at all

A clinical platform replacement takes around seven months from signature to full go-live, and it requires retraining bedside nursing staff whose documentation drives reimbursement. The root cause is that assessment workflows are embedded in daily clinical practice rather than sitting in a back office, so migration touches everyone. Commercial impact runs both ways: incumbents enjoy renewal near 94%, and challengers find new-logo acquisition brutally slow. Vendors mitigate with phased module-first entry, parallel-run migration support and implementation cost absorbed into multi-year contract terms. None of that shortens the seven months, and no vendor has made bedside retraining faster.
Market Impact: Two network acquisitions since 2020
4 additional market trends, 3 additional growth drivers, and 2 additional restraints and challenges are covered in the full report. Contact sales@marketmindsadvisory.com to access the complete intelligence.

Segment CAGR and Growth Architecture

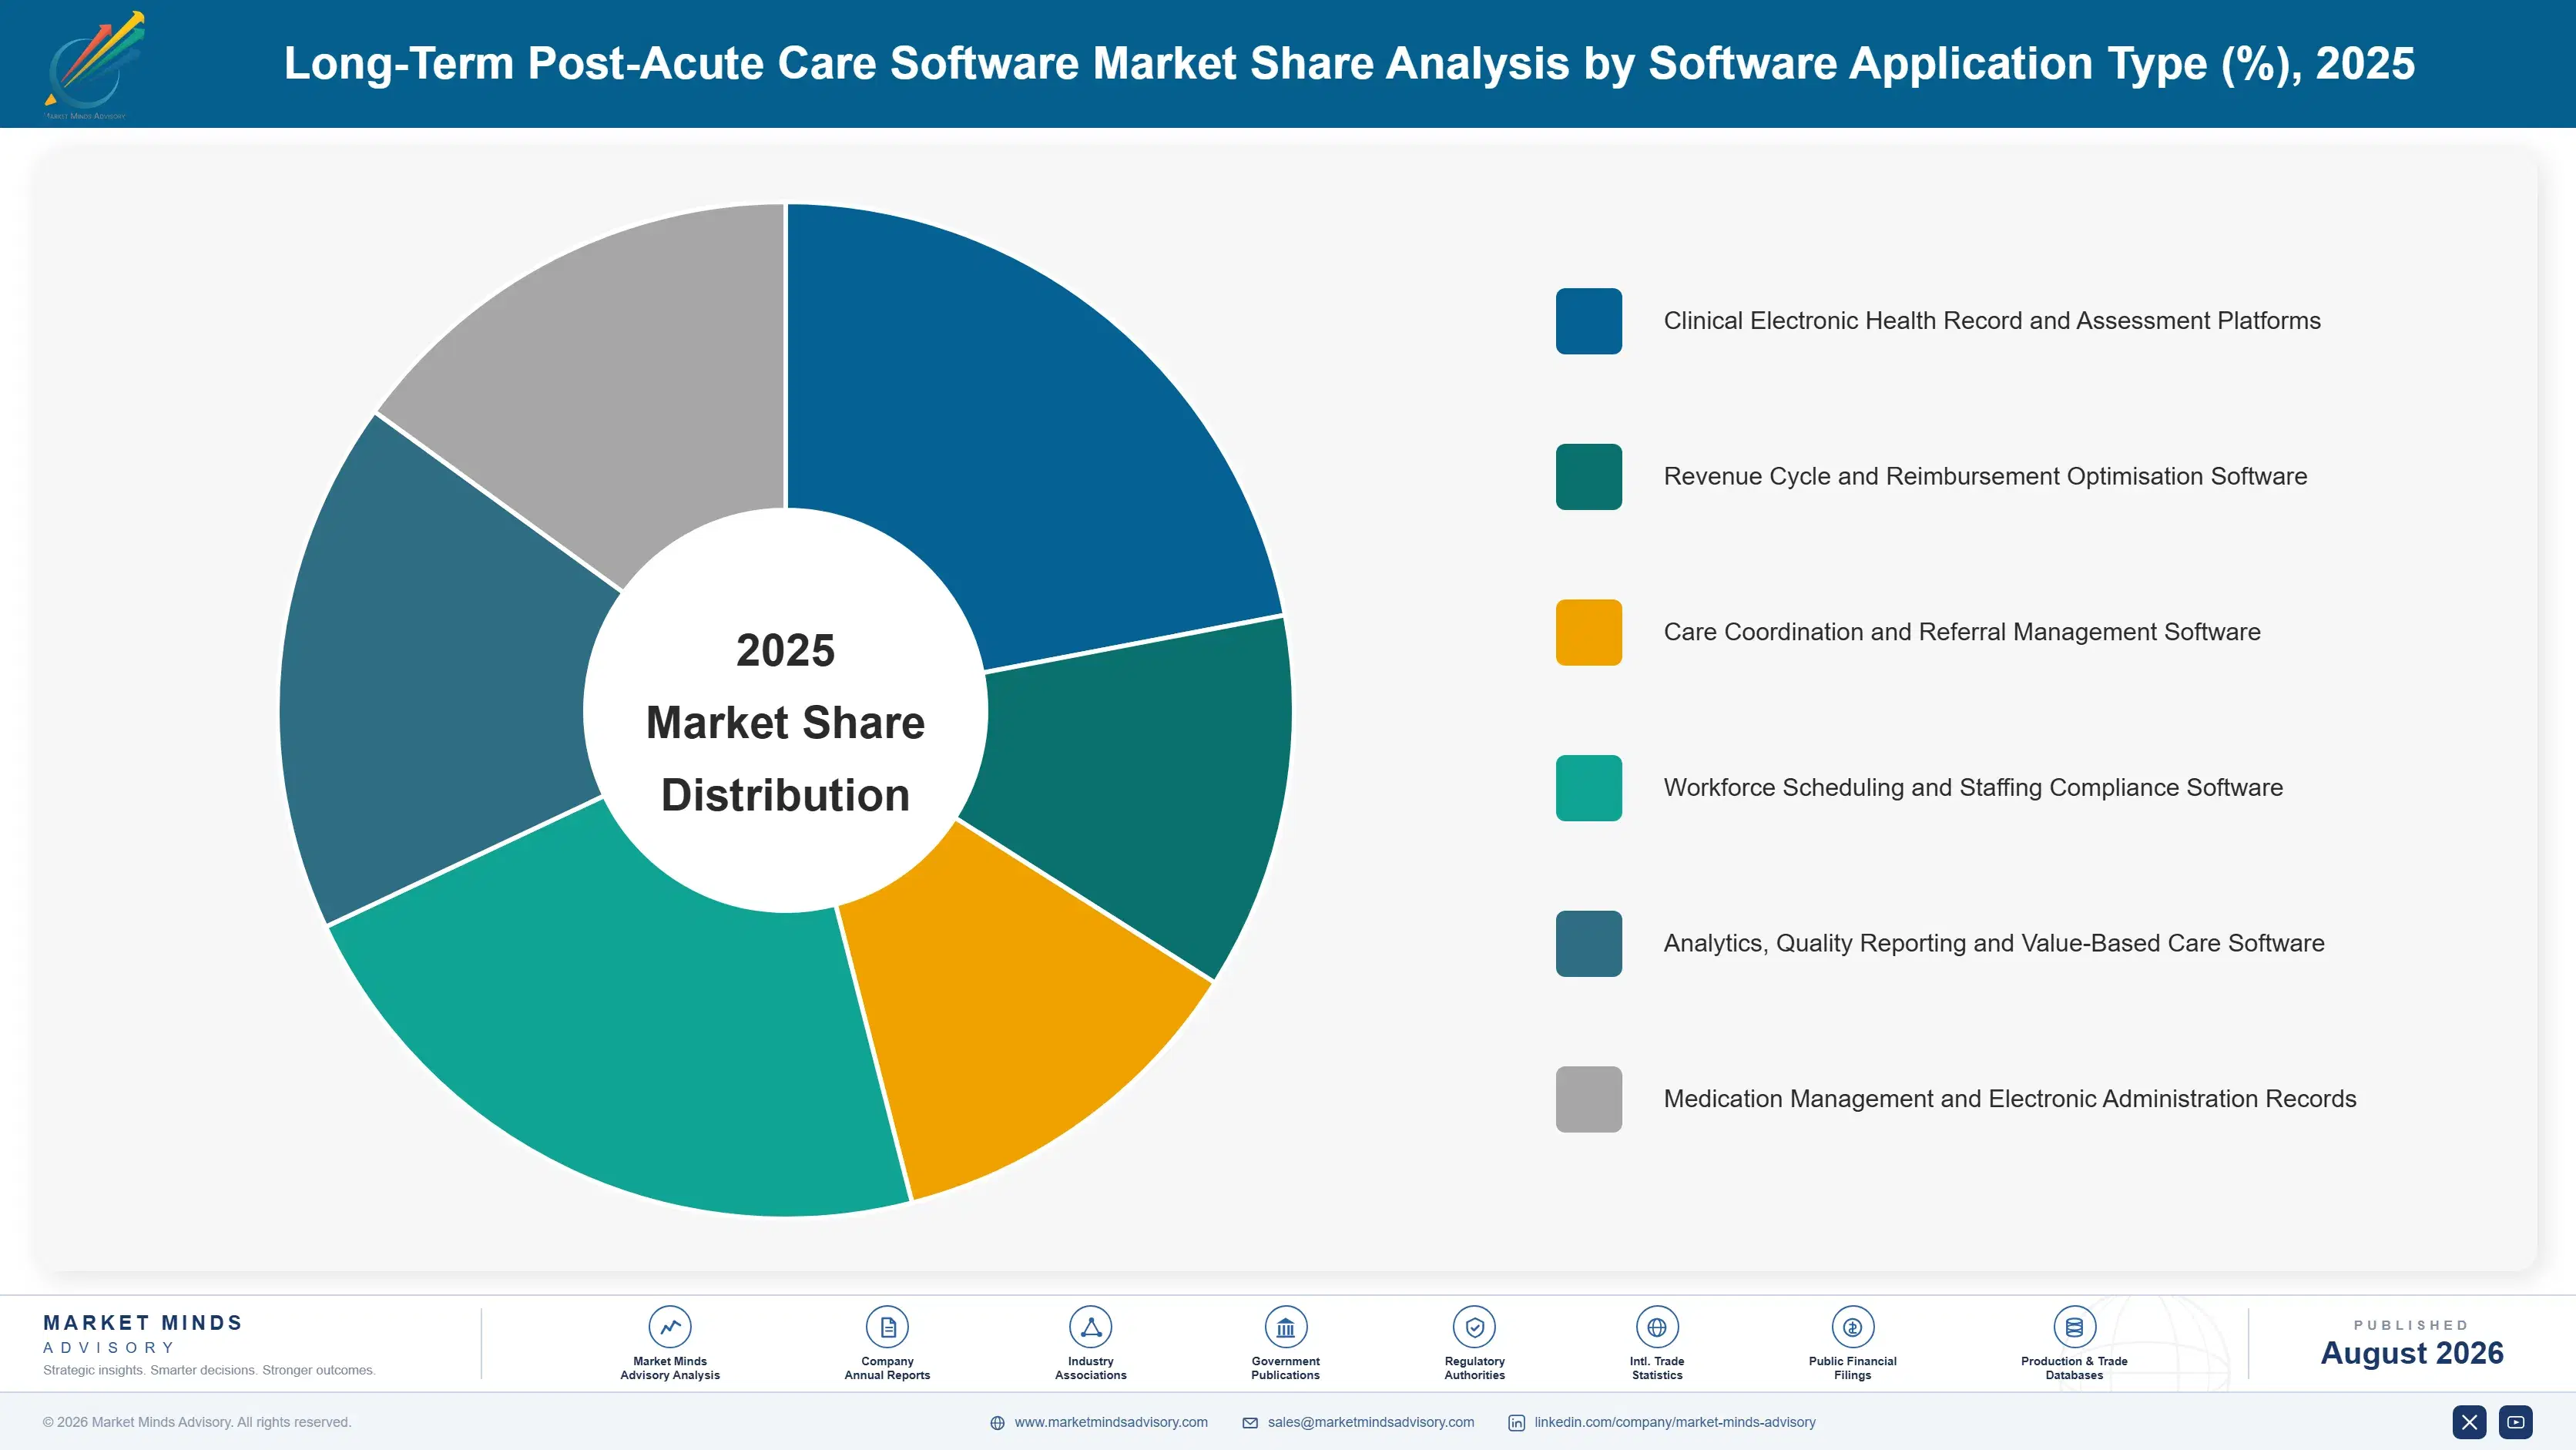
Six software categories divide this market by application type, which is the dimension operators actually purchase along. Each is bought by a different administrator against a different problem, and the clinical platform is increasingly the account through which the other five reach a facility that has already committed to one vendor. Attachment therefore matters more than displacement.
long-term-post-acute-care-software-market-market-share-analysis-1787305723868

Analytics, Quality Reporting and Value-Based Care Software

Compounding at 15.6%, a full 1.50x the market rate, this is the segment referral economics created. Medicare Advantage plans and hospital networks select post-acute partners on readmission rates, length of stay and functional outcomes, and a provider unable to produce those numbers loses referral volume regardless of clinical quality. Skilled nursing value-based purchasing further puts a portion of Medicare payment at risk on readmission performance. The software therefore sells against lost admissions rather than against efficiency, which is a considerably more urgent argument. Vendors holding the clinical record own the underlying data and attach this module with little competitive contest. Independent analytics vendors, lacking that record, must integrate before they can sell anything at all.
CAGR 15.6%

Care Coordination and Referral Management Software

Growing at 14.8%, this segment sits between the discharging hospital and the receiving post-acute provider. Hospitals under readmission penalties want visibility into where patients go and how they fare; post-acute providers want early notice of an incoming referral so they can assess suitability before accepting. Software carrying that traffic occupies a position neither party can easily replace, which is why platform vendors have acquired into it rather than building. Federal interoperability rules extending data exchange obligations toward post-acute settings reinforce the requirement. The commercial value lies in the network rather than the application itself. Two acquisitions since 2020 went into this layer, and neither buyer lacked clinical functionality. What both lacked was position.
CAGR 14.8%
Full segment breakdown across 6 segments available in the complete report.

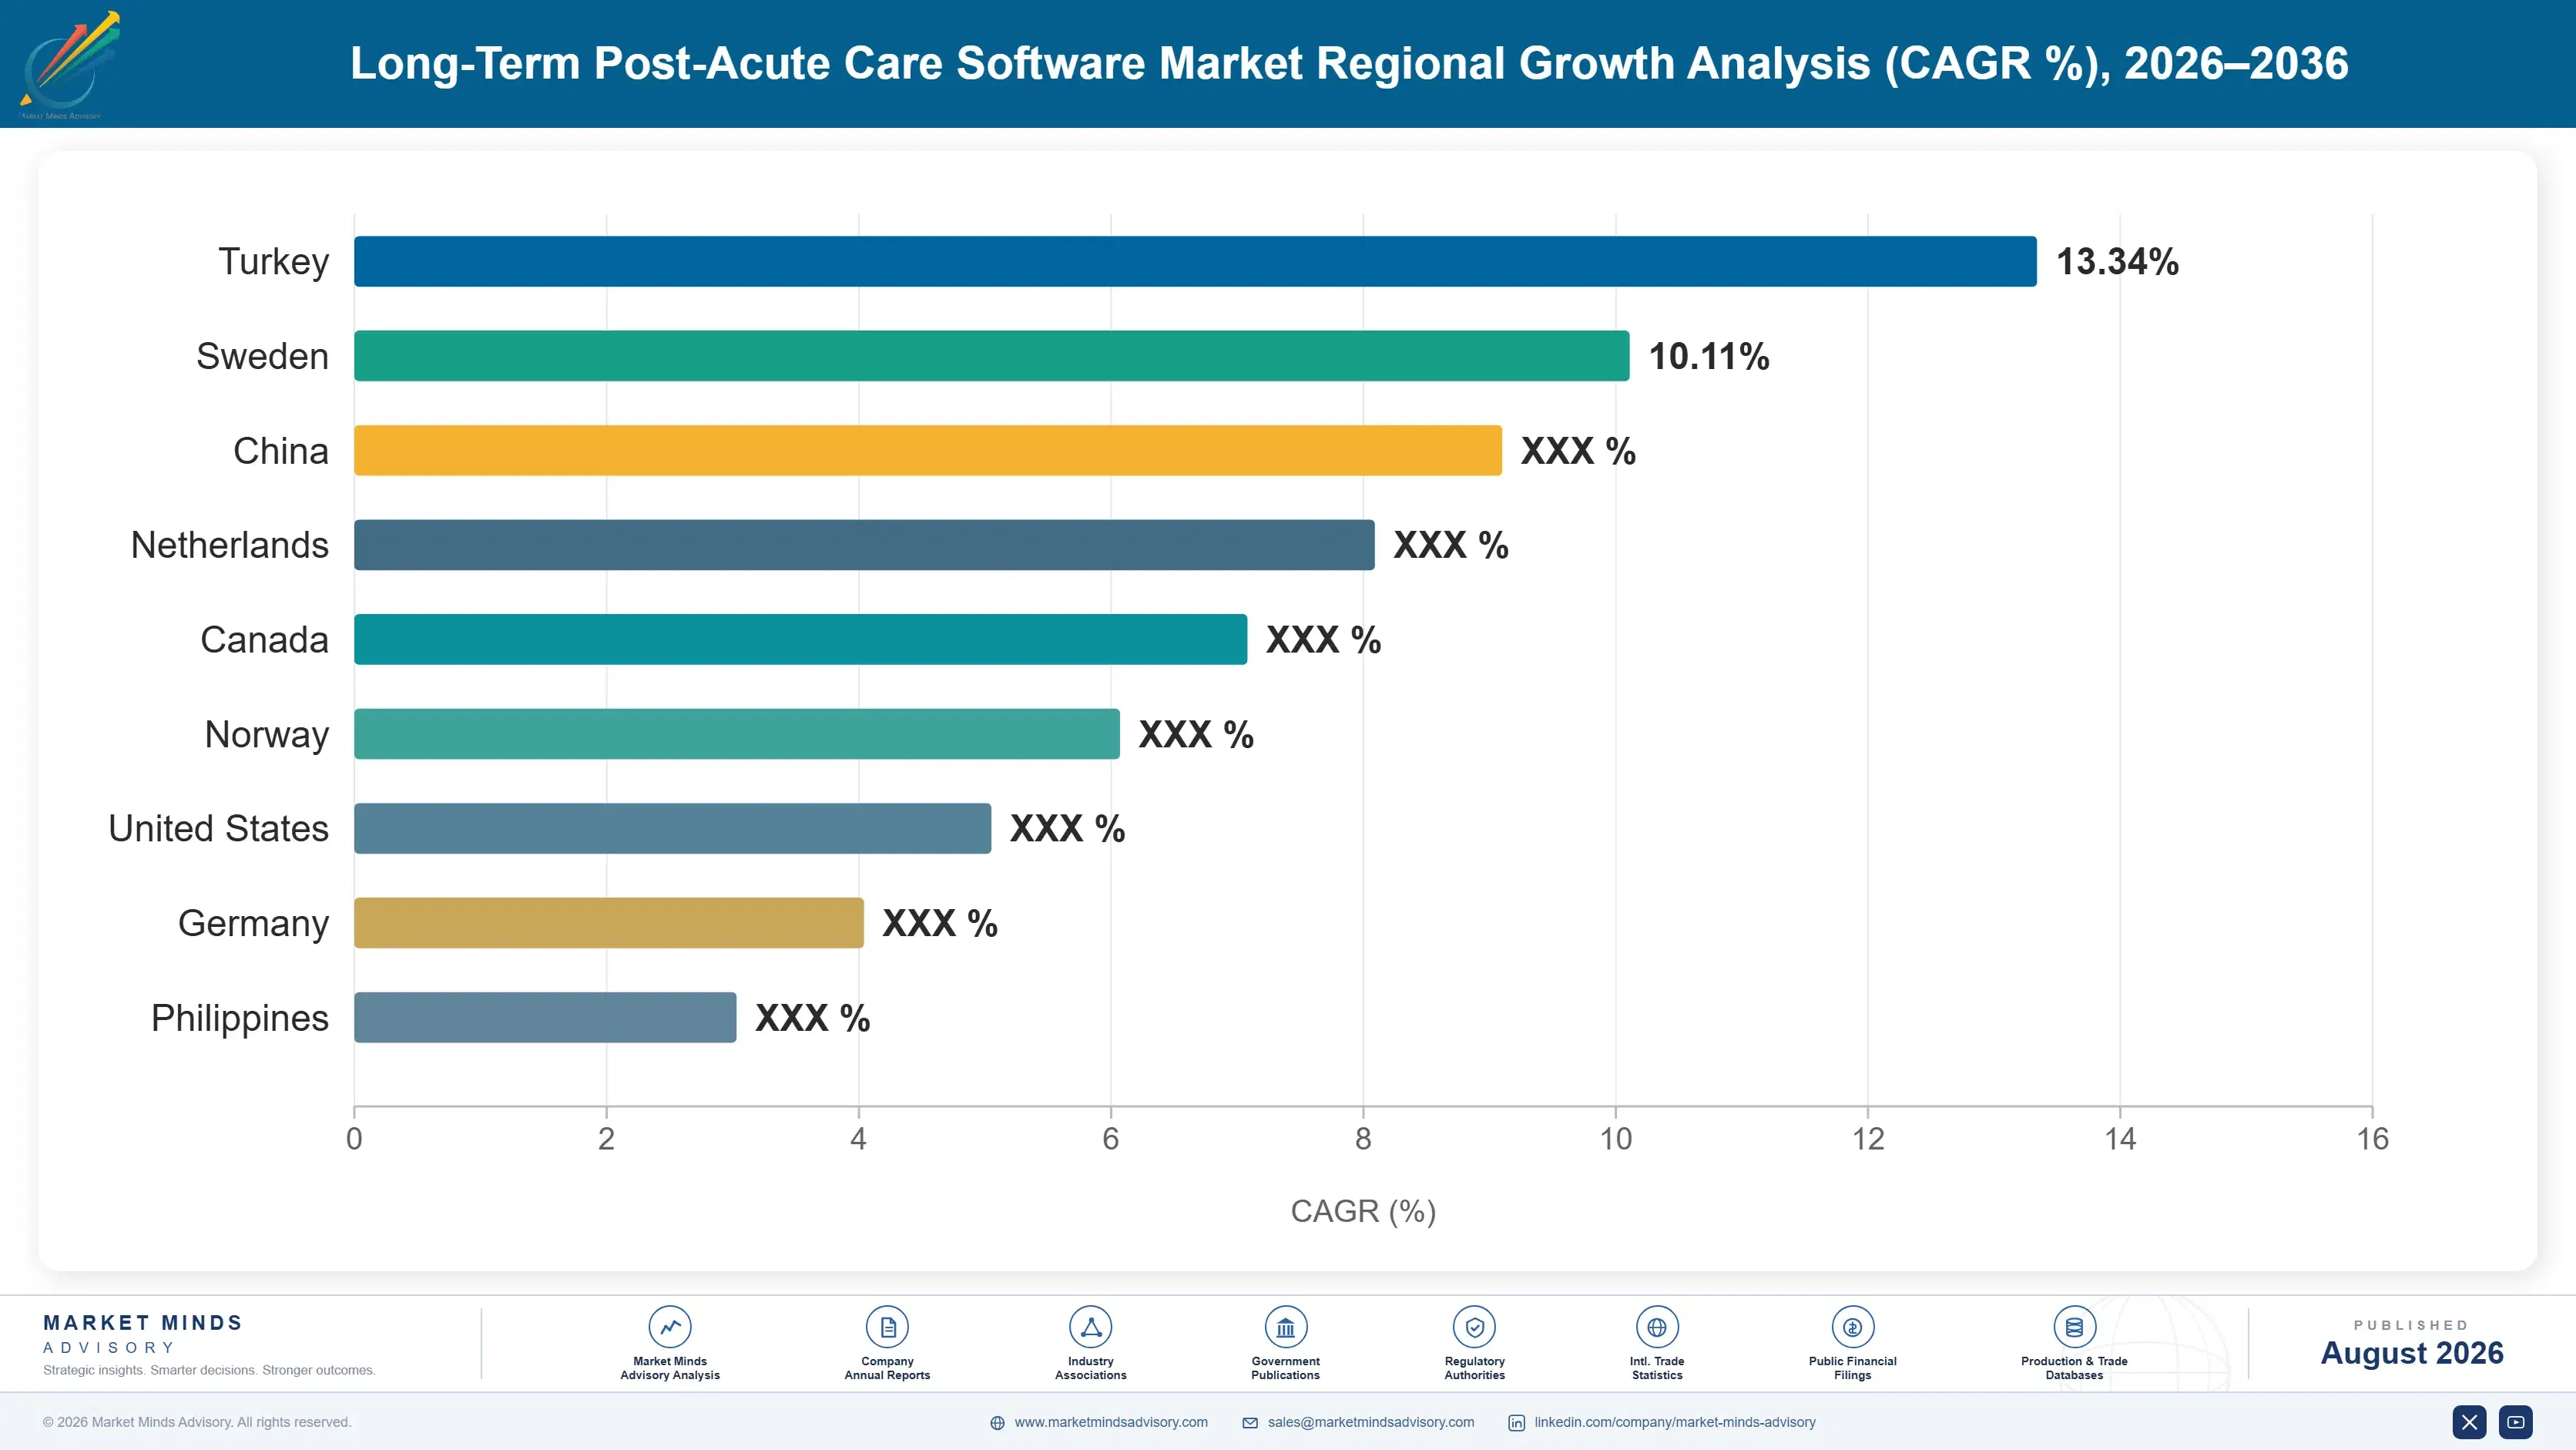
Regional Architecture and Country Demand Map

Regional distribution here is unusually skewed, and reimbursement design rather than population age explains it. Federal assessment instruments and payment models built in the United States created a software requirement that no other health system replicates in the same form or at the same intensity.

North America

Fifty-eight per cent of global value sits here, and it is a genuine reflection of how the market was created rather than an artefact of measurement. Note: this share sits well above the 22 to 32% band because the assessment instruments and payment models that make post-acute software a revenue instrument are United States federal constructions with no equivalent elsewhere. Around 15,000 skilled nursing facilities and more than 11,000 home health agencies operate under those rules, each needing certified documentation capability. Medicare Advantage referral network selection compounds the requirement. Canada adds a smaller provincial long-term care software base with its own reporting instruments and considerably lower per-bed spending. Vendor competition is correspondingly more developed here than anywhere else.
Share: 58% | CAGR: 9.8% (2026 to 2036)

Western Europe

Sixteen per cent, and the shape of demand differs fundamentally from North America. Note: this share falls below the 18 to 26% band because European long-term care runs on social insurance and municipal provision rather than on assessment-driven federal reimbursement, which removes the revenue argument that drives purchase in the United States. The Netherlands and the Nordic countries run the most advanced care documentation systems, generally procured municipally and often built domestically. Germany's statutory long-term care insurance creates documentation requirements around care grades, though the software market remains fragmented across regional vendors. Growth at 8.8% tracks staffing pressure more than payment reform. France and the United Kingdom both run large residential care sectors served by small national vendors.
Share: 16% | CAGR: 8.8% (2026 to 2036)
Regional intelligence for 5 additional markets available in the complete report: East Asia, South Asia and Pacific, Latin America, Middle East and Africa, Eastern Europe. Contact sales@marketmindsadvisory.com.
long-term-post-acute-care-software-market-country-cagr-analysis-1787305724392

Where Post-Acute Software Vendors Capture Value

Displacement almost never works in this market, so growth comes from three other places: attaching modules to accounts already won, occupying the referral pathway between hospital and provider, and pricing against the reimbursement a facility captures rather than against the beds it operates. Each requires a different commercial motion. None of the three depends on winning a competitor's account.

Price against reimbursement captured, not beds operated

The standard model charges roughly $41 per bed monthly, which anchors the conversation on cost and caps software at about 1.9% of facility operating expenditure. Pricing tied to documented reimbursement capture changes the frame entirely, because coding accuracy moves revenue by several per cent of a stay and operators can verify the effect in their own claims data. Vendors piloting this approach report contract values 30% to 45% above per-bed equivalents on comparable facilities. The obstacle is attribution, and solving it requires baseline measurement before implementation begins. Vendors that skip that step cannot defend the premium later.
Market Impact: Contract values 30% to 45% above pe

Attach modules rather than chase competitor accounts

New-logo acquisition costs several times what module attachment costs, because switching requires seven months of implementation and retraining that an operator will avoid unless something has gone badly wrong. Attachment sells to an administrator who already trusts the platform, uses data the vendor already holds, and requires no migration. Vendors running disciplined attachment programmes reach three to four modules per account against an industry average nearer two, and each additional module raises renewal probability measurably. The scarce resource is not sales capacity but product breadth across scheduling, analytics and medication management. Attachment also costs roughly 20% of a new-logo win.
Market Impact: Attachment reaching 4 modules again

Own the discharge pathway before the referral arrives

Care coordination and referral management compounds at 14.8% because whoever carries traffic between discharging hospital and receiving facility occupies a position that is difficult to dislodge. Two acquisitions since 2020 have gone into exactly this layer. Building the connectivity organically is slow, but partnering with an existing exchange network reaches the same position faster and at lower capital cost. Vendors without any referral-layer presence are selling a documentation product while competitors sell a place in the patient's pathway, and the second wins the account. Referral position also survives a clinical platform change, which nothing else in the portfolio does.
Market Impact: Referral coordination layer compoun

Sell analytics as referral protection, not efficiency

Quality reporting software sold on operational efficiency competes against every other discretionary purchase in a facility running thin margins. Sold as the thing that keeps a Medicare Advantage plan sending patients, it competes against nothing, because losing network position costs an operator far more than the subscription. That segment compounds at 15.6% precisely because the argument has shifted. Vendors whose sales teams still lead with dashboards and workflow savings convert at roughly half the rate of those leading with referral volume and network participation risk. The product does not change; the buyer and the budget line both do.
Market Impact: Conversion roughly 2x higher on ref

Who Controls the Margin Pool

The top five hold 64% of the market measured on facilities and agencies under contract, which is the basis used throughout this section. The gap between leader and challenger is wide in skilled nursing, where PointClickCare's installed base substantially exceeds any competitor, and considerably narrower across home health and senior living, where WellSky, Homecare Homebase and MatrixCare each hold defensible positions in particular settings.
Competitive activity currently runs along three lines. Vendors are buying connectivity assets that sit between hospitals and post-acute providers rather than building them. They are extending module breadth across scheduling, analytics and medication management to raise attachment within accounts they already hold. And several are pursuing senior living and assisted living operators, a setting with lighter regulatory documentation requirements and correspondingly weaker incumbency.

Pressure is emerging from two directions. Acute hospital platform vendors are extending post-acute modules downward to health systems that own skilled nursing capacity, which threatens the segment of the market attached to integrated delivery networks. And Medicare Advantage plans increasingly specify which reporting capabilities a network provider must have. Rankings will shift where a vendor's referral-layer position is weak, not where its clinical record is.
long-term-post-acute-care-software-market-company-positioning-matrix-1787305724918

Competitive Moat and Risk Dimensions

POINTCLICKCARE

Moat: Deepest skilled nursing footprint

The platform sits in a majority of United States skilled nursing facilities, and that installed base compounds through network effects rather than merely through scale. Hospitals and health plans exchanging discharge and quality data reach more of their post-acute network through one connection than through any alternative, which makes the platform the default counterparty for everybody else.
POINTCLICKCARE

Risk: Home health position comparatively thin

Skilled nursing strength has not translated proportionally into home health and hospice, where WellSky and Homecare Homebase hold entrenched agency relationships built around a different assessment instrument and a different operating rhythm. As care shifts toward the home under Medicare Advantage steering, that gap matters more each year, and acquisition rather than organic entry looks like the realistic route.
MATRIXCARE

Moat: Widest care setting coverage

Coverage spans skilled nursing, home health, hospice, senior living and life plan communities on one platform family, which suits multi-setting operators who would otherwise run several vendors. Ownership by ResMed adds respiratory and sleep device data that connects to home-based care in ways pure software vendors cannot replicate, particularly across chronic respiratory populations under home health management.
MATRIXCARE

Risk: Parent capital priorities sit elsewhere

ResMed's core business is respiratory devices, and software competes internally for capital against a hardware franchise with different margins and a different investment rhythm. Competitors funded by private equity or operating as focused software businesses can commit to acquisition and product investment at a pace that a device parent balancing several priorities may not match consistently.

Players Tracked

Prominent Players

PointClickCare
MatrixCare
WellSky
Netsmart Technologies
Homecare Homebase

Other Key Players

Axxess
KanTime
Yardi Systems
Eldermark
TruBridge
Thornberry
Complia Health
Alora Health
CareVoyant
Net Health
Forcura
Cantata Health Solutions
Medtelligent
Caremerge
ADL Data Systems

Recent Developments

DECEMBER 2020

PointClickCare acquires Collective Medical

PointClickCare acquired Collective Medical, a real-time care coordination network connecting hospitals, health plans and post-acute providers across the United States. The purchase added a live notification layer to a platform that previously held documentation only, and it placed the vendor directly in the discharge pathway rather than adjacent to it.
Signal: Documentation vendors are now buying their
APRIL 2022

Audacious Inquiry purchase extends exchange reach

PointClickCare acquired Audacious Inquiry, which had built health information exchange and public health reporting infrastructure used by state agencies and health systems. The acquisition extended the vendor's connectivity beyond its own customer base into the wider data exchange layer that federal interoperability policy was already moving toward.
Signal: Federal interoperability policy made data
APRIL 2024

Federal minimum staffing standard finalised for nursing homes

The Centers for Medicare and Medicaid Services finalised a minimum staffing standard for long-term care facilities specifying total nurse hours per resident day. The rule faced immediate legal challenge, but operators moved on workforce scheduling and compliance software regardless, since state requirements were tightening on a parallel track.
Signal: Regulatory staffing pressure sells workfor

What Actually Costs Money Here

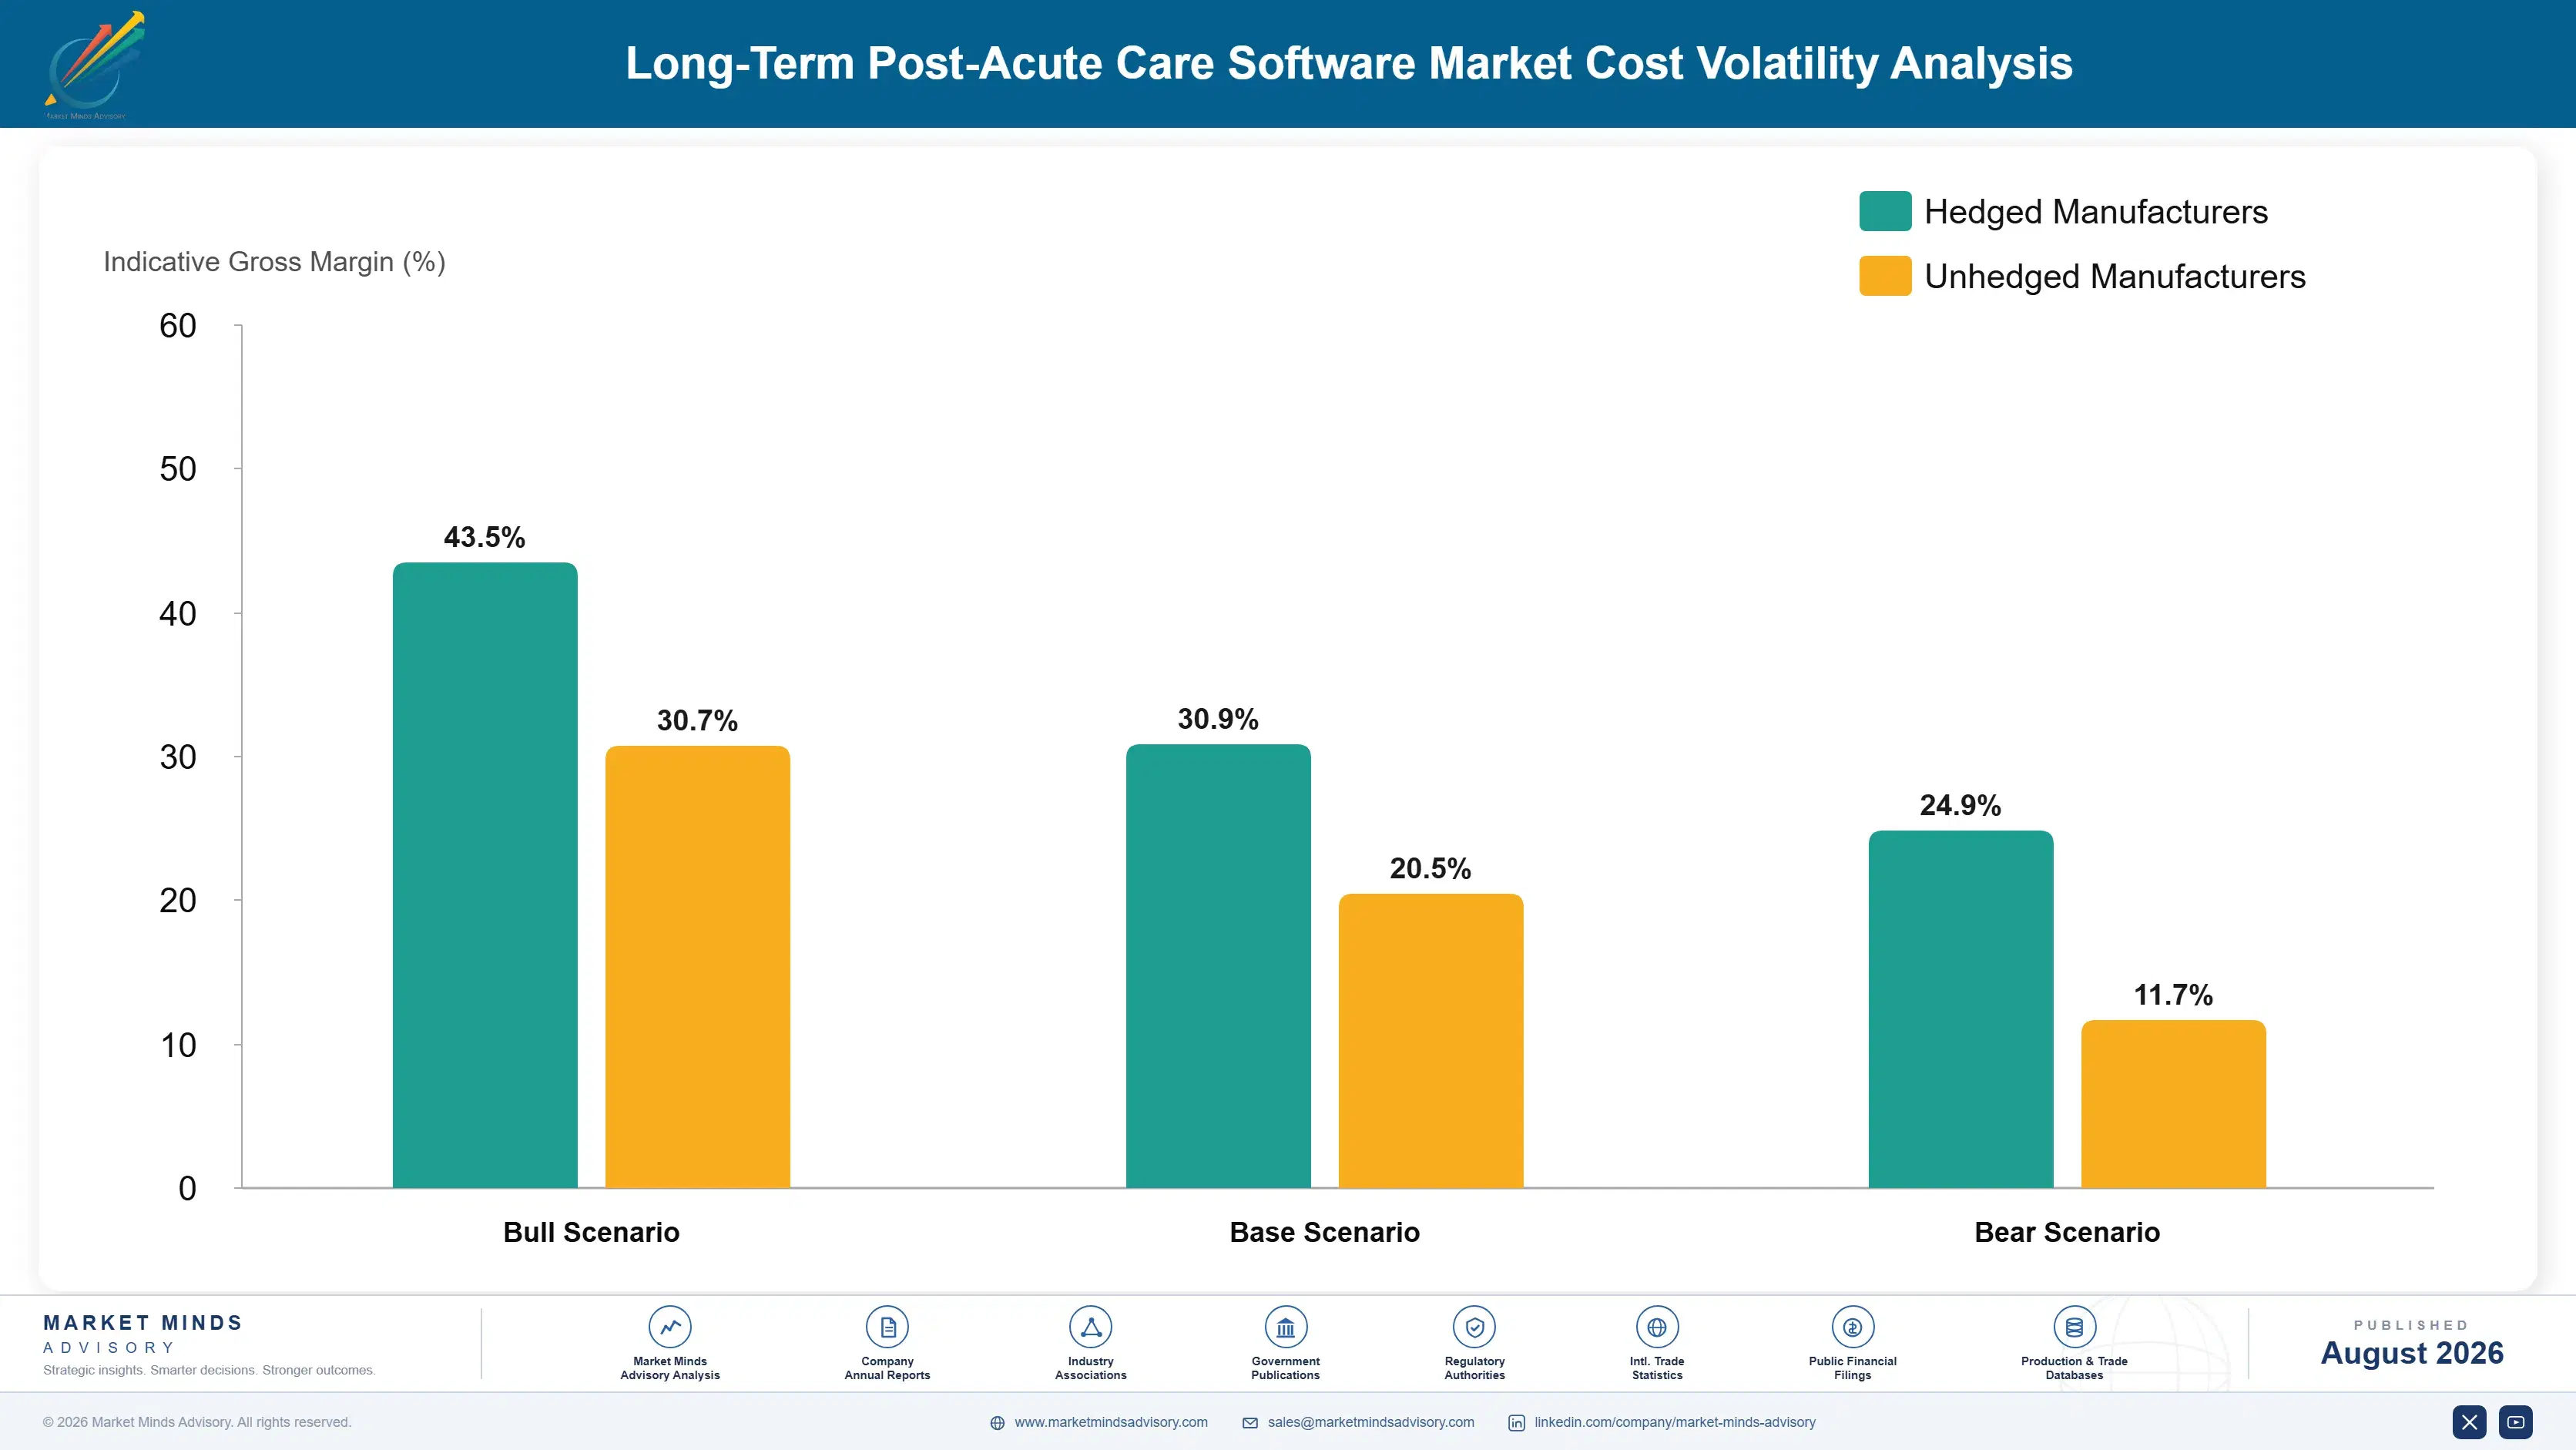
This is a software business, so the cost base is people and infrastructure. Engineering and product headcount absorbs roughly 34% of cost of revenue and operating expense combined, concentrated in the United States, Canada and India. Cloud hosting and infrastructure adds a further 13%, sourced almost entirely from three hyperscale providers. Implementation and customer success staffing carries around 19%, and that share does not fall much with scale.
Cloud pricing moved against vendors through 2022 and 2023 as committed-use discounts reset at higher rates while data volumes grew with imaging, notification traffic and analytics workloads. Vendor annual reports across health information technology documented hosting cost growth outpacing revenue growth during that interval. Engineering wage inflation compounded the effect, particularly for developers with clinical interoperability experience, where the available talent pool is genuinely narrow and hiring cycles run long.

Exposure varies sharply by product architecture. Vendors still running client-hosted or single-tenant deployments carry per-customer infrastructure and upgrade cost that multi-tenant competitors do not, and that difference shows directly in gross margin and in the pace at which new modules reach the installed base. Implementation-heavy vendors serving small independent operators also carry a cost-to-serve that large multi-site accounts absorb far more comfortably.
long-term-post-acute-care-software-market-cost-volatility-analysis-1787305725114

Multi-tenant consolidation of legacy deployments

Migrating remaining single-tenant and client-hosted customers onto shared infrastructure removes duplicated upgrade work and cuts per-customer hosting cost materially. The migration is unpopular with operators who fear disruption to reimbursement-critical workflows, so it usually needs to be paired with functionality those customers actually want. Vendors that have completed the migration report gross margin gains of several points.

Implementation cost recovered through longer contract terms

Absorbing implementation into a multi-year subscription rather than billing it separately removes the largest single objection to switching, while recovering the cost across the term. It also aligns vendor and operator incentives around a go-live that works, since the vendor carries the cost of a difficult implementation directly. It does, however, push cash recovery further out.

Offshore engineering for non-clinical development

Reporting, integration and infrastructure work moves offshore comfortably, while clinical workflow and assessment logic generally does not, since that work requires familiarity with reimbursement instruments. Vendors splitting the portfolio this way hold clinical engineering onshore and cut blended development cost without accepting risk in the regulated parts of the product. Regulatory audit exposure stays onshore.

Portfolio Architecture for Margin Defence

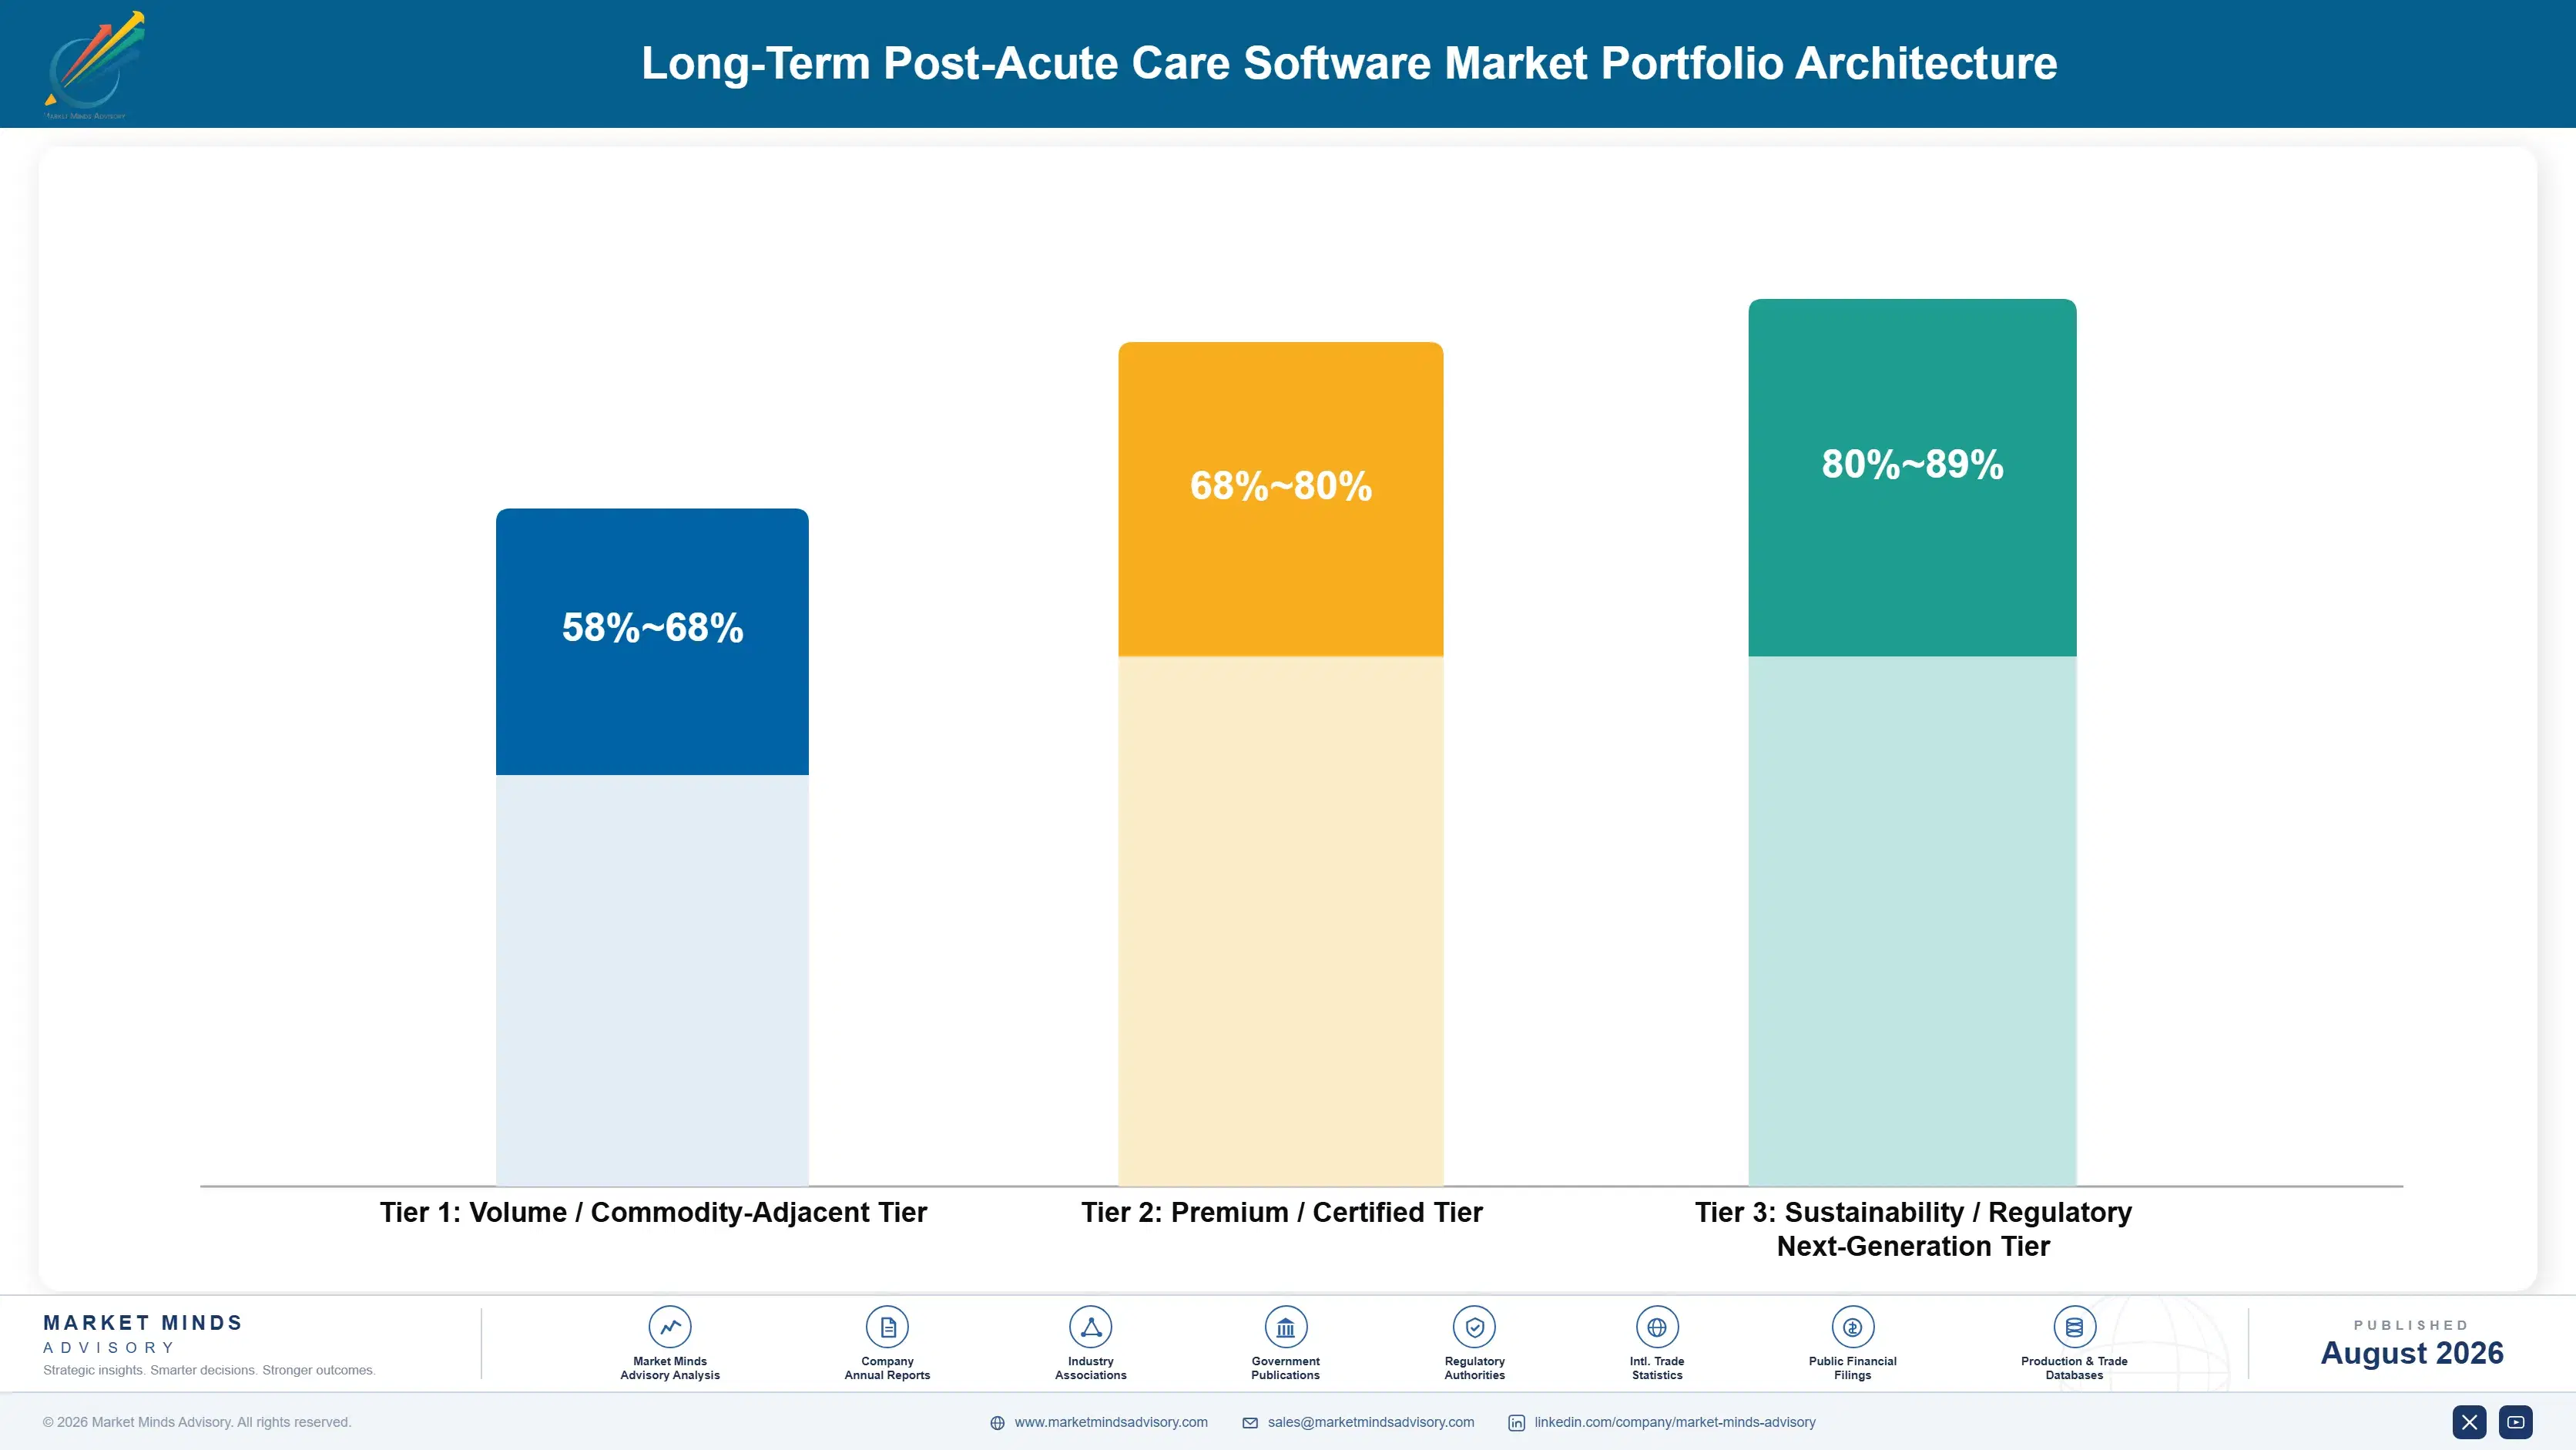
Margin structure in this market separates cleanly by how much human effort each product requires after the sale. Core clinical records carry heavy implementation and support cost against a price anchored to per-bed convention, which holds gross margin in the sixties. Analytics and reporting products run on data the vendor already holds and deploy with little configuration, which is why they clear well above eighty per cent.
The tension is between census and premium. Selling the clinical record to every facility builds the installed base that everything else depends on, but it does so at the market's lowest margin and highest cost to serve. Vendors that chase census without attaching modules end up with scale and no economics. Vendors that chase margin without census run out of accounts to sell into within a few years.

High-value pools concentrate where the product is sold against a revenue consequence rather than an efficiency claim. Analytics that protects referral volume, reimbursement software that recovers coding accuracy, and referral network connectivity all price against money the operator wins or loses. Everything sold on time saved competes with every other discretionary line in a facility whose margin sits in low single digits.

Volume / Commodity-Adjacent Tier

Core clinical records, assessment capture and medication management sold at per-bed subscription rates to independent and small multi-site operators, carrying heavy implementation and support cost against a price the market has anchored firmly.
Gross Margin: 58-68%

Premium / Certified Tier

Revenue cycle, reimbursement optimisation and workforce compliance modules sold into accounts already running the clinical platform, priced against reimbursement captured or regulatory exposure avoided rather than against bed count. Attachment rather than acquisition drives this tier.
Gross Margin: 68-80%

Sustainability / Regulatory / Next-Generation Tier

Analytics, quality reporting and referral network connectivity, running on data the platform already holds, deploying with minimal configuration and defended by network position rather than by product features competitors could copy.
Gross Margin: 80-89%
long-term-post-acute-care-software-market-portfolio-architecture-1787305725614

Who Buys and What Holds Them

Revenue here is almost entirely subscription, and retention economics dominate everything else. Operators keep clinical platforms for around nine years and renew at roughly 94%, so the value of an account is measured across a decade rather than a contract term. That makes customer acquisition cost recoverable over an unusually long horizon, and it makes any loss expensive in a way that quarterly revenue reporting understates considerably.
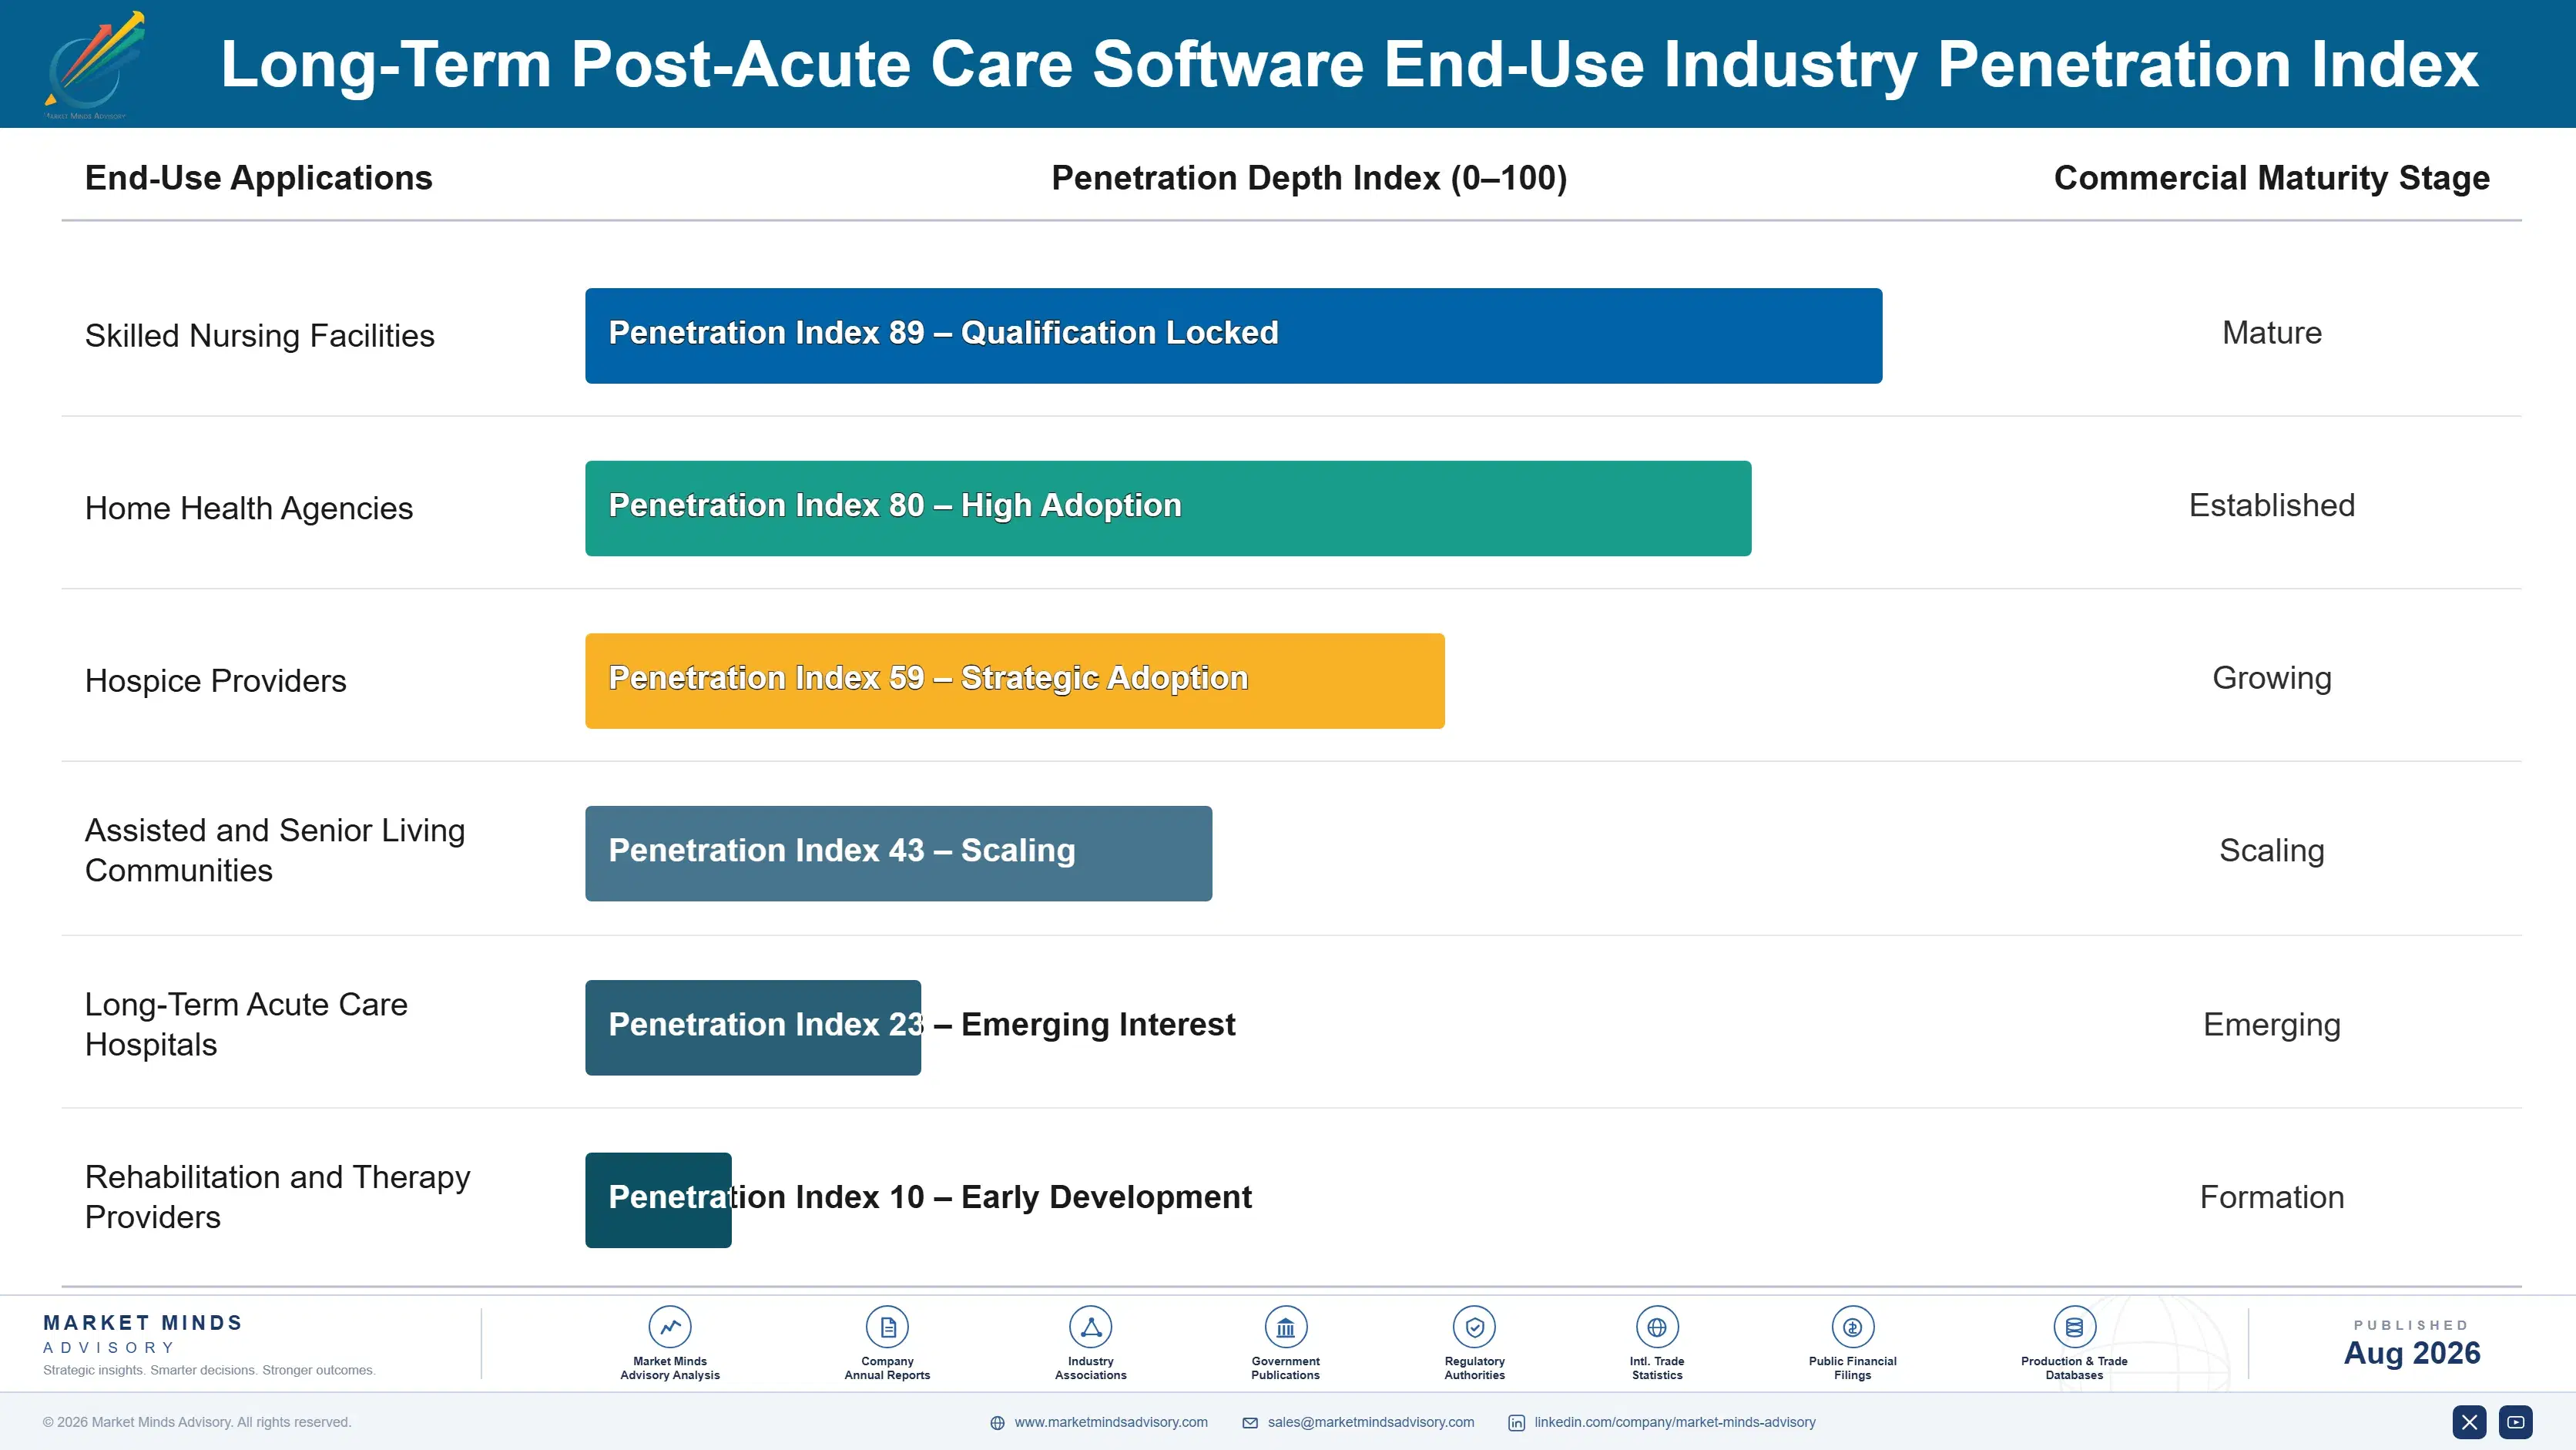
Stickiness varies sharply by setting. Skilled nursing is the deepest, since assessment workflows sit in bedside nursing practice and drive reimbursement directly. Home health follows closely for the same reason under a different instrument. Senior living and assisted living are considerably looser: documentation requirements are lighter, staff turnover is higher, and switching costs fall accordingly. That is precisely why competitive entry attempts concentrate in those settings.

The buyer profile is also shifting. Independent single-facility operators, historically the majority, continue consolidating into regional and national groups that buy centrally, evaluate formally and negotiate on portfolio terms rather than facility by facility. That raises deal size and lengthens sales cycles simultaneously. It also rewards vendors with breadth across settings, since a multi-setting operator will not run four platforms if one covers the portfolio adequately.
long-term-post-acute-care-software-market-end-use-penetration-index-1787305726103

Where Value Actually Sits

These are among the four positions where our research anticipates prominent divergence between winners and laggards over the coming forecast period. Each is grounded in the demand model, the regulatory perimeter, and the announced capacity pipeline.
01 / REFERRAL PATHWAY POSITION

Own the discharge connection or sell a commodity record

Care coordination and referral management compounds at 14.8%, and the two most significant platform acquisitions of the past several years both went into precisely that connectivity layer rather than into any additional clinical functionality. Whoever carries the traffic between a discharging hospital and the receiving post-acute facility holds a position that documentation products cannot reach or replicate at any price. Vendors without any referral-layer presence are selling a documentation record while their competitors sell a place in the patient's actual discharge pathway.
02 / MODULE ATTACHMENT DISCIPLINE

Attachment beats displacement by a wide margin

Switching costs an operator seven months of implementation and bedside nursing retraining, which they will avoid entirely unless something has gone badly wrong, which is why renewal sits near 94% and new-logo acquisition runs painfully slow. Disciplined attachment programmes reach three to four modules per account against an industry average nearer two, using data the vendor already holds and requiring no migration. Sales capacity is rarely the binding constraint in this market; product breadth across scheduling, analytics and reimbursement capture is.
03 / REIMBURSEMENT-LINKED PRICING MODEL

Price against captured revenue rather than bed count

Per-bed pricing near $41 monthly anchors software at roughly 1.9% of facility operating expenditure, and it forces every subsequent purchase to compete against other discretionary spending inside a business running on thin single-digit margins. Pricing tied to documented reimbursement capture reframes the conversation, since coding accuracy moves stay revenue by several per cent and operators verify it in their own claims data. Vendors piloting the approach report contract values 30% to 45% above per-bed equivalents on comparable facilities, with attribution the remaining obstacle.
04 / SETTING COVERAGE BREADTH

Multi-setting operators will not run four platforms

Consolidation is steadily moving purchasing away from independent single facilities toward regional and national groups that evaluate centrally, buy on portfolio terms and negotiate across every setting at once. Those buyers want a single vendor spanning skilled nursing, home health, hospice and senior living rather than four separate vendor relationships to manage, integrate and renew independently. Vendors strong in a single setting and thin across all the others will steadily lose portfolio decisions they would comfortably have won facility by facility.

Engagement Snapshot From the Field

A live engagement with an industry participant carrying material or product regulatory and market exposure ahead of a defining policy shift, showing how our research translates into a defensible multi-year portfolio strategy.
MARKET MINDS ADVISORY · CLIENT ENGAGEMENT SUMMARY
Long-Term Post-Acute Care Software Producer Strategic Portfolio Review and Transition Roadmap 2026·Investment Scenario on Long-Term Post-Acute Care Software Exposure Evaluation 2025-26
CLIENT PROFILE
A privately held operator running 74 skilled nursing facilities and 21 assisted living communities across five states, with roughly 8,900 licensed beds and annual revenue near $840 million (client-reported, unverified by MMA). The group had grown through acquisition and was running three separate clinical platforms inherited from acquired portfolios, alongside a fourth system for scheduling and a fifth for revenue cycle work.
STRATEGIC CHALLENGE
Consolidating onto a single platform meant an implementation across 95 sites and the reimbursement risk that comes with retraining nursing staff whose documentation drives payment. Leadership needed to know whether consolidation savings and reporting capability justified that exposure, and which vendor could actually cover both skilled nursing and assisted living without a second system.
MMA APPROACH
We modelled total cost of ownership across the three incumbent platforms and four consolidation candidates, including implementation, retraining and estimated reimbursement disruption during transition. Twenty-two facility administrators and directors of nursing were interviewed on documentation workflow. We also tested each candidate vendor's referral network reach against the hospital systems supplying the group's admissions.
KEY FINDINGS
  1. Consolidation savings on licensing alone recovered barely a third of implementation cost; the case had to rest on reporting capability and referral positioning instead.
  2. Two of the three incumbent platforms lacked the quality reporting depth that the group's largest Medicare Advantage contracts were already beginning to require of network providers.
  3. Assisted living communities showed materially lower switching cost than skilled nursing facilities, making a staged migration beginning there both safer and faster to execute.
  4. One candidate vendor's referral network already connected to eleven of the fourteen hospital systems supplying the group's admissions, which no competitor came close to matching.
CLIENT PROFILE
A privately held operator running 74 skilled nursing facilities and 21 assisted living communities across five states, with roughly 8,900 licensed beds and annual revenue near $840 million (client-reported, unverified by MMA). The group had grown through acquisition and was running three separate clinical platforms inherited from acquired portfolios, alongside a fourth system for scheduling and a fifth for revenue cycle work.
STRATEGIC CHALLENGE
Consolidating onto a single platform meant an implementation across 95 sites and the reimbursement risk that comes with retraining nursing staff whose documentation drives payment. Leadership needed to know whether consolidation savings and reporting capability justified that exposure, and which vendor could actually cover both skilled nursing and assisted living without a second system.
MMA APPROACH
We modelled total cost of ownership across the three incumbent platforms and four consolidation candidates, including implementation, retraining and estimated reimbursement disruption during transition. Twenty-two facility administrators and directors of nursing were interviewed on documentation workflow. We also tested each candidate vendor's referral network reach against the hospital systems supplying the group's admissions.
KEY FINDINGS
  1. Consolidation savings on licensing alone recovered barely a third of implementation cost; the case had to rest on reporting capability and referral positioning instead.
  2. Two of the three incumbent platforms lacked the quality reporting depth that the group's largest Medicare Advantage contracts were already beginning to require of network providers.
  3. Assisted living communities showed materially lower switching cost than skilled nursing facilities, making a staged migration beginning there both safer and faster to execute.
  4. One candidate vendor's referral network already connected to eleven of the fourteen hospital systems supplying the group's admissions, which no competitor came close to matching.
RECOMMENDED STRATEGY
Phase 1: Phase one: migrate the 21 assisted living communities first, proving the implementation model where reimbursement exposure during transition is lowest. Phase 2: Phase two: move skilled nursing facilities in cohorts of eight to twelve, with parallel documentation running for six weeks at each site. Phase 3: Phase three: retire the separate scheduling and revenue cycle systems, attaching equivalent modules on the consolidated platform once clinical migration completes.
OUTCOME
The group completed assisted living migration within seven months and began skilled nursing cohorts on schedule. Reimbursement variance during transition stayed under one per cent against a modelled worst case of four (client-reported, unverified by MMA). Two Medicare Advantage plans expanded the group's network participation after quality reporting improved.

Frequently Asked Questions

Foundational context covering the market sizes, CAGR, scope, country, region and competition that inform every finding below. This section is provided to cover basics and most often pre-purchase conversations, answered from the MMA Primary Research Dataset.

What is the current size of the Long-Term Post-Acute Care Software Market?

The global market is valued at $4.2 billion in 2025, rising to $4.64 billion in 2026. North America accounts for 58% of that value, reflecting United States federal payment models that create the underlying software requirement.

How large will the Long-Term Post-Acute Care Software Market be by 2036?

MMA forecasts $12.48 billion by 2036, an increase of $7.84 billion over the 2026 base and an expansion multiple of 2.69x. The bull case reaches higher on faster value-based care adoption in post-acute settings.

What is the CAGR for the Long-Term Post-Acute Care Software Market 2026 to 2036?

The base case compound annual growth rate is 10.4%, with a bull case at 11.6% and a bear case at 9.2%. Historical growth from 2020 to 2025 ran near 9.0%, driven mainly by two payment model changes.

Which segment is growing fastest?

Analytics, quality reporting and value-based care software compounds at 15.6%, a full 1.50x the market rate. Medicare Advantage plans and hospital networks now select post-acute partners on measured outcomes, making the reporting capability a condition of receiving referrals.

Who are the major companies in the Long-Term Post-Acute Care Software Market?

PointClickCare, MatrixCare, WellSky, Netsmart Technologies and Homecare Homebase together hold 64% of the market measured on facilities and agencies under contract. PointClickCare holds the deepest skilled nursing footprint of the five.

Which country is growing fastest?

China compounds at 13.2%, faster than any other country covered, as long-term care insurance pilots expand across 49 cities and push institutional operators toward digital record keeping. The starting base remains genuinely small.

Report Segmentation Architecture

The full report scope spans multiple orthogonal segmentation dimensions, with cross-tabulated demand data provided for each dimension pair. Coverage extends further to regional breakdowns, trend trajectories, and the competitive detail needed to support segment-level decision-making.

By Software Application Type

  • Clinical Electronic Health Record and Assessment Platforms
  • Revenue Cycle and Reimbursement Optimisation Software
  • Care Coordination and Referral Management Software
  • Workforce Scheduling and Staffing Compliance Software
  • Analytics, Quality Reporting and Value-Based Care Software
  • Medication Management and Electronic Administration Records

By End-Use Industry

  • Skilled Nursing Facilities
  • Home Health Agencies
  • Hospice Providers
  • Assisted and Senior Living Communities
  • Long-Term Acute Care Hospitals
  • Rehabilitation and Therapy Providers

By Commercial Dimension

  • Independent Single-Site Operators
  • Regional Multi-Site Groups
  • National Portfolio Operators
  • Health System Owned Post-Acute Networks
  • Direct Subscription Sales
  • Channel and Reseller Distribution

By Region

  • East Asia
  • North America
  • Western Europe
  • South Asia and Pacific
  • Latin America
  • Middle East and Africa
  • Eastern Europe

Scope, Methodology, and Coverage

Every figure in this report is reproducible from documented input assumptions. The scope below maps the historical period, the forecast horizon, the segmentation dimensions, and the countries covered, alongside the underlying primary and qualitative methodology.
Historical Period
2020 to 2025
Forecast Period
2026 to 2036
Base Year
2025 (USD billions; MMA Primary Research Dataset, August 2026)
Market Definition
This market comprises software licensed or subscribed by long-term and post-acute care providers, measured at vendor revenue across direct subscription sales, channel and reseller distribution, implementation and configuration services bundled into subscription terms, and module attachment within existing accounts. Coverage spans clinical electronic health record and assessment platforms supporting federally mandated instruments, revenue cycle and reimbursement optimisation software, care coordination and referral management including discharge notification networks, workforce scheduling and staffing compliance systems, analytics with quality reporting and value-based care measurement, and medication management with electronic administration records. Acute hospital electronic health record systems, ambulatory physician practice management, payer administration platforms, remote patient monitoring hardware and connectivity, pharmacy dispensing systems, and staffing agency placement services fall outside scope.
Quantitative Units
USD millions (current prices); facilities and agencies under contract; licensed beds covered; subscription revenue per bed; module attachment rate per account; contract renewal rate; implementation cycle length
Segmentation Dimensions
By Software Application Type; By End-Use Industry; By Commercial Dimension; By Region
Regions Covered
East Asia, North America, Western Europe, South Asia and Pacific, Latin America, Middle East and Africa, Eastern Europe
Countries Covered
United States, Canada, United Kingdom, Germany, France, Netherlands, Sweden, Denmark, Norway, Finland, Italy, Spain, Japan, China, South Korea, Taiwan, Australia, New Zealand, India, Singapore, Brazil, Mexico, Chile, Argentina, Saudi Arabia, United Arab Emirates, South Africa, Poland, Czechia, Hungary, Romania, and additional markets relevant to post-acute care analysis
Key Companies Profiled
PointClickCare, MatrixCare, WellSky, Netsmart Technologies, Homecare Homebase, Axxess, KanTime, Yardi Systems, Eldermark, TruBridge, Thornberry, Complia Health, Alora Health, CareVoyant, Net Health, Forcura, Cantata Health Solutions, Medtelligent, Caremerge, ADL Data Systems
Quantitative Methodology
Primary survey, n=3,800 respondents, Q4 2025, six countries; demand-side model with trade association cross-validation
Qualitative Methodology
47 expert interviews, Q4 2025; applied to validate demand model assumptions, identify emerging dynamics, and assess competitive positioning
Report Format
PDF and XLSX data workbook (Word format preview document)
Publisher
Market Minds Advisory
Report Code
MMA-2026-TEC-423
Published
August 2026
Contact
sales@marketmindsadvisory.com | www.marketmindsadvisory.com

Purchase the full Long-Term Post-Acute Care Software Market Report (2026 to 2036).

The full MMA report explains why a sector that federal adoption incentives skipped entirely became a $4.2 billion software market anyway, tracing the payment reforms that made documentation quality decide provider revenue. It sizes six application categories and seven regions to 2036, modelling facilities under contract, beds covered, per-bed pricing, module attachment and renewal separately. Competitive assessment covers twenty vendors on one consistent basis of facilities and agencies under contract. Cost exposure is traced through engineering, hosting and implementation staffing. Four commercial levers and a strategic verdict close the report, grounded in 47 expert interviews and a 3,800-respondent survey.
Six software application categories sized separately through 2036
Payment model mechanics mapped to software purchase decisions
Module attachment rates benchmarked across vendor account bases
Twenty vendors assessed on facilities and agencies contracted
Referral network position quantified against hospital system reach
Anonymised operator engagement with tested consolidation recommendations

Built For The People Who Decide

From boardroom strategy to bench-side execution, this report is read cover-to-cover by leaders shaping the next decade of their industry, turning demand scenarios, market dynamics and valuation benchmarks into decisions.
CXOs/ Presidents/ VPs/ Managers
M&A and Corporate Development
Strategy Teams and R&D Heads
Procurement and Product Directors
Regulatory and Compliance Leaders
Investor Relations and Equity Analysts