Market Minds Advisory
High Voltage Direct Current Transmission Market

High Voltage Direct Current Transmission Market: HVDC Transmission: Offshore Wind Turned A Niche Interconnector Technology Into Core Grid Infrastructure

A commercial reading of high voltage direct current transmission, where offshore wind connection turned a niche interconnector technology into core infrastructure, and converter station capacity now runs years behind projects waiting to connect.

Lead Analyst

Gabriel Dias

Published

August 2026

Make Smarter Decisions with Customized Research Insights

Request a free sample report and evaluate market opportunities, growth trends, and competitive dynamics relevant to your business needs.

2025 MARKET VALUE$19.4BMarket Size 2025
2036 FORECAST VALUE$54.2BBase Case , 2026 to 2036
CAGR 2026 TO 20369.8 %Bull 11.1% / Bear 8.5%
INCREMENTAL OPPORTUNITY$33.0BNet 10- year value creation
EXPANSION MULTIPLE2.55x2036 value over 2026 base
Strategic Levers
M&A Pipeline
Regional Outlook
Country Rankings
Competitive Intelligence
Segmental Deep-dive
Call-Us : 91 93563 13602

Executive Snapshot and Market Trajectory.

Offshore wind connection has turned HVDC from a specialist interconnector technology into core grid infrastructure almost everywhere new generation sits far from load centres today. Converter station capacity, not turbine installation, increasingly sets how fast offshore wind actually reaches the grid, and that reversal is reshaping supplier priorities considerably.
The market stands at USD 19.4 billion in 2025 and reaches USD 54.25 billion by 2036 at a 9.8% CAGR. VSC-based converter systems grow fastest at 14.6%, about 1.49 times the overall rate, as offshore wind and multi-terminal projects favour voltage source technology over older designs. East Asia holds the largest share at 30% on Chinese ultra-high-voltage grid buildout, while the United Kingdom posts the quickest national growth at 13.2% on North Sea wind interconnection.
Concentration sits at CR5 of 58%, reflecting how few manufacturers hold the power electronics expertise and project track record utilities require before awarding a converter station contract. Two forces now reshape the field. Converter manufacturing capacity has become the binding constraint on project timelines industry-wide, and multi-terminal grid architecture is turning what were once point-to-point links into genuine meshed direct current networks.
Market Definition
The HVDC transmission market covers converter stations, cables, control and protection systems, and directly attached engineering services used to transmit electricity as direct current over long distances or across water. It includes voltage source and line-commutated converter technology, submarine and underground cables, overhead transmission equipment, and multi-terminal grid systems. Standard alternating current transmission equipment, distribution-level infrastructure, and generation equipment itself are excluded.
Base Year Value
$19.4B in 2025 (MMA Primary Research Dataset, August 2026)
Forecast Period
2026 to 2036, eleven discrete annual values
CAGR
9.8% base case. Bull 11.1%. Bear 8.5%.
Fastest Growth Segment
VSC-Based HVDC Converter Systems: 14.6% CAGR
Fastest Growth Country
United Kingdom: 13.2% CAGR
Fastest Growth Region
South Asia and Pacific: 11.9% CAGR
Largest Region
East Asia: 30% of 2025 global value
Market Leaders
Siemens Energy, Hitachi Energy, GE Vernova, Prysmian, Nexans. Source: MMA Analysis based on company annual reports.
Primary Survey
n=3,800 procurement and R&D decision-makers, Q4 2025, six countries
Methodology
Demand-side build-up, cross-validated against public data, 47 expert interviews

High Voltage Direct Current Transmission Market Forecast Scenarios

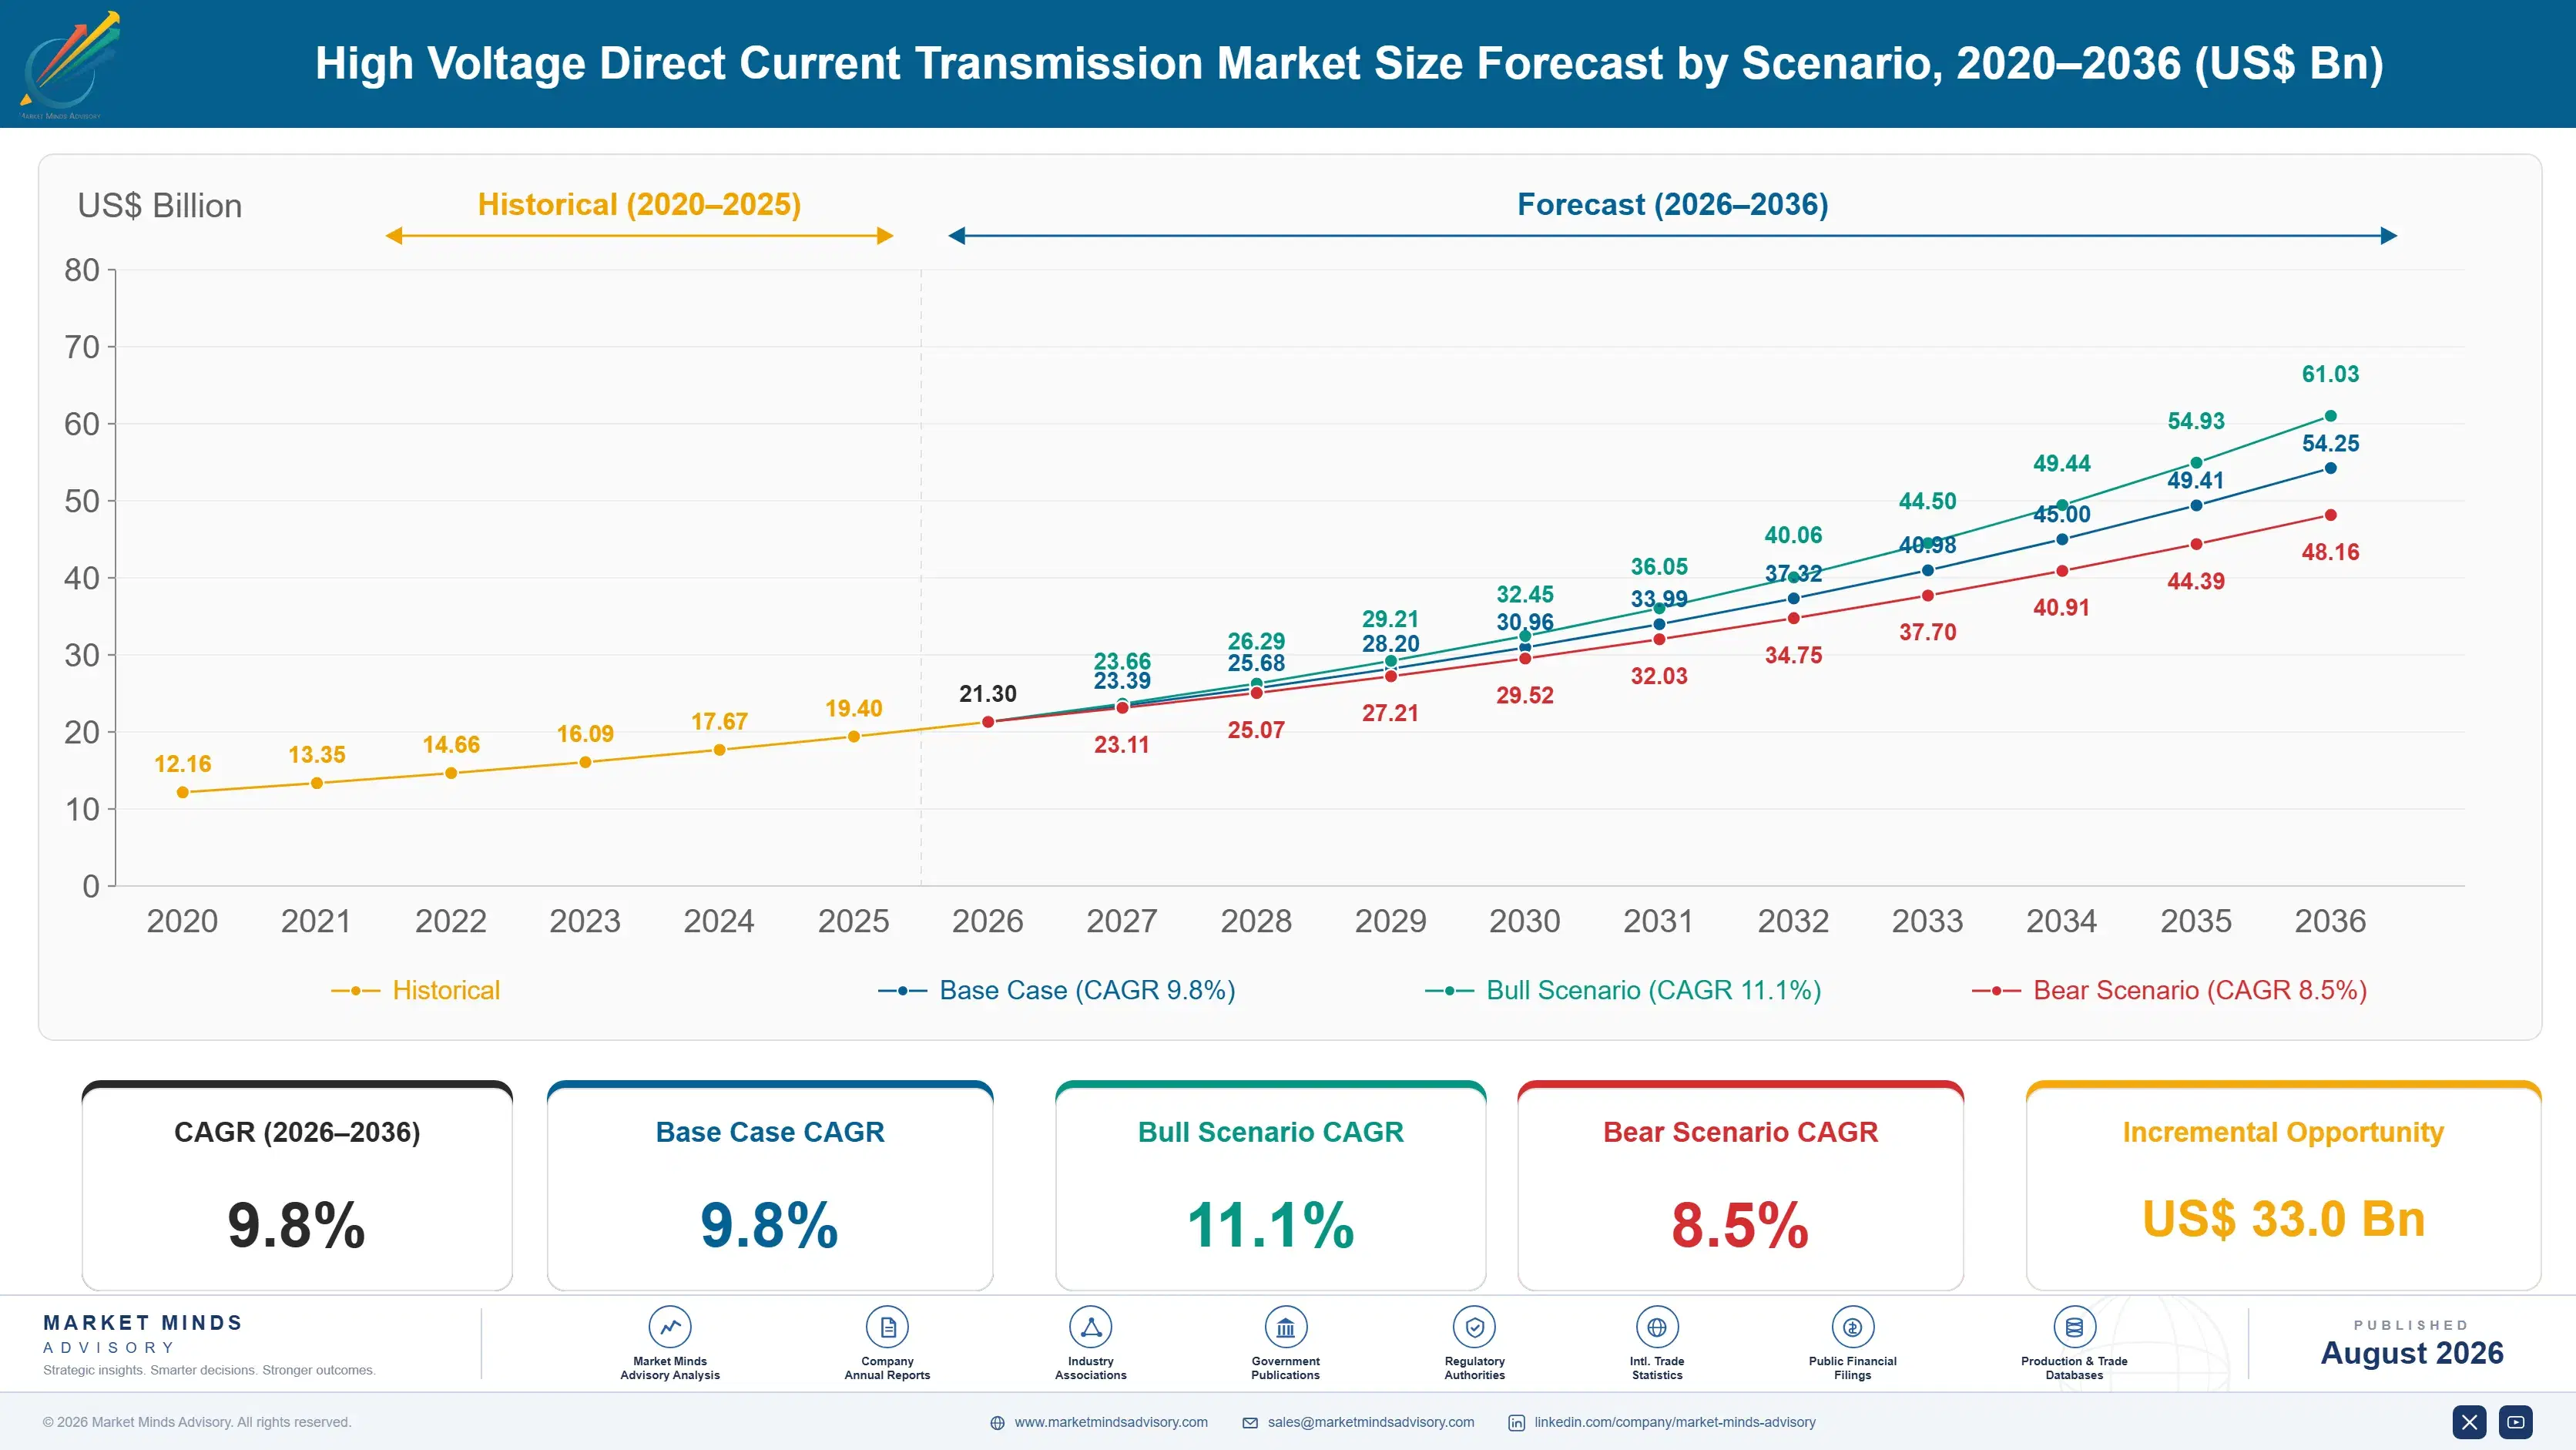
high-voltage-direct-current-transmission-market-size-forecast-scenario-1787324341066
Growth from 2020 to 2025 compounded near 8.4%, building steadily on Chinese ultra-high-voltage buildout before offshore wind interconnection demand in Europe accelerated the pace considerably from 2022 onward. Converter manufacturing capacity struggled to keep pace with the sudden surge in offshore wind project awards, and lead times extended well beyond what developers had originally planned.
Three mechanisms carry the base case to 9.8%. First, offshore wind interconnection: wind farms sited far from shore require HVDC to transmit power efficiently over long submarine cable runs. Second, grid interconnection: countries are building cross-border and cross-region links to balance renewable variability and trade electricity across wider markets and pooled reserves. Third, ultra-high-voltage domestic transmission, led by China, moving bulk power from remote generation to distant demand centres nationally.
The bull case at 11.1% assumes offshore wind buildout continues at its recent pace and converter manufacturing capacity expands fast enough to clear the current project backlog. The bear case at 8.5% assumes offshore wind permitting delays and grid interconnection queue congestion slow project timelines, and that converter manufacturing capacity constraints persist well beyond what current expansion plans currently address.

Why Converter Capacity Now Gates Grid Connection Speed

Three forces set demand. Offshore wind connection provides the fastest-growing layer, since wind farms sited far from shore require HVDC to transmit power efficiently over long submarine runs that alternating current cannot serve economically. Grid interconnection provides a second layer, as countries build cross-border links to balance renewable variability and trade power across wider markets. Ultra-high-voltage domestic transmission provides a third, dominated by Chinese buildout moving bulk
MARKET CONCENTRATIONCR5: 58%Concentrated among manufacturers holding proven power electronics expertise
TYPICAL PROJECT LEAD TIME3 to 5 yearsTime from converter station order to commercial grid operation
OFFSHORE WIND END-USE SHAREAbout 34%Total converter station demand tied to offshore wind connection
CONDUCTOR COST SHARE28 to 38%Cable material cost within total submarine cable project cost
TOP PRODUCING COUNTRY SHAREChina: about 27%Global HVDC equipment manufacturing output concentrated in one region
CONVERTER STATION SERVICE LIFE30 to 40 yearsTypical operating life before major converter station overhaul
The commercial character is decided by converter manufacturing capacity rather than by project financing availability. A utility can secure permits and funding for an offshore wind link, but delivery depends entirely on booking converter station production slots at a qualified manufacturer, and that capacity now runs years behind confirmed project demand. That is why manufacturers with proven delivery track records command premium pricing that newer entrants cannot match regardless of technical capability.
The next decade turns on two things. Whether converter manufacturing capacity expands fast enough to clear the offshore wind and interconnection project backlog building across multiple regions simultaneously. And whether multi-terminal grid architecture, still technically immature relative to point-to-point links, matures fast enough to support the meshed direct current networks planners increasingly want to build.
"Everyone still talks about turbine supply chains when they discuss offshore wind delays. The turbines are usually fine. It's the converter station that takes three years to build and gates everything downstream of it, and almost nobody outside the industry understands that yet."
Director, Power Transmission Infrastructure Practice · MMA Energy / Power Transm

Market Trends

Converter Manufacturing Capacity Becomes The Binding Project Constraint

Qualified HVDC converter station manufacturing capacity has not expanded as fast as offshore wind and interconnection project awards, and developers increasingly book production slots years ahead of construction to secure delivery timing. Siemens Energy and Hitachi Energy have both announced capacity expansion, but new manufacturing lines take years to commission and qualify for utility-grade projects. This has shifted competitive advantage toward manufacturers with existing capacity and proven delivery history over newer entrants still building a project track record. Utilities increasingly treat converter station capacity reservation as seriously as transmission right-of-way acquisition, given how directly it now determines project completion dates.
Market Impact: Offshore wind reaches 34% of demand
Multi-Terminal Grid Architecture Moves From Concept To Deployment

Grid planners are increasingly designing HVDC links as multi-terminal networks rather than simple point-to-point connections, allowing power to flow flexibly between three or more converter stations rather than a single fixed route. This architecture suits offshore wind zones with multiple connection points and enables genuine meshed direct current grids that can reroute power around congestion or outages. Technical standardisation across manufacturers remains incomplete, since multi-terminal systems require converter stations from different vendors to interoperate reliably, a capability the industry is still working through. Early North Sea projects are providing operating data that will determine how quickly this architecture scales.
Market Impact: Interconnection capacity grows near

Market Opportunities and Growth Drivers

Offshore Wind Zones Require HVDC For Economic Long-Distance Transmission

Offshore wind farms sited far from shore lose substantial power to resistance when connected using alternating current cables beyond a certain distance, making HVDC the only economically viable option once a wind zone sits more than roughly 80 kilometres offshore. European offshore wind capacity is increasingly sited in deeper, more distant waters as near-shore sites become fully developed, pulling HVDC demand upward as a direct consequence of where new capacity must be built. This is a physical requirement rather than a preference, which means HVDC demand growth tracks offshore wind siting decisions almost mechanically across most major markets.
Market Impact: Capacity gaps delay projects 2 year

Cross-Border Interconnection Balances Renewable Variability At Scale

Countries with high renewable penetration increasingly need substantial cross-border transmission capacity to export surplus generation and import power during shortfalls, since domestic storage alone cannot economically balance variable wind and solar output at meaningful grid scale. European interconnection projects linking Britain, Scandinavia, and continental Europe have demonstrated the commercial value of this balancing capacity clearly enough that additional projects are now moving through planning across multiple corridors simultaneously. This driver differs meaningfully from offshore wind connection, since it serves grid stability and market trading rather than a single generation asset.
Market Impact: Single-vendor lock-in adds 12% cost

Market Restraints and Challenges

Converter Manufacturing Capacity Cannot Match Project Award Pace

Demand for HVDC converter stations has outrun the manufacturing capacity of the small number of qualified suppliers, and lead times of three to five years now determine how quickly an offshore wind or interconnection project can reach commercial operation. The root cause is that converter stations require specialised power electronics manufacturing and extensive testing that cannot be scaled as quickly as demand has grown, and qualification for utility-grade infrastructure takes considerably longer than for less critical applications. Commercially this delays revenue-generating grid connections regardless of how quickly generation assets are completed. Manufacturers respond with capacity expansion and long-term reservation agreements.
Market Impact: Lead times now run 5 years

Multi-Vendor Interoperability Remains Largely Technically Unresolved

Multi-terminal HVDC systems requiring converter stations from different manufacturers to interoperate reliably remain technically challenging, since each vendor's control systems and protection philosophy were originally designed around single-vendor point-to-point projects rather than mixed networks. The root cause is that the industry has not yet converged on shared technical standards comparable to those governing alternating current grid interconnection for decades. Commercially this pushes grid planners toward single-vendor multi-terminal projects, limiting competitive bidding and concentrating risk with one supplier. Manufacturers respond through industry working groups developing common protocols and phased proof projects.
Market Impact: Multi-terminal projects grow near 1
3 additional market trends, 4 additional growth drivers, and 3 additional restraints and challenges are covered in the full report. Contact sales@marketmindsadvisory.com to access the complete intelligence.

Segment CAGR and Growth Architecture

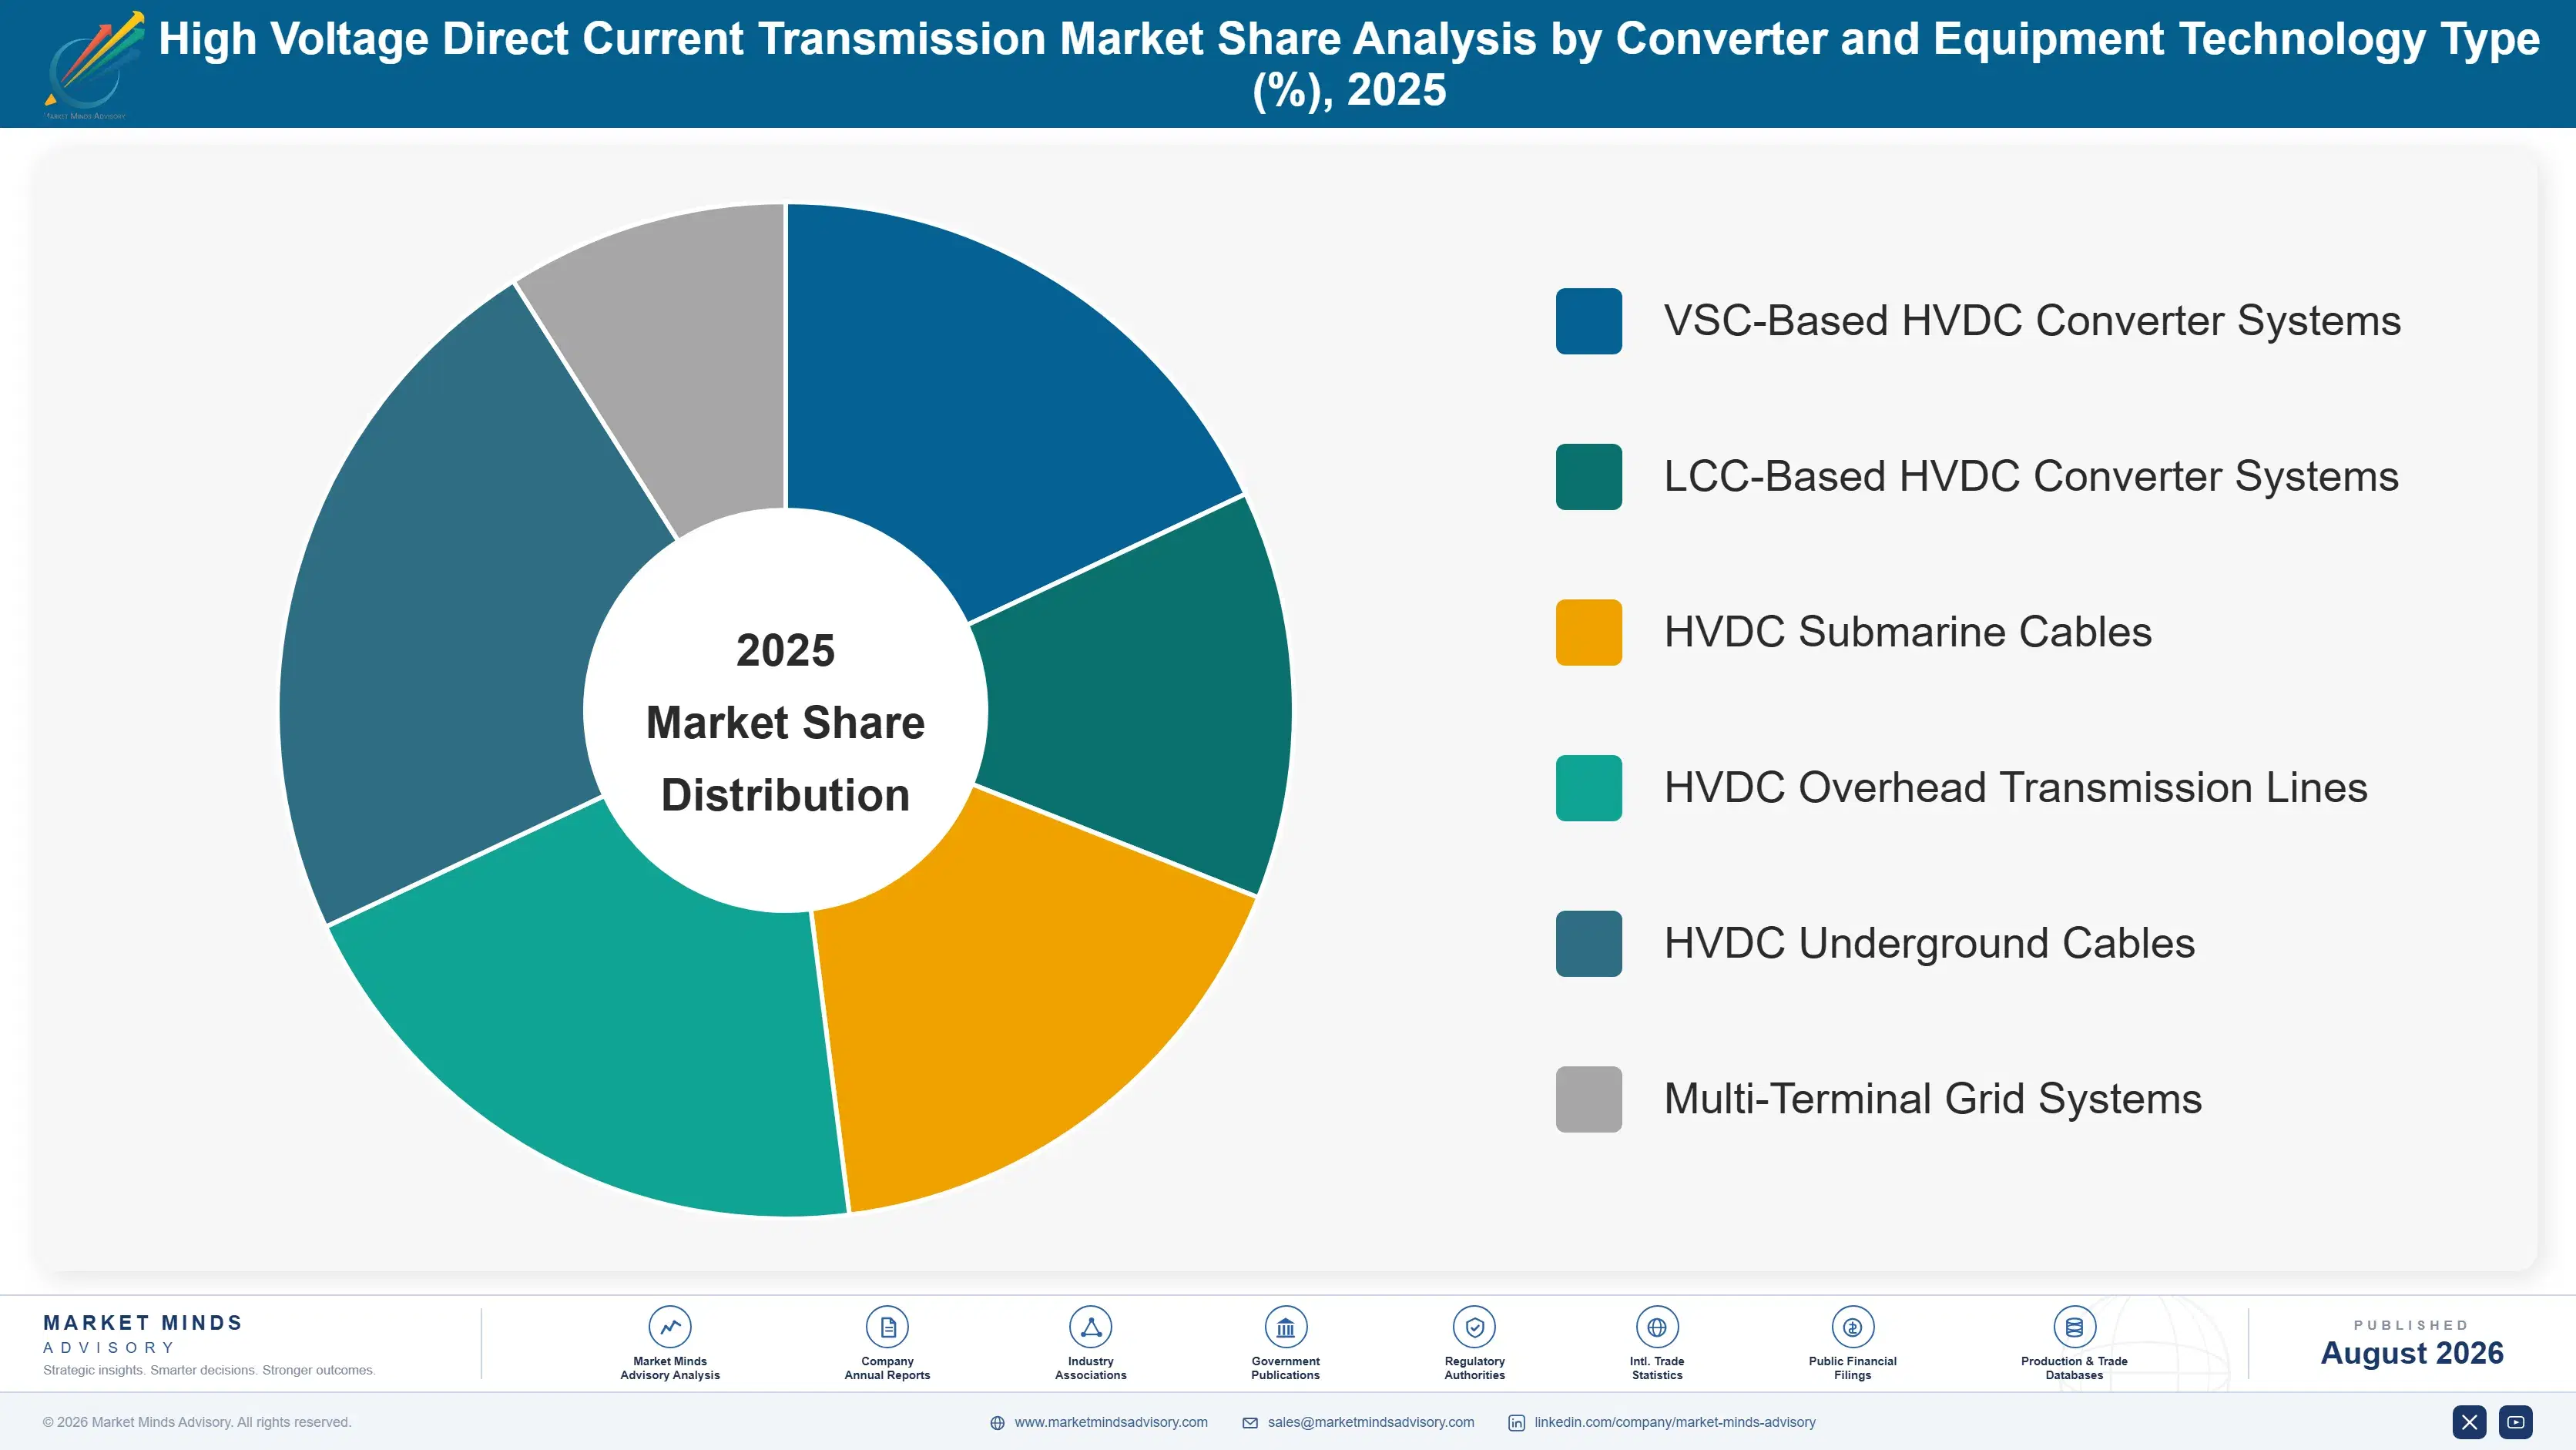
Segmentation follows converter and equipment technology type, a single classification logic describing the core power electronics architecture a project specifies from the outset. Cables, control systems, and services sit separately within the framework, since the same converter technology pairs with different cable and control combinations depending on project requirements, vendor choice, and site conditions.
high-voltage-direct-current-transmission-market-market-share-analysis-1787324341643

VSC-Based HVDC Converter Systems

VSC-based converter systems grow fastest at 14.6%, about 1.49 times the overall 9.8% rate, covering voltage source converter technology that offers independent reactive power control and black-start capability that older line-commutated designs cannot match. Offshore wind and multi-terminal grid projects increasingly specify VSC technology specifically, since it connects more readily to weak offshore grids and supports the flexible multi-terminal architecture planners increasingly want to build. Siemens Energy and Hitachi Energy hold the strongest positions, having invested earliest in VSC platform development while competitors remained focused on established line-commutated technology serving bulk power transmission applications. Converter manufacturing capacity, not project demand, is now the binding constraint on how fast this segment can actually convert additional wind zones to grid connection.
CAGR 14.6%

HVDC Submarine Cables

HVDC submarine cables grow at 12.8%, the second-fastest category, as offshore wind connection and cross-border interconnection projects both require long-distance underwater cable runs that alternating current technology cannot serve economically at comparable distances. Cable manufacturing and laying capacity has become nearly as constrained as converter station capacity, since specialised cable-laying vessels and manufacturing facilities require years of lead time to expand. Prysmian and Nexans hold strong positions, having built manufacturing scale and vessel fleets over decades of submarine cable experience that newer entrants cannot replicate quickly. Copper and conductor material costs represent a meaningful share of total project cost, adding commodity price exposure that further complicates project budgeting for developers planning multi-year construction timelines.
CAGR 12.8%
Full segment breakdown across 6 segments available in the complete report.

Regional Architecture and Country Demand Map

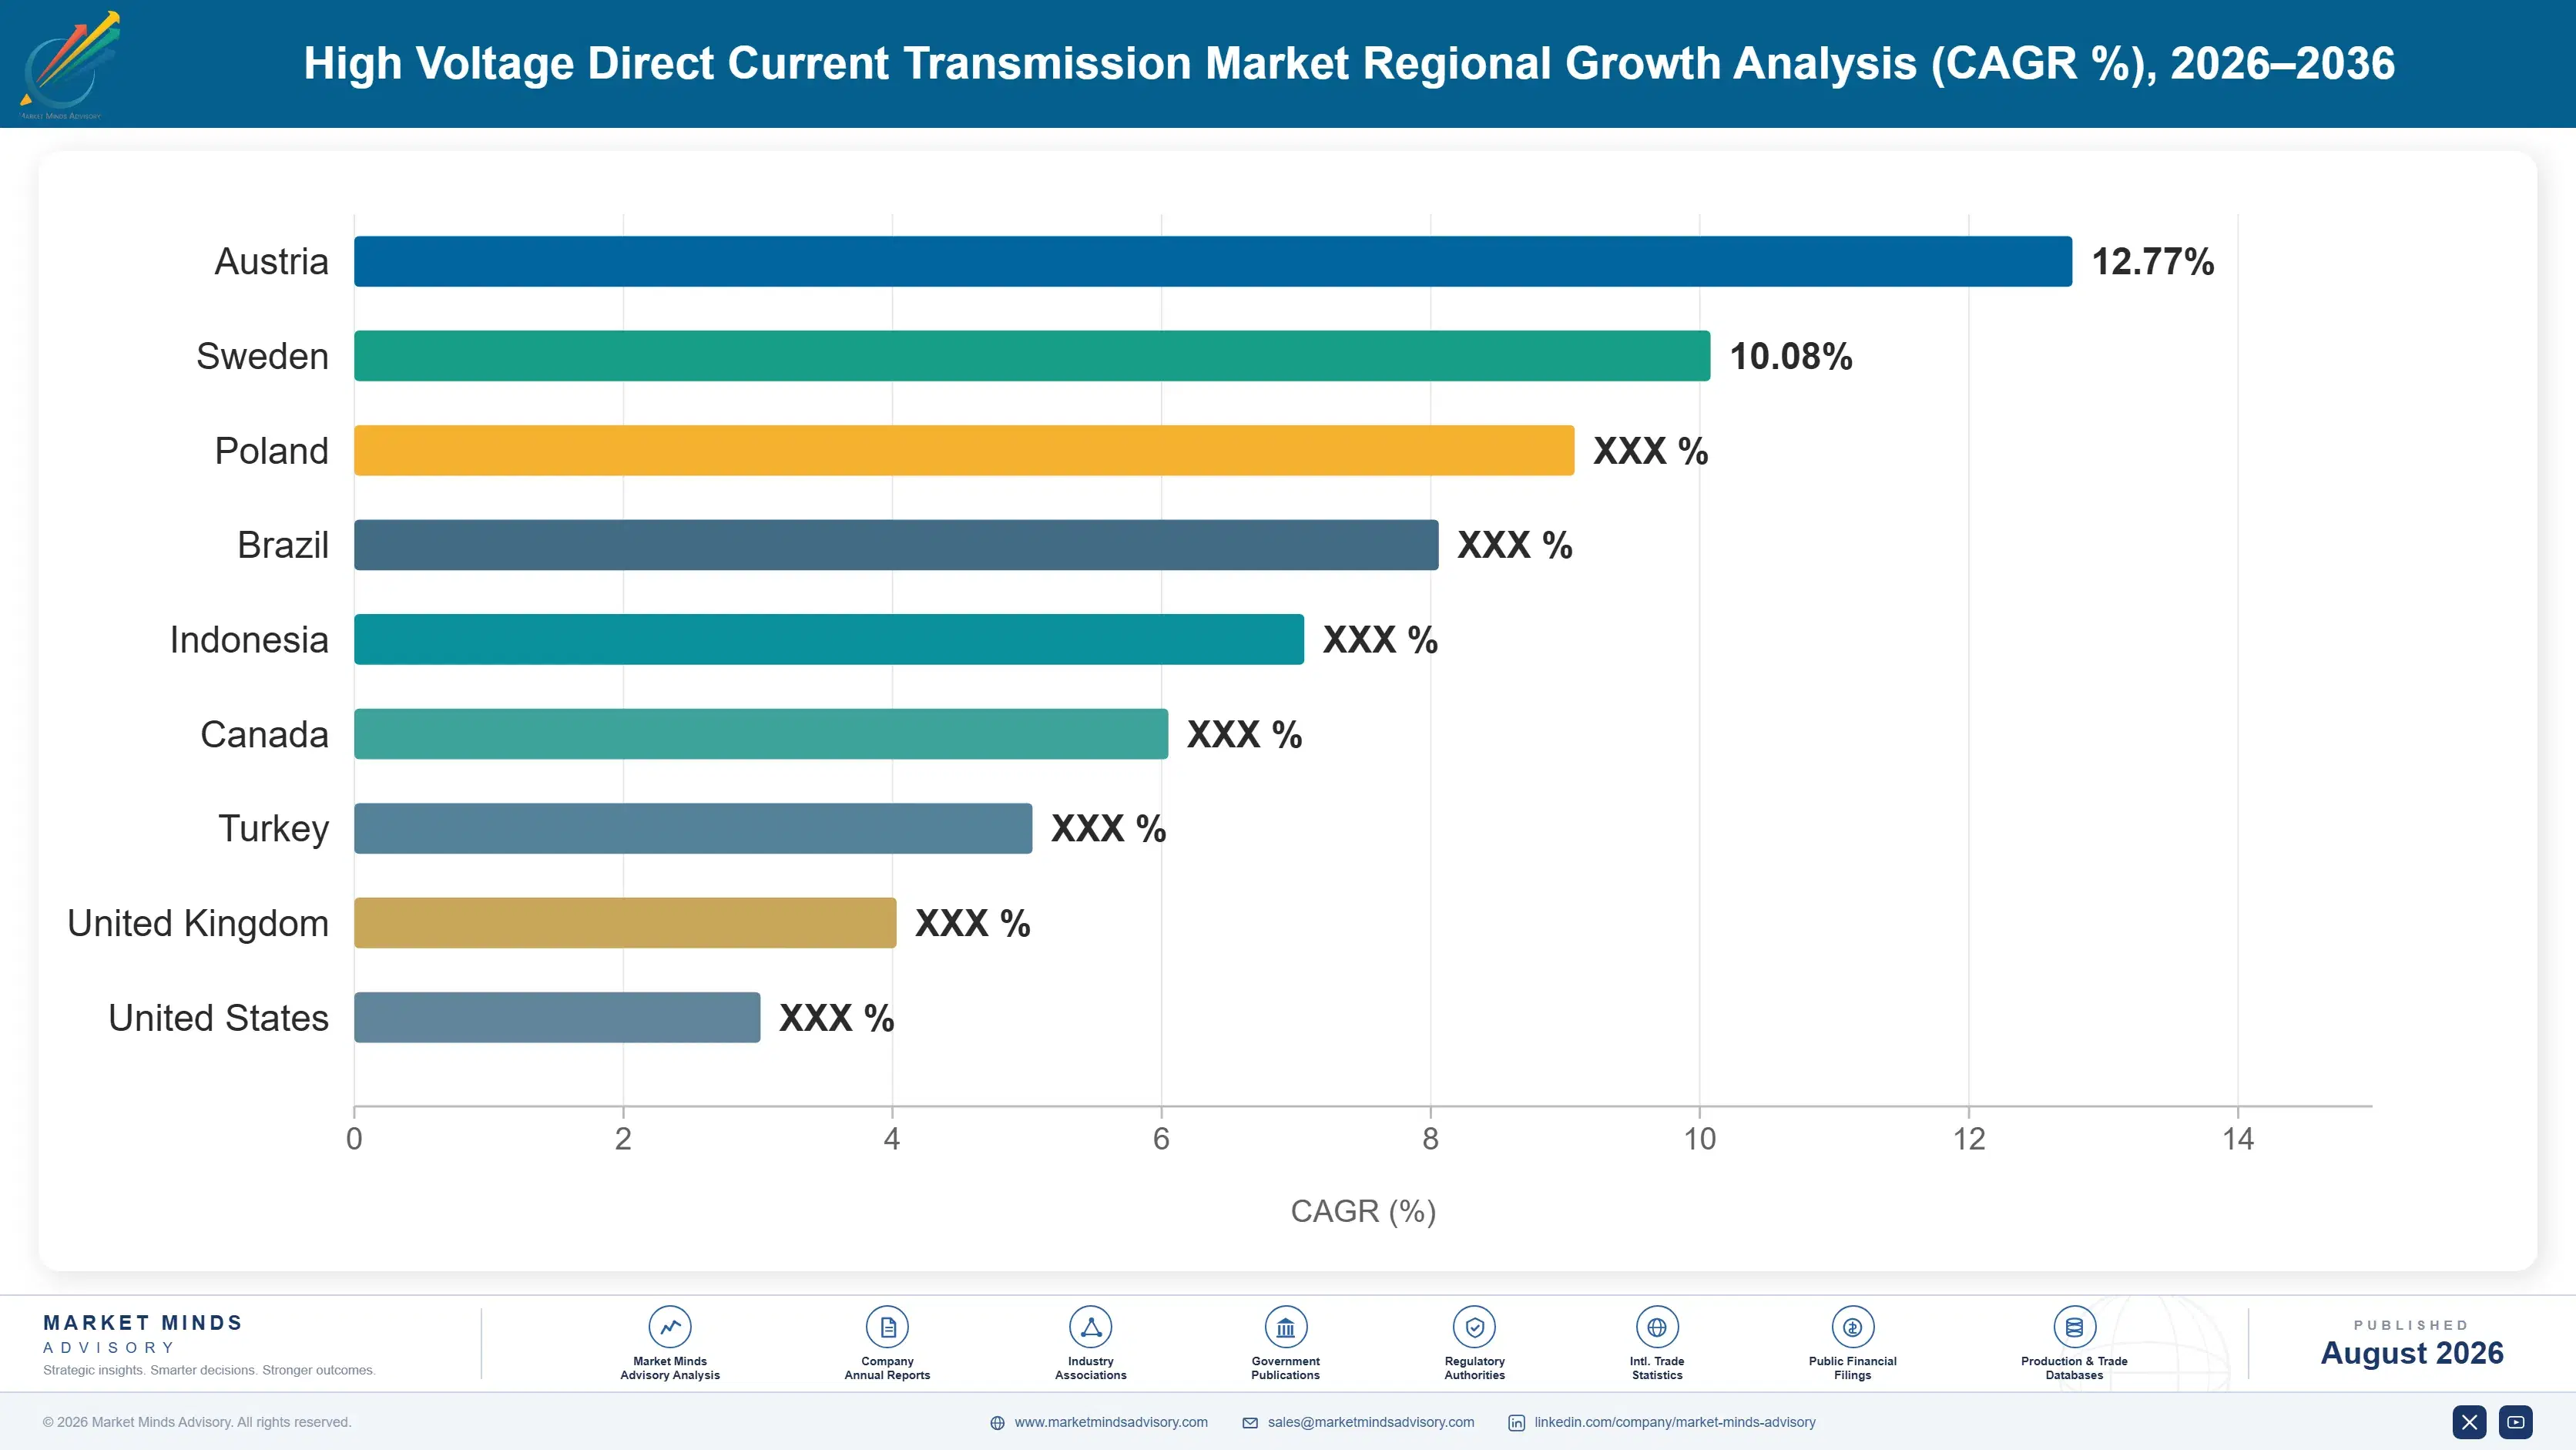
Domestic grid buildout scale and offshore wind ambition together set this overall distribution more than raw transmission demand alone ever could. East Asia leads on Chinese ultra-high-voltage grid investment, while the fastest growth sits in Western Europe under British and continental offshore wind interconnection specifically.

North America

Interconnection ambition, more than offshore wind scale so far, defines this 22% share. United States transmission planners are pursuing HVDC links to move renewable generation from resource-rich regions to distant demand centres, though permitting and multi-state coordination slow project timelines considerably. Canadian hydroelectric exports to the United States increasingly use HVDC for long-distance efficiency, building on decades of prior interconnection experience. East Coast offshore wind projects are beginning to specify HVDC as wind zones move further from shore, following the European pattern with several years of lag. Growth of 10.2% reflects both interconnection project maturation and emerging offshore wind demand together. Permitting reform increasingly determines how quickly this region's pipeline converts to completed projects.
Share: 22% | CAGR: 10.2% (2026 to 2036)

Western Europe

North Sea offshore wind ambition defines this 24% share more than any other factor currently. British, German, and Dutch offshore wind zones are increasingly sited far enough from shore that HVDC connection is now the default for new capacity. Cross-border interconnection projects linking Britain, Scandinavia, and continental Europe have proven the commercial and grid stability value of HVDC beyond offshore wind connection. Converter manufacturing capacity constrained by strong regional demand has pushed some developers toward longer lead times than planned. Growth of 8.4% reflects a mature but still rapidly expanding offshore wind and interconnection pipeline. Manufacturing capacity, not site availability, increasingly caps how fast this region's pipeline converts to completed connections.
Share: 24% | CAGR: 8.4% (2026 to 2036)
Regional intelligence for 5 additional markets available in the complete report: East Asia, South Asia and Pacific, Latin America, Middle East and Africa, Eastern Europe. Contact sales@marketmindsadvisory.com.
high-voltage-direct-current-transmission-market-country-cagr-analysis-1787324342209

Where HVDC Equipment Suppliers Actually Capture Value

Competing on converter price alone means competing against a capacity-constrained market where delivery timing matters more than unit cost across nearly every major project category and region currently. The four moves below shift value toward positions a price-only competitor cannot simply match: capacity reservation contracts, VSC platform leadership, multi-terminal interoperability, and submarine cable manufacturing scale.

Sell Long-Term Converter Capacity Reservation Contracts

Converter station lead times of 3 to 5 years have made manufacturing capacity itself a strategic asset, and suppliers offering developers multi-year capacity reservation contracts capture demand certainty that project-by-project bidding never reliably provides. Developers increasingly compete for position in manufacturer production queues years ahead of construction, which means securing reservation agreements early locks in customer relationships before a project even completes permitting or financing. This model shifts suppliers from transactional equipment sales toward planning partnerships considerably harder for capacity-constrained competitors to displace once a project timeline depends on it.
Market Impact: Lead times of 3 to 5 years reward e

Lead On VSC Platform Development For Offshore Wind

VSC-based converter systems grow at 14.6% against an overall market at 9.8%, and suppliers with proven VSC platform track records win offshore wind specification contests that competitors still primarily focused on line-commutated technology cannot match. VSC technology's independent reactive power control and black-start capability increasingly matter more to offshore wind developers than raw transmission capacity alone, since weak offshore grids require exactly the flexibility VSC provides. Suppliers should prioritise VSC platform investment over incremental line-commutated technology improvement, since offshore wind demand growth concentrates overwhelmingly in the segment VSC technology serves.
Market Impact: VSC systems grow 14.6% versus 9.8%

Build Multi-Terminal Interoperability Reference Projects Now

Multi-terminal HVDC systems requiring converter stations from different manufacturers to interoperate reliably remain technically unresolved industry-wide, and suppliers that build credible reference projects demonstrating interoperability win specification consideration for future multi-terminal programmes that competitors without comparable references cannot access. This investment requires collaboration with competitors and grid operators that some suppliers resist, but the alternative is being excluded from an architecture grid planners increasingly prefer for offshore wind zones with multiple connection points. Early movers on interoperability demonstration are positioning to capture disproportionate share as multi-terminal projects, growing near 19% yearly, scale beyond pilot deployments.
Market Impact: Multi-terminal project demand grows

Scale Submarine Cable Manufacturing And Vessel Capacity

Submarine cable manufacturing and laying capacity has become nearly as constrained as converter station capacity, and suppliers with established manufacturing scale and cable-laying vessel fleets capture project awards that capacity-constrained competitors simply cannot bid on within required timelines. Building this capacity requires 3 to 5 years of lead time and substantial capital investment, which is precisely why only a small number of suppliers hold genuine scale advantage in this specific category. Suppliers investing in vessel fleet expansion now are positioning for a cable demand curve that offshore wind and interconnection growth are pulling upward faster than most manufacturing plans anticipate.
Market Impact: Cable capacity lags demand by 2 to

Who Controls the Margin Pool

Concentration sits at CR5 of 58%, with Siemens Energy, Hitachi Energy, GE Vernova, Prysmian, and Nexans holding leading positions built on decades of power electronics and submarine cable expertise. The gap between leaders and challengers rests on project delivery track record and manufacturing capacity rather than technical design alone. Participants are assessed on one basis, annual revenue from HVDC equipment and directly attached engineering services, excluding alternating current transmissi
Competition runs along three dimensions. First, converter manufacturing capacity, the binding constraint that increasingly decides which suppliers can accept new project commitments at all. Second, VSC platform maturity, particularly for offshore wind projects requiring independent reactive power control. Third, submarine cable manufacturing and vessel capacity, which gates project delivery as much as converter capacity does.

Pressure is building from Chinese manufacturers including NR Electric and XD Electric, which have moved from domestic-only suppliers toward credible export competitors challenging Western incumbents on price and capability. Meanwhile cable specialists are racing to expand manufacturing and vessel capacity ahead of offshore wind demand outpacing prior planning assumptions. Rankings should favour suppliers with secured capacity and proven VSC delivery history over those demonstrating capability through pilot projects.
high-voltage-direct-current-transmission-market-company-positioning-matrix-1787324342774

Competitive Moat and Risk Dimensions

SIEMENS ENERGY

Moat: VSC platform leadership and scale

Siemens Energy holds one of the deepest VSC converter platform track records in the industry, built across multiple generations of offshore wind and interconnection projects competitors work to match. Its broader power transmission portfolio supports integrated delivery that standalone converter suppliers cannot offer as completely. Established manufacturing capacity and delivery relationships with major offshore wind developers provide durable demand visibility.
SIEMENS ENERGY

Risk: Capacity constraints limit near-term growth

Even Siemens Energy's substantial manufacturing capacity has not fully closed the gap between offshore wind demand and available converter production slots, capping near-term revenue growth regardless of order book strength. Chinese manufacturers are narrowing the technology gap faster than expected in less demanding applications. Multi-terminal interoperability requirements increasingly require collaboration with competitors that complicates a purely proprietary platform strategy.
HITACHI ENERGY

Moat: Global installed base reach

Hitachi Energy, built on the former ABB power grids business, holds an extensive global installed base spanning decades of HVDC projects across major regions, providing service revenue newer entrants cannot access. Its established relationships with utilities and grid operators worldwide support a broad project pipeline across offshore wind and interconnection categories. Deep engineering expertise serves the full range of requirements.
HITACHI ENERGY

Risk: Integration and capacity investment lag

Post-acquisition integration following the ABB transaction has absorbed management attention that focused competitors directed fully at commercial execution and capacity expansion. Capacity investment has not kept pace with offshore wind demand growth as aggressively as some competitors pursued, risking share loss on the fastest-growing VSC segment. Chinese manufacturers are winning share in less differentiated categories where positioning matters less.

Players Tracked

Prominent Players

Siemens Energy
Hitachi Energy
GE Vernova
Prysmian
Nexans

Other Key Players

NR Electric
XD Electric
State Grid Corporation of China
Sumitomo Electric
LS Cable and System
TBEA
C-EPRI Electric Power Engineering
RXPE
Toshiba Energy Systems
Mitsubishi Electric
NKT
Fujikura
ZTT
Hyosung Heavy Industries
Baosheng Science and Technology

Recent Developments

MARCH 2025

Siemens Energy expands VSC converter manufacturing capacity

Siemens Energy announced a capacity expansion at an existing facility dedicated to VSC converter station production, aiming to meet offshore wind demand that had outrun prior planning assumptions. This was an organic expansion rather than an acquisition or joint venture, adding lines qualified for utility-grade offshore wind projects.
Signal: Manufacturers are sizing capacity investme
OCTOBER 2024

Prysmian completes acquisition of submarine cable manufacturer

Prysmian completed the acquisition of a specialist submarine cable manufacturer, adding production capacity and a cable-laying vessel to its fleet in a category facing acute capacity constraints industry-wide. This was a full acquisition bringing manufacturing and vessel capability directly in-house, not a charter or licensing arrangement with the target company.
Signal: Bringing vessel capacity in-house signals
MAY 2025

Hitachi Energy signs multi-terminal interoperability agreement

Hitachi Energy signed a technical interoperability agreement with a competing converter manufacturer to develop shared protocols for multi-terminal HVDC systems combining equipment from both suppliers. This was a technical collaboration agreement rather than a joint venture or acquisition, formalising cooperation on a specific multi-terminal reference project.
Signal: Competitors are cooperating on interoperab

Power Electronics, Copper, And Vessel Logistics

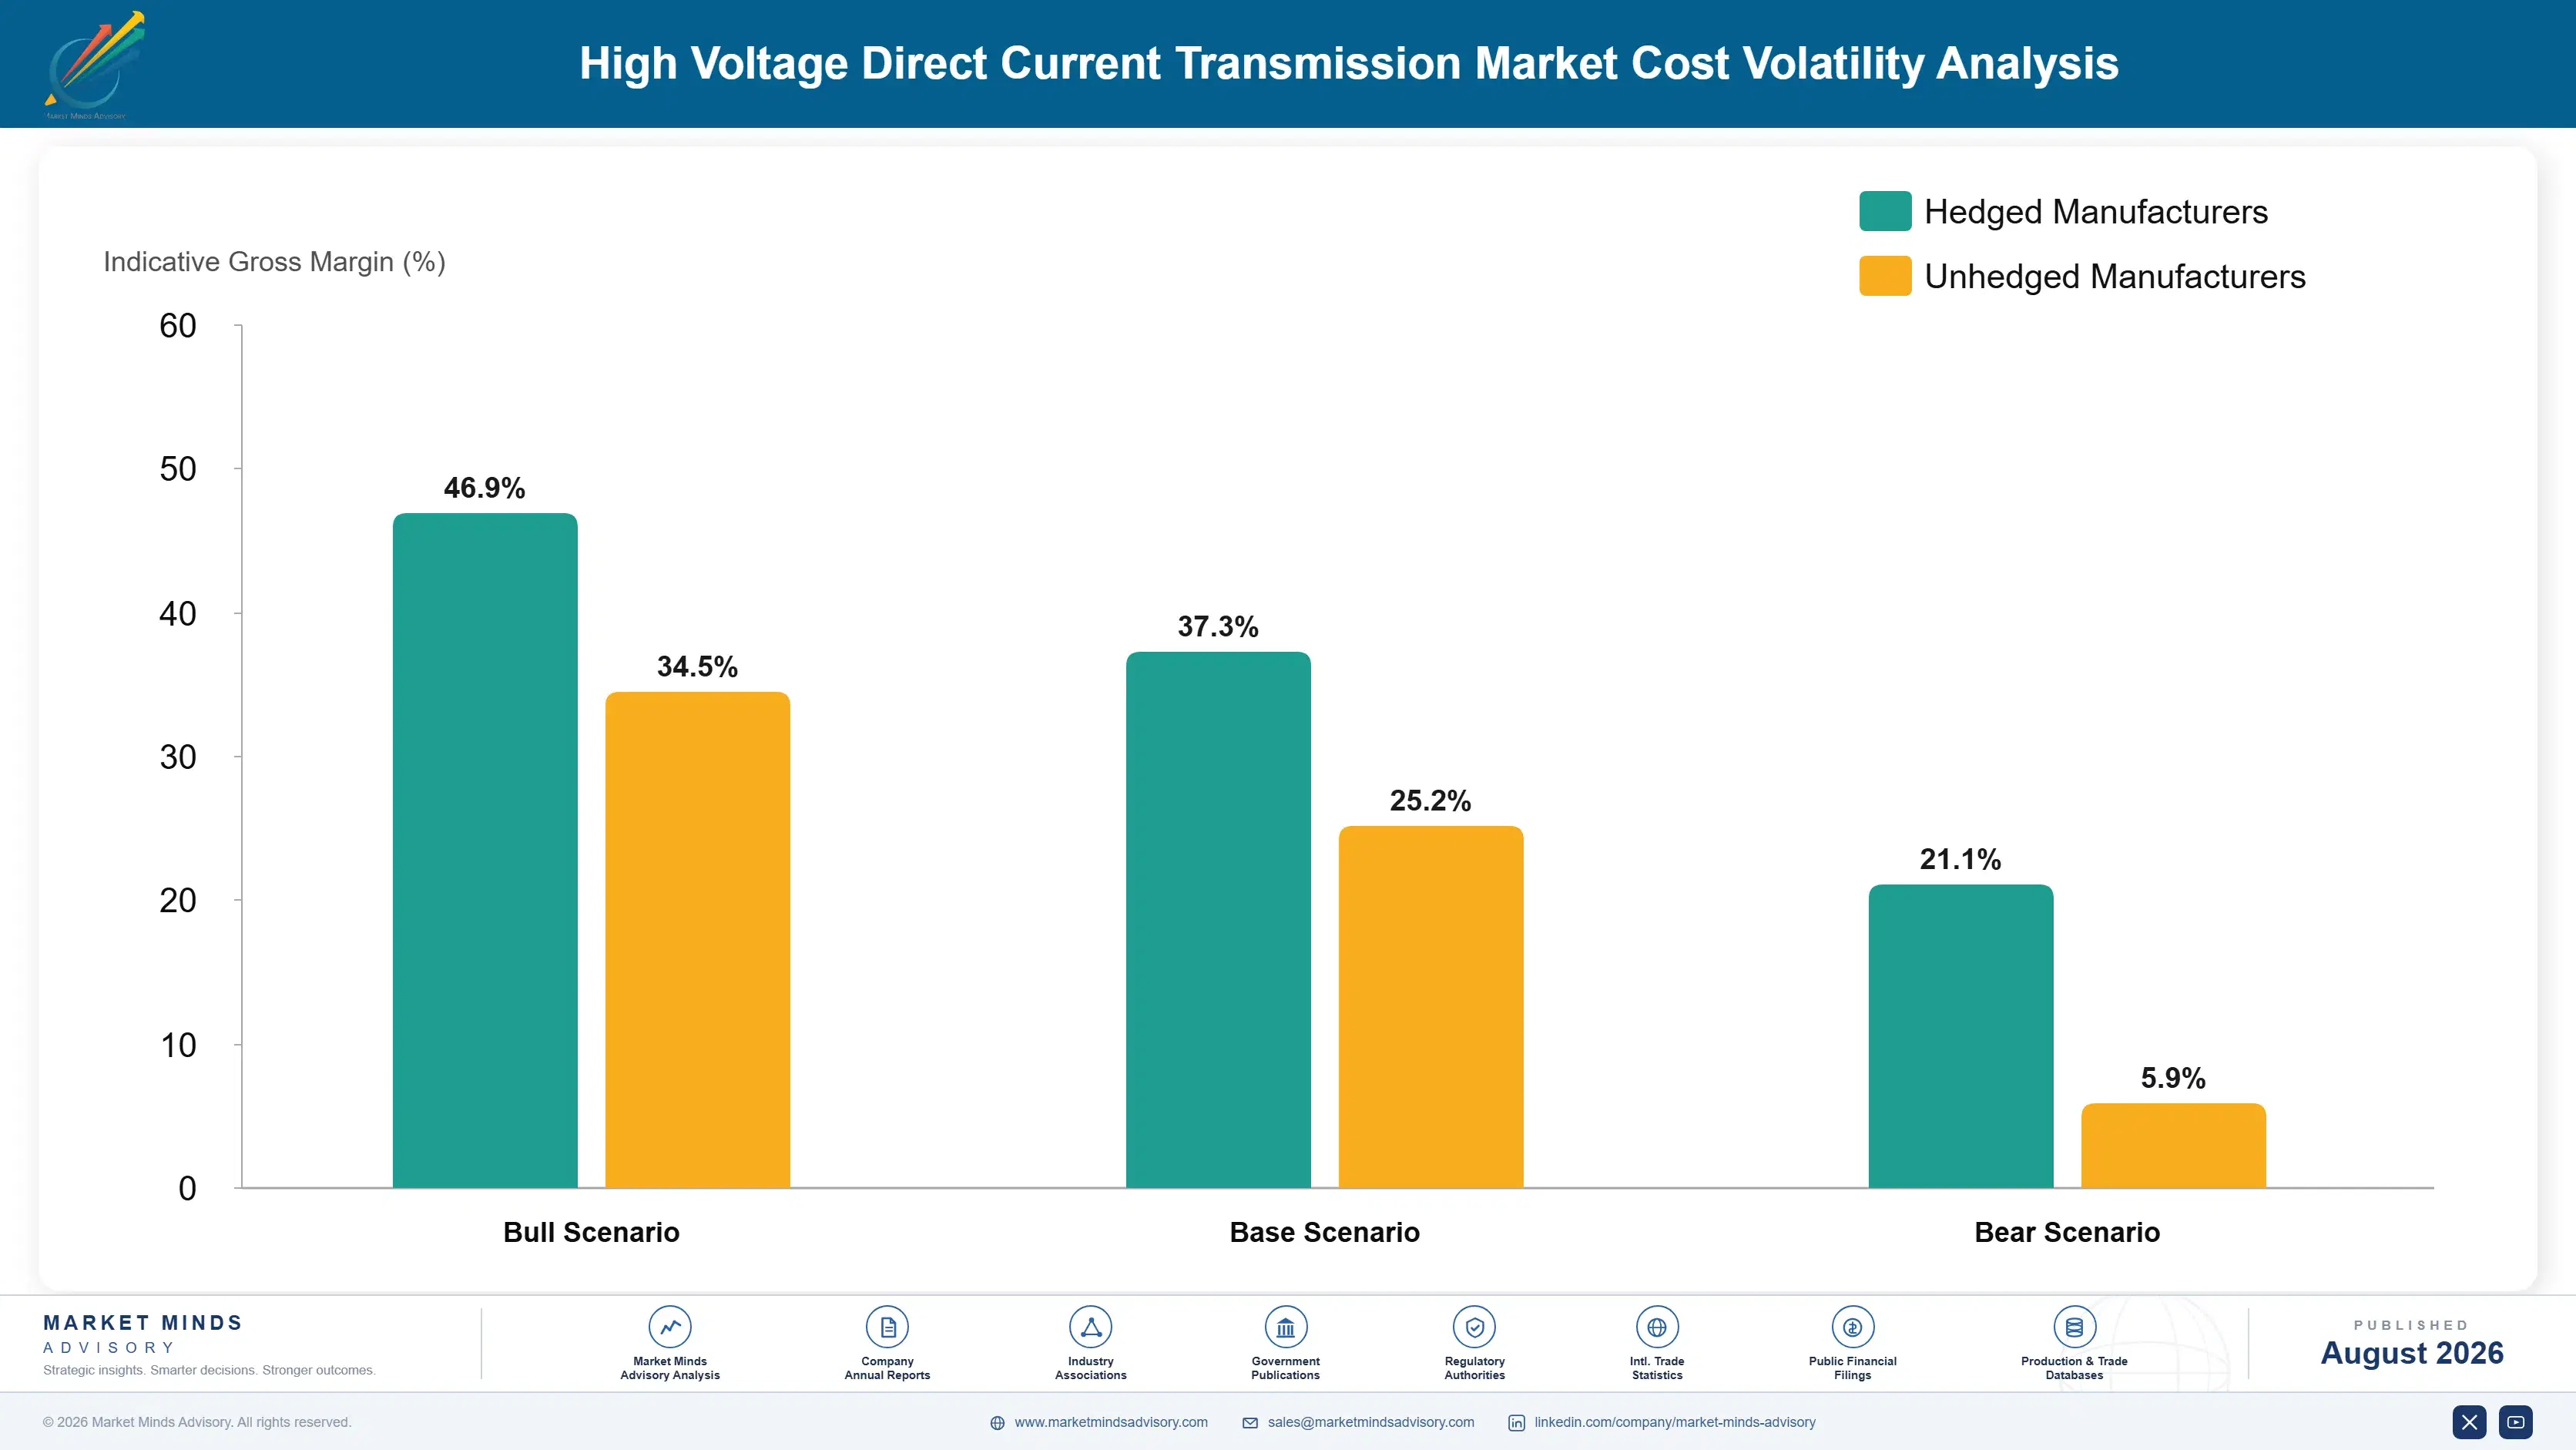
Power electronics components dominate converter station cost in this category. Semiconductor modules, transformers, and control systems account for roughly 40% to 52% of cost of goods sold, reflecting the precision manufacturing these components require. Copper and conductor materials for cables add a further 28% to 38% of cable project cost, while installation and vessel logistics account for 12% to 20% and can rise considerably for remote offshore projects.
Copper price volatility has been the sharpest recent pressure on cable projects specifically. Copper prices moved considerably through 2021 and 2022 amid global supply constraints, before easing through 2023 and 2024 as mining output expanded, according to IEA critical minerals and electricity grid reporting. Cable manufacturers absorbed meaningful margin pressure during the volatile period since long-term contracts could not adjust as quickly as copper prices moved.

Exposure separates by vertical integration and contract structure. A manufacturer dependent on spot copper purchasing faces cost risk that one with long-term contracts or hedging programmes simply does not carry, while a supplier owning cable-laying vessels controls installation cost and scheduling that charter-dependent competitors cannot match. Companies with broader sourcing and owned vessel capacity weather both material and logistics volatility better than narrowly positioned competitors.
high-voltage-direct-current-transmission-market-cost-volatility-analysis-1787324342999

Hedge copper exposure on long-term project contracts

Spot copper pricing exposes manufacturers to commodity volatility that multi-year project contracts cannot pass through as quickly as prices actually move. Financial hedging and long-term supplier contracts protect margin through demand surges better than spot purchasing ever can on projects spanning several years. Manufacturers with established hedging programmes weathered the recent volatile period considerably better than competitors without comparable protection.

Invest in owned cable-laying vessel capacity

Chartering cable-laying vessels exposes suppliers to availability and cost risk during exactly the periods when offshore wind demand is strongest and vessel capacity tightest. Owned vessel capacity controls scheduling and cost through demand cycles that charter-dependent competitors cannot match reliably. The capital requirement is substantial, which is precisely why only the largest cable manufacturers have pursued full ownership.

Diversify power electronics component sourcing globally

Relying on a narrow semiconductor and component supplier base concentrates both price and availability risk exactly when converter demand is strongest and component supply tightest. Qualifying multiple component suppliers across regions preserves negotiating leverage and supply continuity during disruption. Manufacturers that started diversifying component sourcing early now hold a genuine advantage over competitors still narrowly sourced.

Portfolio Architecture for Margin Defence

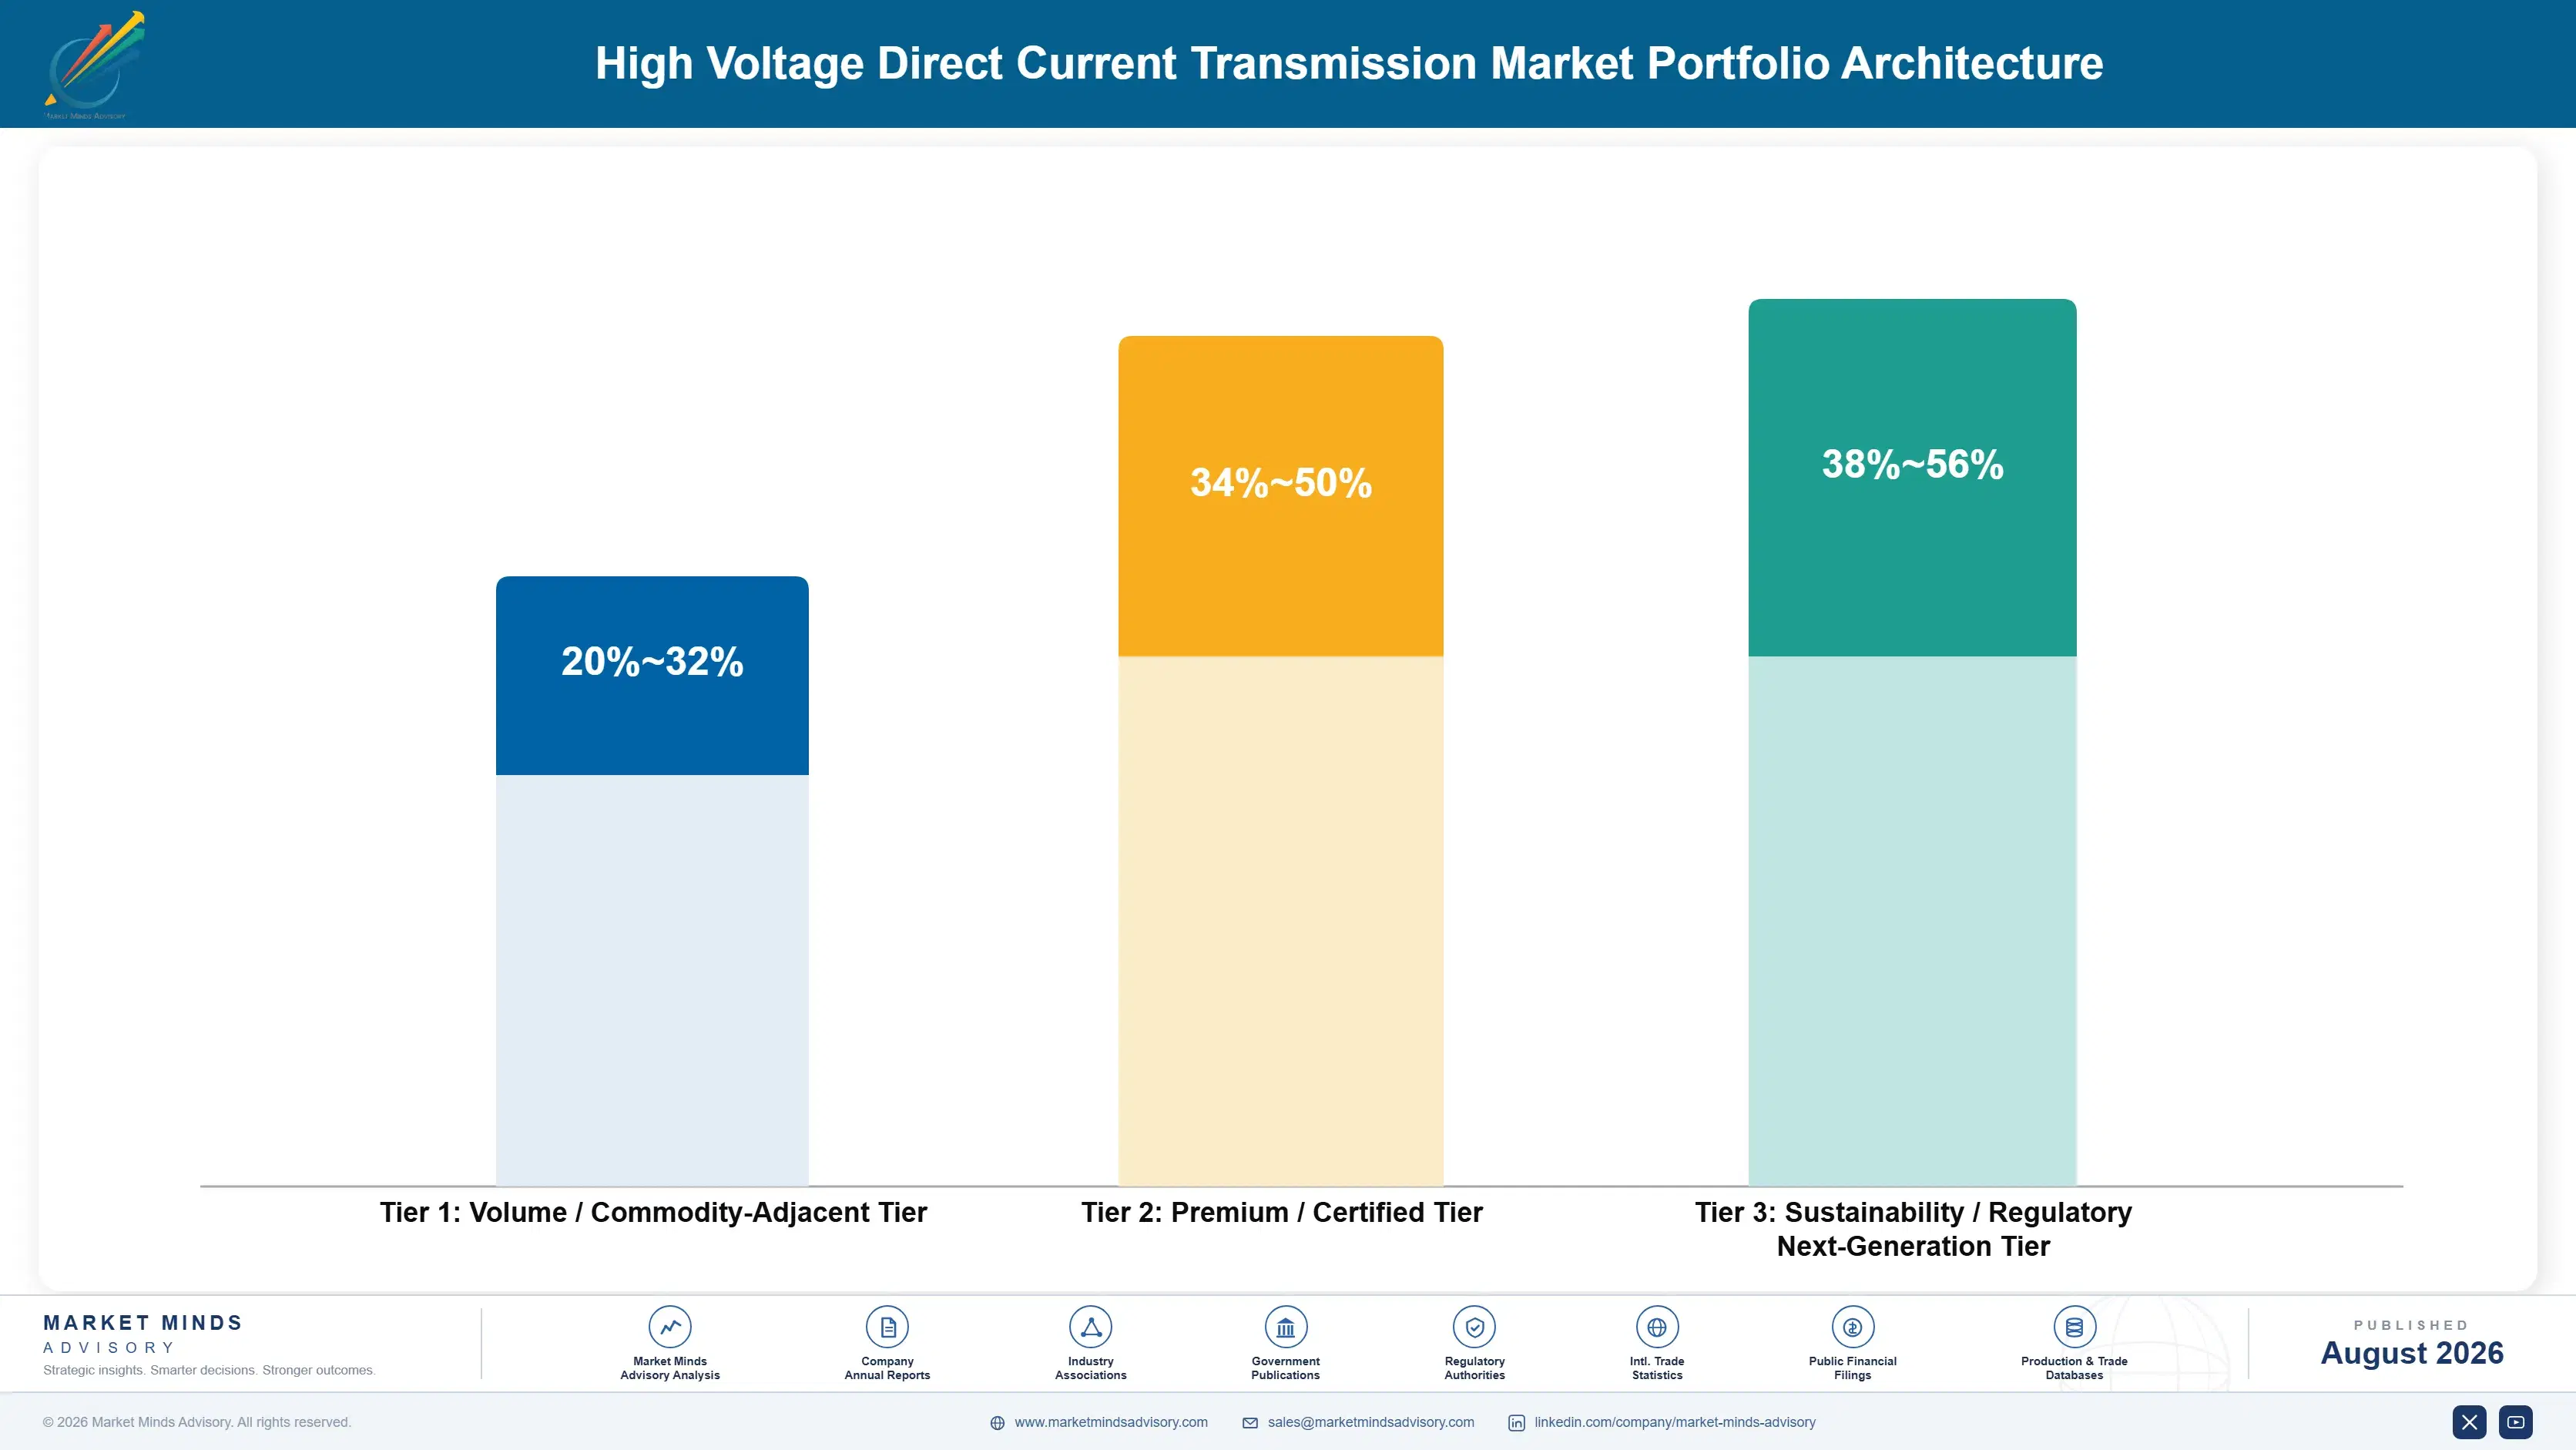
The portfolio splits into three tiers with distinct economics. Standard line-commutated converter equipment and conventional cables form the volume tier, competing on price against a widening field of qualified suppliers including Chinese manufacturers. VSC-based systems and submarine cables with proven delivery track records earn considerably more, since manufacturing capacity constraints and technical qualification barriers both resist commoditisation. Multi-terminal systems sit differently ag
The tension runs between defending line-commutated equipment volume, which still funds much of the business today for several major suppliers, and investing in VSC and multi-terminal capability that increasingly drives growth. Suppliers over-indexed on legacy technology risk missing the offshore wind transition that has already reshaped where capital flows industry-wide. Yet building VSC and cable manufacturing capacity requires sustained investment that legacy margins alone do not always fund.

High-value pools concentrate where manufacturing capacity, technical qualification, or interoperability leadership limit competition: VSC converter capacity reserved under long-term contract, submarine cable manufacturing with owned vessel fleets, and multi-terminal reference projects demonstrating cross-vendor interoperability. All three resist price competition that standard equipment increasingly faces from a widening field. Commodity-adjacent conventional equipment sold on price alone sits at the other end.

Volume / Commodity-Adjacent Tier

Standard line-commutated converter equipment and conventional cables sold largely on price against a widening field of qualified suppliers including increasingly capable Chinese manufacturers competing closely on cost and delivery speed.
Gross Margin: 20-32%

Premium / Certified Tier

VSC-based converter systems and submarine cables with proven delivery track records, where manufacturing capacity and technical qualification command sustained pricing power that unproven entrants simply cannot match at any comparable price point.
Gross Margin: 34-50%

Sustainability / Regulatory / Next-Generation Tier

Multi-terminal grid systems and interoperability solutions sold with demonstrated cross-vendor compatibility and technical leadership positioning for future grid architecture that competitors have not yet replicated at comparable scale industry-wide today.
Gross Margin: 38-56%
high-voltage-direct-current-transmission-market-portfolio-architecture-1787324343547

High-value Sub-segments and Strategic Watch-out

VSC-Based HVDC Converter Systems

High value and high growth at 14.6%, the fastest category, as offshore wind and multi-terminal projects favour voltage source technology for its flexibility and weak-grid connection capability across most producing regions. Converter manufacturing capacity, not project demand, is now the binding growth constraint across most major markets.
Gross Margin: 36-52%

HVDC Submarine Cables

High value with strong growth at 12.8% as offshore wind and interconnection projects both require long-distance underwater cable runs alternating current cannot serve economically across most producing regions worldwide today. Cable manufacturing and vessel capacity constraints increasingly mirror the converter station bottleneck across the industry.
Gross Margin: 32-46%

HVDC Overhead Transmission Lines

The volume core by revenue, growing moderately as ultra-high-voltage domestic transmission continues expanding in China and other large countries moving bulk power across long distances nationwide and internationally today still. Competition on price is most intense in this established category specifically across most established markets.
Gross Margin: 22-34%

HVDC Underground Cables

The strategic watch-out, growing slowest as most new capacity favours submarine or overhead routes where terrain and permitting allow it, limiting underground cable use to specific urban or environmentally sensitive corridors nationally today. Standalone underground demand remains a narrow niche overall across most established markets.
Gross Margin: 24-36%

How Supplier Relationships Actually Persist

Revenue depends on supplier relationships persisting across a converter station's multi-decade life, and once a utility selects a manufacturer, switching suppliers mid-programme carries technical and schedule risk that protects the incumbent. Service and upgrade contracts, tied to the original supplier, generate income across the full operating life while the initial sale is paid for once. A small number of large utilities and offshore wind developers drive disproportionate order volume.
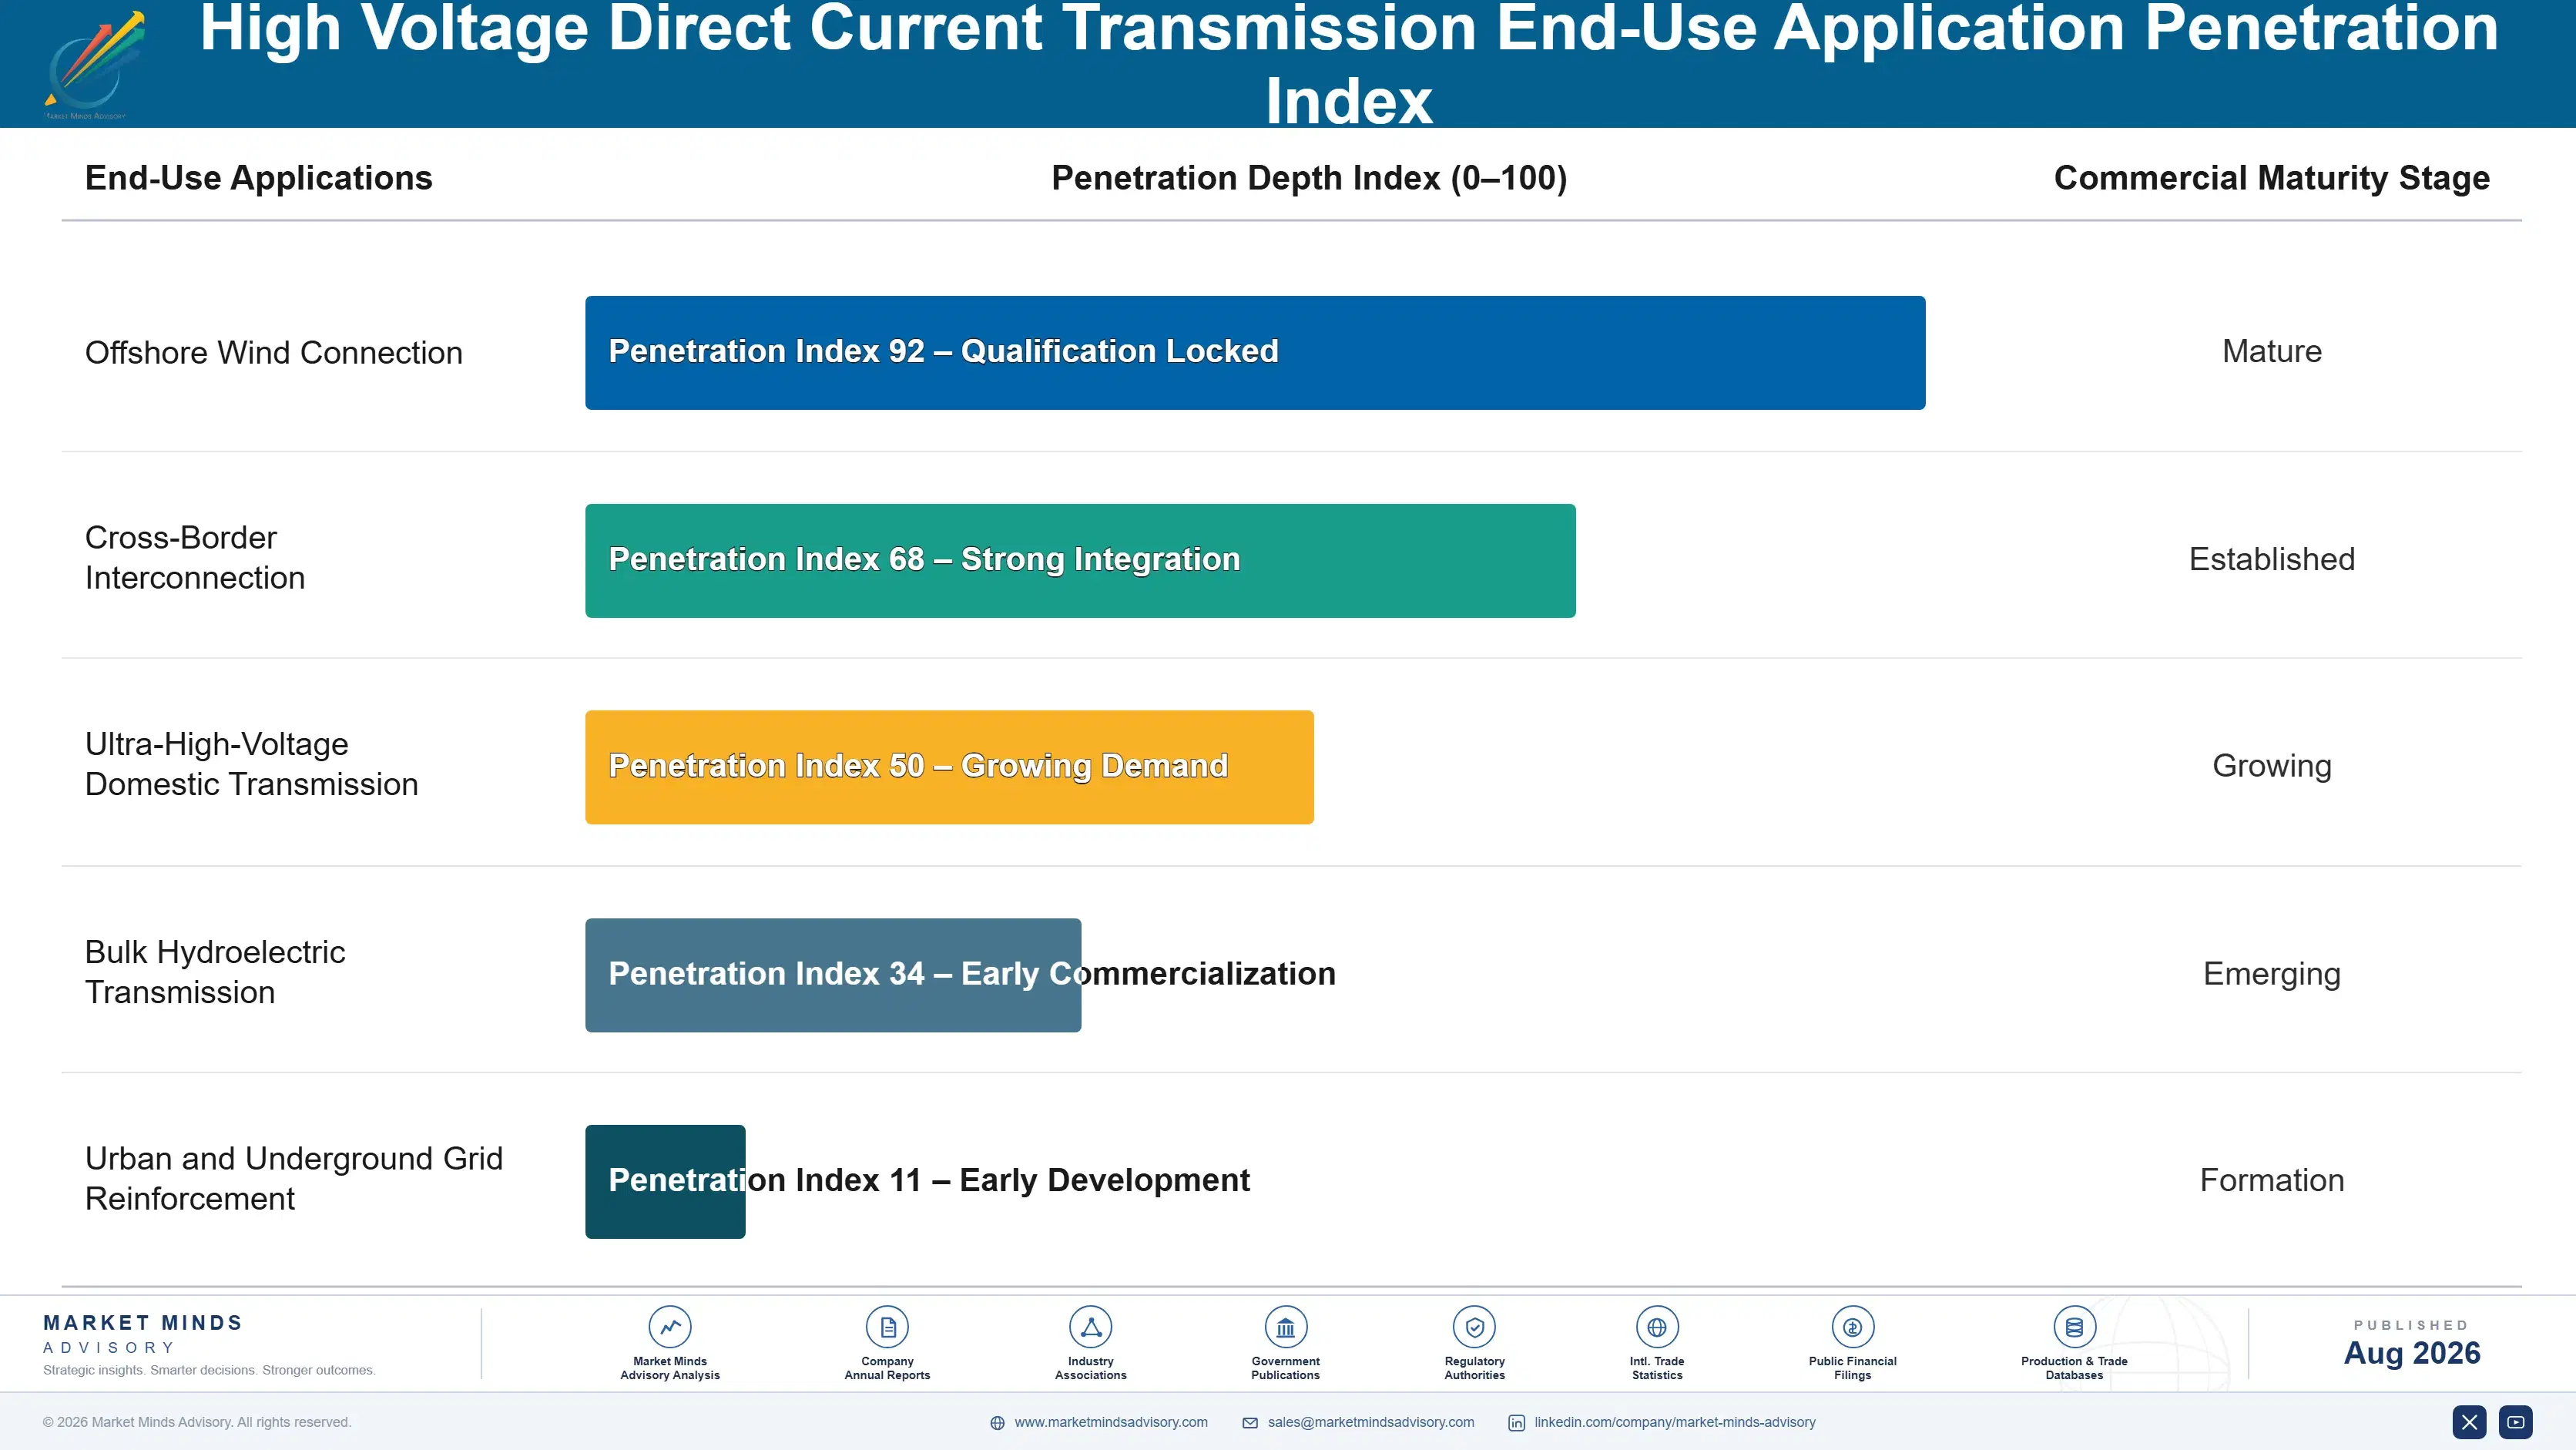
Adoption depth varies sharply by application. Offshore wind connection adopts deepest, since HVDC is a physical requirement rather than a choice once a wind zone sits far enough from shore. Cross-border interconnection adopts steadily, driven by grid stability and renewable balancing needs. Domestic ultra-high-voltage transmission adopts most selectively, concentrated in a small number of large countries with the geography to justify it.

Buyer profiles have shifted from national utilities alone toward offshore wind developers and grid operators who evaluate supplier relationships against multi-year capacity planning rather than single-project procurement. Procurement increasingly runs years ahead of construction to secure manufacturing slots, a planning horizon utility procurement rarely required historically. Younger grid engineers also treat VSC and multi-terminal architecture as the default consideration rather than a novel exception requiring justification.
high-voltage-direct-current-transmission-market-end-use-penetration-index-1787324344066

Our Call On HVDC Transmission

These are among the four positions where our research anticipates prominent divergence between winners and laggards over the coming forecast period. Each is grounded in the demand model, the regulatory perimeter, and the announced capacity pipeline.
01 / CONVERTER CAPACITY GATES GROWTH

Manufacturing slots now matter more than project financing

Converter station lead times of three to five years now determine how quickly an offshore wind or interconnection project can reach commercial operation, and developers increasingly book production slots years ahead of construction to secure delivery timing. This is a genuine capacity bottleneck rather than a temporary shortage, since qualified power electronics manufacturing cannot expand as quickly as demand has grown across multiple regions. Suppliers and developers should treat converter capacity as a strategic asset worth securing years ahead of need, since the queue decides completion dates more than financing.
02 / VSC TECHNOLOGY LEADS GROWTH

Offshore wind demand concentrates in flexible converter technology

VSC-based converter systems grow at 14.6% against an overall market at 9.8%, because offshore wind and multi-terminal projects require the independent reactive power control and weak-grid connection capability that older line-commutated technology cannot provide. Suppliers with proven VSC platform track records are capturing offshore wind specification wins that competitors still focused on legacy technology cannot access. Companies should prioritise VSC platform investment over incremental line-commutated improvement now, because offshore wind demand growth concentrates overwhelmingly in the segment VSC technology alone serves effectively.
03 / CABLE CAPACITY MIRRORS BOTTLENECK

Submarine cable and vessel scale increasingly decide delivery

Submarine cable manufacturing and cable-laying vessel capacity have become nearly as constrained as converter station capacity, and suppliers with established manufacturing scale and owned vessel fleets are capturing project awards that capacity-constrained competitors simply cannot bid on within required timelines. Building this capacity requires years of lead time and substantial capital that only a small number of suppliers have committed to at genuine scale. Companies should invest in vessel fleet expansion now, since offshore wind and interconnection growth are pulling cable demand upward faster than most manufacturing plans currently anticipate.
04 / INTEROPERABILITY DECIDES FUTURE ARCHITECTURE

Multi-terminal standards will reshape competitive positioning

Multi-terminal HVDC systems requiring converter stations from different manufacturers to interoperate reliably remain technically unresolved, and suppliers building credible reference projects demonstrating interoperability are positioning for specification consideration that competitors without comparable references cannot access. This requires collaboration with competitors that some suppliers resist, but the alternative is exclusion from an architecture grid planners increasingly prefer for offshore wind zones with multiple connection points. Companies should treat interoperability leadership as a strategic investment now, before industry standards fully consolidate around whichever approach proves first.

Engagement Snapshot From the Field

A live engagement with an industry participant carrying material or product regulatory and market exposure ahead of a defining policy shift, showing how our research translates into a defensible multi-year portfolio strategy.
MARKET MINDS ADVISORY · CLIENT ENGAGEMENT SUMMARY
High Voltage Direct Current Transmission Producer Strategic Portfolio Review and Transition Roadmap 2026·Investment Scenario on High Voltage Direct Current Transmission Exposure Evaluation 2025-26
CLIENT PROFILE
A regional offshore wind developer planning a 1.4 gigawatt wind zone requiring HVDC connection engaged MMA while evaluating converter station suppliers for the first time. The client reported a project financing timeline assuming converter delivery within 30 months, based on an initial vendor estimate the internal team had not independently verified against current market conditions (client-reported, unverified by MMA).
STRATEGIC CHALLENGE
Project financing and construction scheduling had been built around the 30 month converter delivery estimate from a single vendor conversation, without benchmarking against actual current market lead times. Competing wind zones in the same region were simultaneously seeking converter capacity from the same limited supplier base, a risk the internal team had not fully assessed. The board wanted independent verification before finalising financing commitments.
MMA APPROACH
MMA benchmarked current converter station lead times across qualified suppliers against the client's assumed 30 month timeline, incorporating actual recent project delivery data rather than vendor sales estimates. We assessed competing regional demand for converter capacity from other wind zones seeking the same supplier base concurrently. We then modelled financing and construction schedule risk under realistic lead time scenarios against the original assumption.
KEY FINDINGS
  1. Realistic converter lead times across qualified suppliers ranged from 42 to 54 months, considerably longer than the 30 month estimate financing assumptions had been built around.
  2. Two competing regional wind zones had already begun capacity reservation discussions with the same limited supplier base, threatening the client's ability to secure timely delivery at all.
  3. Financing terms assuming the original 30 month timeline risked default triggers if actual delivery extended past 40 months under the client's specific loan covenant structure (client-reported, unverified by MMA).
  4. Early capacity reservation with a supplier offering documented delivery history could secure a 44 month timeline, still requiring financing renegotiation but meaningfully better than unreserved market position.
CLIENT PROFILE
A regional offshore wind developer planning a 1.4 gigawatt wind zone requiring HVDC connection engaged MMA while evaluating converter station suppliers for the first time. The client reported a project financing timeline assuming converter delivery within 30 months, based on an initial vendor estimate the internal team had not independently verified against current market conditions (client-reported, unverified by MMA).
STRATEGIC CHALLENGE
Project financing and construction scheduling had been built around the 30 month converter delivery estimate from a single vendor conversation, without benchmarking against actual current market lead times. Competing wind zones in the same region were simultaneously seeking converter capacity from the same limited supplier base, a risk the internal team had not fully assessed. The board wanted independent verification before finalising financing commitments.
MMA APPROACH
MMA benchmarked current converter station lead times across qualified suppliers against the client's assumed 30 month timeline, incorporating actual recent project delivery data rather than vendor sales estimates. We assessed competing regional demand for converter capacity from other wind zones seeking the same supplier base concurrently. We then modelled financing and construction schedule risk under realistic lead time scenarios against the original assumption.
KEY FINDINGS
  1. Realistic converter lead times across qualified suppliers ranged from 42 to 54 months, considerably longer than the 30 month estimate financing assumptions had been built around.
  2. Two competing regional wind zones had already begun capacity reservation discussions with the same limited supplier base, threatening the client's ability to secure timely delivery at all.
  3. Financing terms assuming the original 30 month timeline risked default triggers if actual delivery extended past 40 months under the client's specific loan covenant structure (client-reported, unverified by MMA).
  4. Early capacity reservation with a supplier offering documented delivery history could secure a 44 month timeline, still requiring financing renegotiation but meaningfully better than unreserved market position.
RECOMMENDED STRATEGY
Phase 1: Phase 1 (0 to 2 months): Initiate capacity reservation discussions immediately with the supplier offering the most credible 44 month delivery commitment. Phase 2: Phase 2 (2 to 8 months): Renegotiate financing terms and construction scheduling around the realistic 44 month converter delivery timeline. Phase 3: Phase 3 (8 to 44 months): Execute converter procurement and construction against the renegotiated timeline with regular milestone tracking and review.
OUTCOME
The client secured capacity reservation with the recommended supplier and renegotiated financing terms around the realistic 44 month delivery timeline before competing regional wind zones could claim the same limited supplier capacity. Early engagement avoided the default risk the original 30 month assumption would have created under the loan covenant structure (client-reported, unverified by MMA).

Frequently Asked Questions

Foundational context covering the market sizes, CAGR, scope, country, region and competition that inform every finding below. This section is provided to cover basics and most often pre-purchase conversations, answered from the MMA Primary Research Dataset.

What is the current size of the High Voltage Direct Current Transmission Market?

The global HVDC transmission market is valued at USD 19.4 billion in 2025, covering converter stations, submarine and overhead cables, control systems, and directly attached engineering services. Alternating current transmission equipment is excluded.

How large will the High Voltage Direct Current Transmission Market be by 2036?

The market is forecast to reach USD 54.25 billion by 2036 in the base case, about 2.55 times the 2026 level. That represents incremental value of roughly USD 32.95 billion across the decade.

What is the CAGR for the High Voltage Direct Current Transmission Market 2026 to 2036?

The market grows at a 9.8% CAGR in the base case, with bull and bear scenarios at 11.1% and 8.5%. The spread turns mainly on offshore wind buildout pace and converter manufacturing capacity expansion.

Which segment is growing fastest?

VSC-based converter systems grow fastest at 14.6%, about 1.49 times the overall rate, as offshore wind and multi-terminal projects favour voltage source technology. HVDC submarine cables follow at 12.8%.

Who are the major companies in the High Voltage Direct Current Transmission Market?

Leading companies include Siemens Energy, Hitachi Energy, GE Vernova, Prysmian, and Nexans. Concentration sits at CR5 of 58%, reflecting how few manufacturers hold proven power electronics expertise.

Which country is growing fastest?

The United Kingdom grows fastest at a 13.2% CAGR, on North Sea offshore wind interconnection demand. China continues expanding domestic ultra-high-voltage transmission at considerable scale.

Report Segmentation Architecture

The full report scope spans multiple orthogonal segmentation dimensions, with cross-tabulated demand data provided for each dimension pair. Coverage extends further to regional breakdowns, trend trajectories, and the competitive detail needed to support segment-level decision-making.

By Converter and Equipment Technology Type

  • VSC-Based HVDC Converter Systems
  • LCC-Based HVDC Converter Systems
  • HVDC Submarine Cables
  • HVDC Overhead Transmission Lines
  • HVDC Underground Cables
  • Multi-Terminal Grid Systems

By End-Use Application

  • Offshore Wind Connection
  • Cross-Border Interconnection
  • Ultra-High-Voltage Domestic Transmission
  • Bulk Hydroelectric Transmission
  • Urban and Underground Grid Reinforcement

By Commercial Dimension

  • Equipment Supply and Manufacturing
  • Engineering and Installation Services
  • Operations and Maintenance Contracts
  • Upgrade and Life Extension Services

By Region

  • North America
  • Western Europe
  • East Asia
  • South Asia and Pacific
  • Latin America
  • Middle East and Africa
  • Eastern Europe

Scope, Methodology, and Coverage

Every figure in this report is reproducible from documented input assumptions. The scope below maps the historical period, the forecast horizon, the segmentation dimensions, and the countries covered, alongside the underlying primary and qualitative methodology.
Historical Period
2020 to 2025
Forecast Period
2026 to 2036
Base Year
2025 (USD billions; MMA Primary Research Dataset, August 2026)
Market Definition
The HVDC transmission market comprises converter stations, cables, control and protection systems, and directly attached engineering services used to transmit electricity as direct current over long distances or across water, valued at manufacturer and supplier revenue from equipment and services. It spans voltage source and line-commutated converter technology, submarine and underground cables, overhead transmission equipment, and multi-terminal grid systems. Standard alternating current transmission equipment, distribution-level infrastructure, and electricity generation equipment itself are excluded.
Quantitative Units
USD billions (current prices); installed transmission capacity in gigawatts where applicable
Segmentation Dimensions
By Converter and Equipment Technology Type; By End-Use Application; By Commercial Dimension; By Region
Regions Covered
North America, Western Europe, East Asia, South Asia and Pacific, Latin America, Middle East and Africa, Eastern Europe
Countries Covered
USA, China, Germany, France, UK, Japan, South Korea, India, Australia, Canada, Brazil, Mexico, Indonesia, Vietnam, Thailand, Malaysia, UAE, Saudi Arabia, South Africa, Nigeria, Turkey, Poland, Netherlands, Italy, Spain, Sweden, Switzerland, Argentina, Colombia, Singapore, and additional markets relevant to this sector
Key Companies Profiled
Siemens Energy, Hitachi Energy, GE Vernova, Prysmian, Nexans, NR Electric, XD Electric, State Grid Corporation of China, Sumitomo Electric, LS Cable and System, TBEA, C-EPRI Electric Power Engineering, RXPE, Toshiba Energy Systems, Mitsubishi Electric, NKT, Fujikura, ZTT, Hyosung Heavy Industries, Baosheng Science and Technology
Quantitative Methodology
Primary survey, n=3,800 respondents, Q4 2025, six countries; demand-side model with trade association cross-validation
Qualitative Methodology
47 expert interviews, Q4 2025; applied to validate demand model assumptions, identify emerging dynamics, and assess competitive positioning
Report Format
PDF and XLSX data workbook (Word format preview document)
Publisher
Market Minds Advisory
Report Code
MMA-2026-ENE-142
Published
August 2026
Contact
sales@marketmindsadvisory.com | www.marketmindsadvisory.com

Purchase the full High Voltage Direct Current Transmission Market Report (2026 to 2036).

The full MMA HVDC Transmission report sizes the market across six converter and equipment technology categories, five end-use applications, four commercial dimensions, and seven regions through 2036. It profiles 20 companies on a consistent HVDC equipment revenue basis, scoring each on converter manufacturing capacity, VSC platform maturity, and submarine cable and vessel scale. Scenario models quantify how offshore wind buildout, cross-border interconnection investment, and converter manufacturing capacity constraints move both installed capacity and achievable margin by technology category. The report also includes converter lead time tracking by supplier, submarine cable and vessel capacity assessment, and multi-terminal interoperability progress tracking for commercial and project strategy teams.
Six-category and four-dimension market sizing to 2036
Twenty-company benchmark on HVDC equipment revenue basis
Converter station lead time and capacity tracking by supplier
Submarine cable and vessel capacity assessment by manufacturer
Multi-terminal interoperability progress tracking across vendors
Offshore wind and interconnection demand correlation analysis

Built For The People Who Decide

From boardroom strategy to bench-side execution, this report is read cover-to-cover by leaders shaping the next decade of their industry, turning demand scenarios, market dynamics and valuation benchmarks into decisions.
CXOs/ Presidents/ VPs/ Managers
M&A and Corporate Development
Strategy Teams and R&D Heads
Procurement and Product Directors
Regulatory and Compliance Leaders
Investor Relations and Equity Analysts