Market Minds Advisory
Graphic Processor Market

Graphic Processor Market: Compute Density as the New Procurement Currency

Hyperscalers now allocate capital budgets around GPU supply commitments rather than data center square footage, sovereign AI programs bid directly against cloud providers for allocation, and chipmakers without advanced packaging capacity lose multi-year contracts outright.

Lead Analyst

Victor Gallo

Published

August 2026

Make Smarter Decisions with Customized Research Insights

Request a free sample report and evaluate market opportunities, growth trends, and competitive dynamics relevant to your business needs.

2025 MARKET VALUE$115.0BMarket Size 2025
2036 FORECAST VALUE$380.8BBase Case , 2026 to 2036
CAGR 2026 TO 203611.5 %Bull 12.8% / Bear 10.2%
INCREMENTAL OPPORTUNITY$252.6BNet 10- year value creation
EXPANSION MULTIPLE2.97x2036 value over 2026 base
Strategic Levers
M&A Pipeline
Regional Outlook
Country Rankings
Competitive Intelligence
Segmental Deep-dive
Call-Us : 91 93563 13602

Executive Snapshot and Market Trajectory

Hyperscalers and sovereign AI programs now treat GPU allocation as a strategic capacity constraint rather than a routine procurement line, since training and inference compute increasingly gates which AI products a company can actually ship, not simply how fast it ships them, reshaping capital planning across the entire technology sector.
Datacenter and AI accelerator GPUs lead growth at 22.0%, roughly 1.91 times the overall rate, as large language model training and inference workloads keep expanding well beyond what gaming and professional segments ever demanded historically. North America now holds the largest regional share at 32%, driven by concentrated hyperscaler capital expenditure and the dominant position of American chip designers in advanced AI compute design, packaging, and architecture leadership today.
Competitive intensity runs extremely high at 82% held by five suppliers, since leading-edge process node access and advanced packaging capacity concentrate share around a handful of design houses rather than fragmenting across regional foundries the way less advanced semiconductor categories often do, and that concentration shows no sign of easing soon. Buyers increasingly select suppliers on software platform maturity and delivery reliability rather than raw benchmark performance alone, a shift reshaping procurement teams broadly.
Market Definition
Base Year Value
$115.0B in 2025 (MMA Primary Research Dataset, August 2026)
Forecast Period
2026 to 2036, eleven discrete annual values
CAGR
11.5% base case. Bull 12.8%. Bear 10.2%.
Fastest Growth Segment
Datacenter and AI Accelerator GPUs: 22.0% CAGR
Fastest Growth Country
India: 16.5% CAGR
Fastest Growth Region
South Asia and Pacific: 13.6% CAGR
Largest Region
North America: 32% of 2025 global value
Market Leaders
Primary Survey
n=3,800 procurement and R&D decision-makers, Q4 2025, six countries
Methodology
Demand-side build-up, cross-validated against public data, 47 expert interviews

Graphic Processor Market Forecast Scenarios

graphic-processor-market-size-forecast-scenario-1787301142086
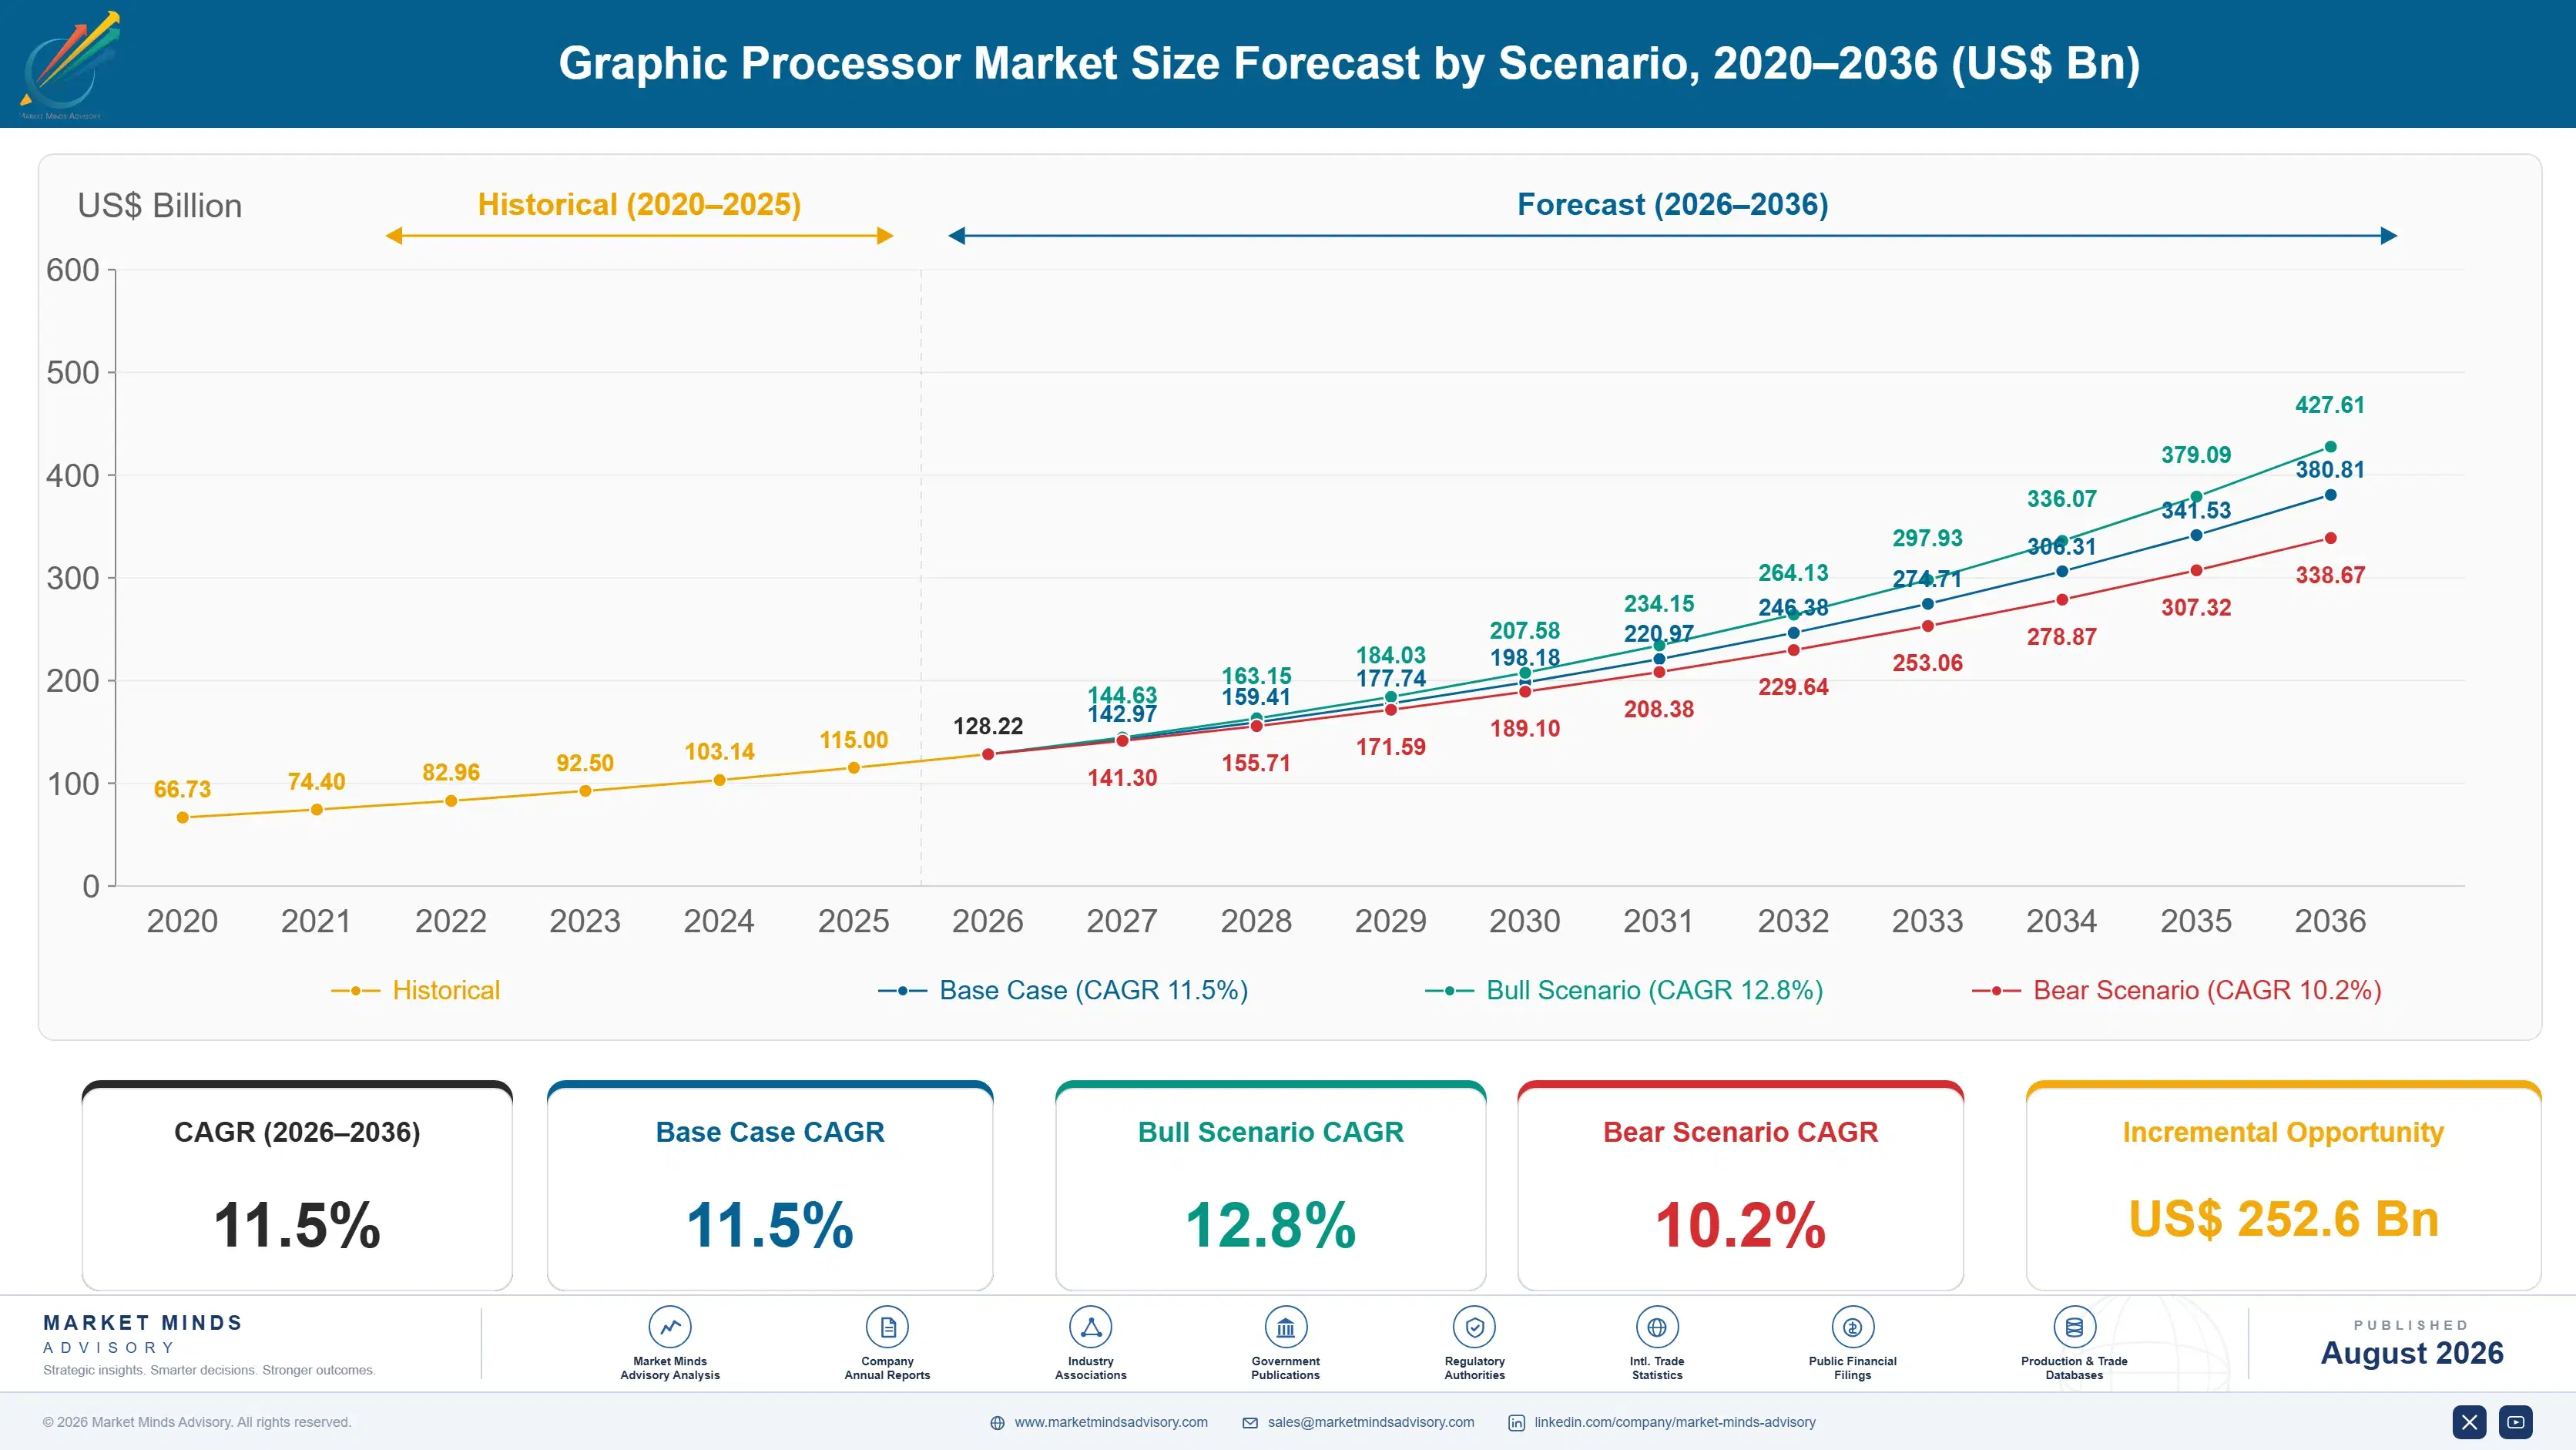
Between 2020 and 2025 the market grew at an estimated 10.0% annually, accelerating sharply after 2022 as generative AI model training demand surged and hyperscalers committed unprecedented capital toward GPU cluster buildout across new and expanded data center campuses worldwide, from Virginia to Malaysia to Abu Dhabi, each racing to secure allocation ahead of competitors.
Three mechanisms carry the base case to 11.5%. First, large language model training and inference workloads keep scaling as model sizes and deployment volume both grow simultaneously across major cloud platforms. Second, sovereign AI infrastructure programs are committing substantial capital to secure domestic compute capacity independent of hyperscaler allocation decisions. Third, advanced packaging and high-bandwidth memory capacity keeps expanding, relieving supply constraints that previously capped shipment volume across the entire industry.
The bull case at 12.8% assumes sustained enterprise AI adoption keeps inference workload growth ahead of efficiency gains from smaller, more optimized models reaching production deployment. The bear case at 10.2% assumes AI infrastructure capital spending moderates as hyperscalers digest already-committed capacity and inference costs fall faster than usage grows across most enterprise deployment scenarios and application categories worldwide.

Compute Allocation as the Central Bottleneck

Graphic processors sit at the center of compute economics for any organization deploying artificial intelligence, high-performance computing, or advanced visualization workloads, since accelerator allocation increasingly determines what a company can build rather than simply how quickly it builds it. Supply chain depth, not raw architectural innovation alone, increasingly separates competing suppliers across most large-scale procurement decisions and multi-year infrastructure commitments.
MARKET CONCENTRATION (CR5)82%Five suppliers hold dominant share across advanced compute segment
AVERAGE SELLING PRICEUSD 25,000 to 40,000Typical price for top-tier datacenter accelerator units today
TOP PRODUCING COUNTRY SHARE29%Taiwan supplies largest share of advanced chip fabrication capacity
PRODUCT REFRESH CYCLE12 to 18 monthsDatacenter accelerator generations typically launch within this window
ADVANCED PACKAGING COST SHARE18-25% of COGSCoWoS and interposer packaging weighs heavily on production costs
TRADE INTENSITY52% cross-borderWafers and packaged chips frequently cross borders before final assembly
Commercially, the category behaves like a capacity-constrained platform business wrapped inside a broader cloud and enterprise infrastructure relationship. Suppliers bundle hardware with proprietary software stacks and long-term supply agreements under multi-year allocation contracts, which locks buyers into a single primary architecture across an entire compute fleet rather than encouraging workload-by-workload shopping on price. Switching architectures requires costly software and workflow requalification.
Over the next decade, expect custom silicon developed by hyperscalers themselves to keep gaining share alongside merchant GPU suppliers, as large buyers seek to diversify supply risk and optimize cost for specific workload types across their infrastructure portfolios. Advanced packaging and high-bandwidth memory capacity will increasingly determine which suppliers can actually ship committed volume rather than architectural design alone across the entire competitive field.
"Nobody is buying a GPU anymore. They are buying a reservation in a queue, and the queue is the actual product being sold."
Director, Semiconductor and AI Infrastructure Practice · MMA Technology / Semico

Market Trends

Custom Silicon Development Accelerates Among Hyperscalers

Amazon, Google, and Microsoft have all expanded internal custom AI accelerator programs, developing chips like Trainium, TPU, and Maia specifically to reduce dependence on merchant GPU suppliers for a portion of their internal training and inference workloads. Each custom silicon program requires enormous upfront design and fabrication investment, but hyperscalers with sufficient internal workload volume can justify that cost through improved price-performance on workloads their own software stack controls completely. Broadcom and Marvell have both expanded custom silicon design services supporting these hyperscaler programs directly. The shift is creating a genuine second procurement channel alongside merchant GPU purchases.
Market Impact: Adds 60% inference compute share
Sovereign AI Programs Commit Capital to Domestic Compute

Governments across the Gulf states, India, and Southeast Asia have committed substantial public and sovereign wealth capital toward building domestic AI compute infrastructure, motivated by both economic diversification goals and concerns about depending entirely on foreign hyperscaler cloud capacity for strategic AI capability. Saudi Arabia and the United Arab Emirates have both announced multi-billion dollar GPU cluster investments tied to national AI strategy programs. These sovereign buyers now compete directly with commercial hyperscalers for allocation from the same constrained supplier base, adding a genuinely new demand layer independent of enterprise cloud consumption growth.
Market Impact: Adds 35% packaging capacity yearly

Market Opportunities and Growth Drivers

Generative AI Deployment Sustains Inference Compute Demand

Enterprise generative AI deployment keeps expanding across customer service, software development, and content generation applications, and each deployed application requires ongoing inference compute that persists long after the initial model training investment concludes. Unlike training, which happens in discrete bursts, inference workloads scale continuously with usage, creating a demand base that compounds as adoption spreads across more enterprise functions and consumer-facing products. Major cloud providers report inference workloads now representing a majority share of their total AI compute consumption, a meaningful shift from the training-dominated demand pattern of just a few years earlier.
Market Impact: Cuts addressable China revenue 25%

Advanced Packaging Capacity Expansion Relieves Supply Constraints

Leading foundries have committed substantial capital toward expanding advanced packaging capacity, including chip-on-wafer-on-substrate and other interposer technologies required to assemble high-bandwidth memory alongside compute dies in modern accelerator packages. TSMC has disclosed multi-billion dollar capacity expansion plans specifically targeting this bottleneck, which has constrained shipment volume more than wafer fabrication capacity itself in recent product cycles across the industry. Each new packaging line commissioned directly relieves a supply constraint that has forced customers into multi-quarter allocation queues regardless of their willingness to pay premium pricing for priority access ahead of competing customers.
Market Impact: Delays deployment 6 to 12 months

Market Restraints and Challenges

Export Control Restrictions Limit Addressable Markets

United States export control regulations restrict sales of the most advanced AI accelerators to certain countries, most significantly China, cutting suppliers off from a historically large addressable market for their highest-margin products. The root cause is national security policy: the same compute capability that trains commercial AI models can accelerate military and intelligence applications, giving policymakers a stated rationale for restricting access regardless of commercial consequences. That restriction has forced suppliers to develop compliant, performance-reduced variants for restricted markets, sacrificing revenue and giving domestic Chinese suppliers an opening to develop competing alternatives with official encouragement.
Market Impact: Shifts 18% of AI compute in-house

Power and Cooling Infrastructure Constrains Deployment Pace

Modern AI accelerator clusters draw enormous power and generate substantial heat, and many existing data center facilities lack the electrical capacity and cooling infrastructure needed to deploy the latest generation hardware at full density without extensive retrofitting. The root cause is infrastructure lag: data centers designed a decade ago for conventional server racks were never engineered for the power density modern accelerator clusters require. That gap forces operators to either retrofit existing facilities at considerable expense or build new purpose-designed campuses, both of which delay deployment timelines. Suppliers are responding with liquid cooling reference designs and power-efficient architectures.
Market Impact: Adds 40 sovereign GPU clusters
3 additional market trends, 4 additional growth drivers, and 2 additional restraints and challenges are covered in the full report. Contact sales@marketmindsadvisory.com to access the complete intelligence.

Segment CAGR and Growth Architecture

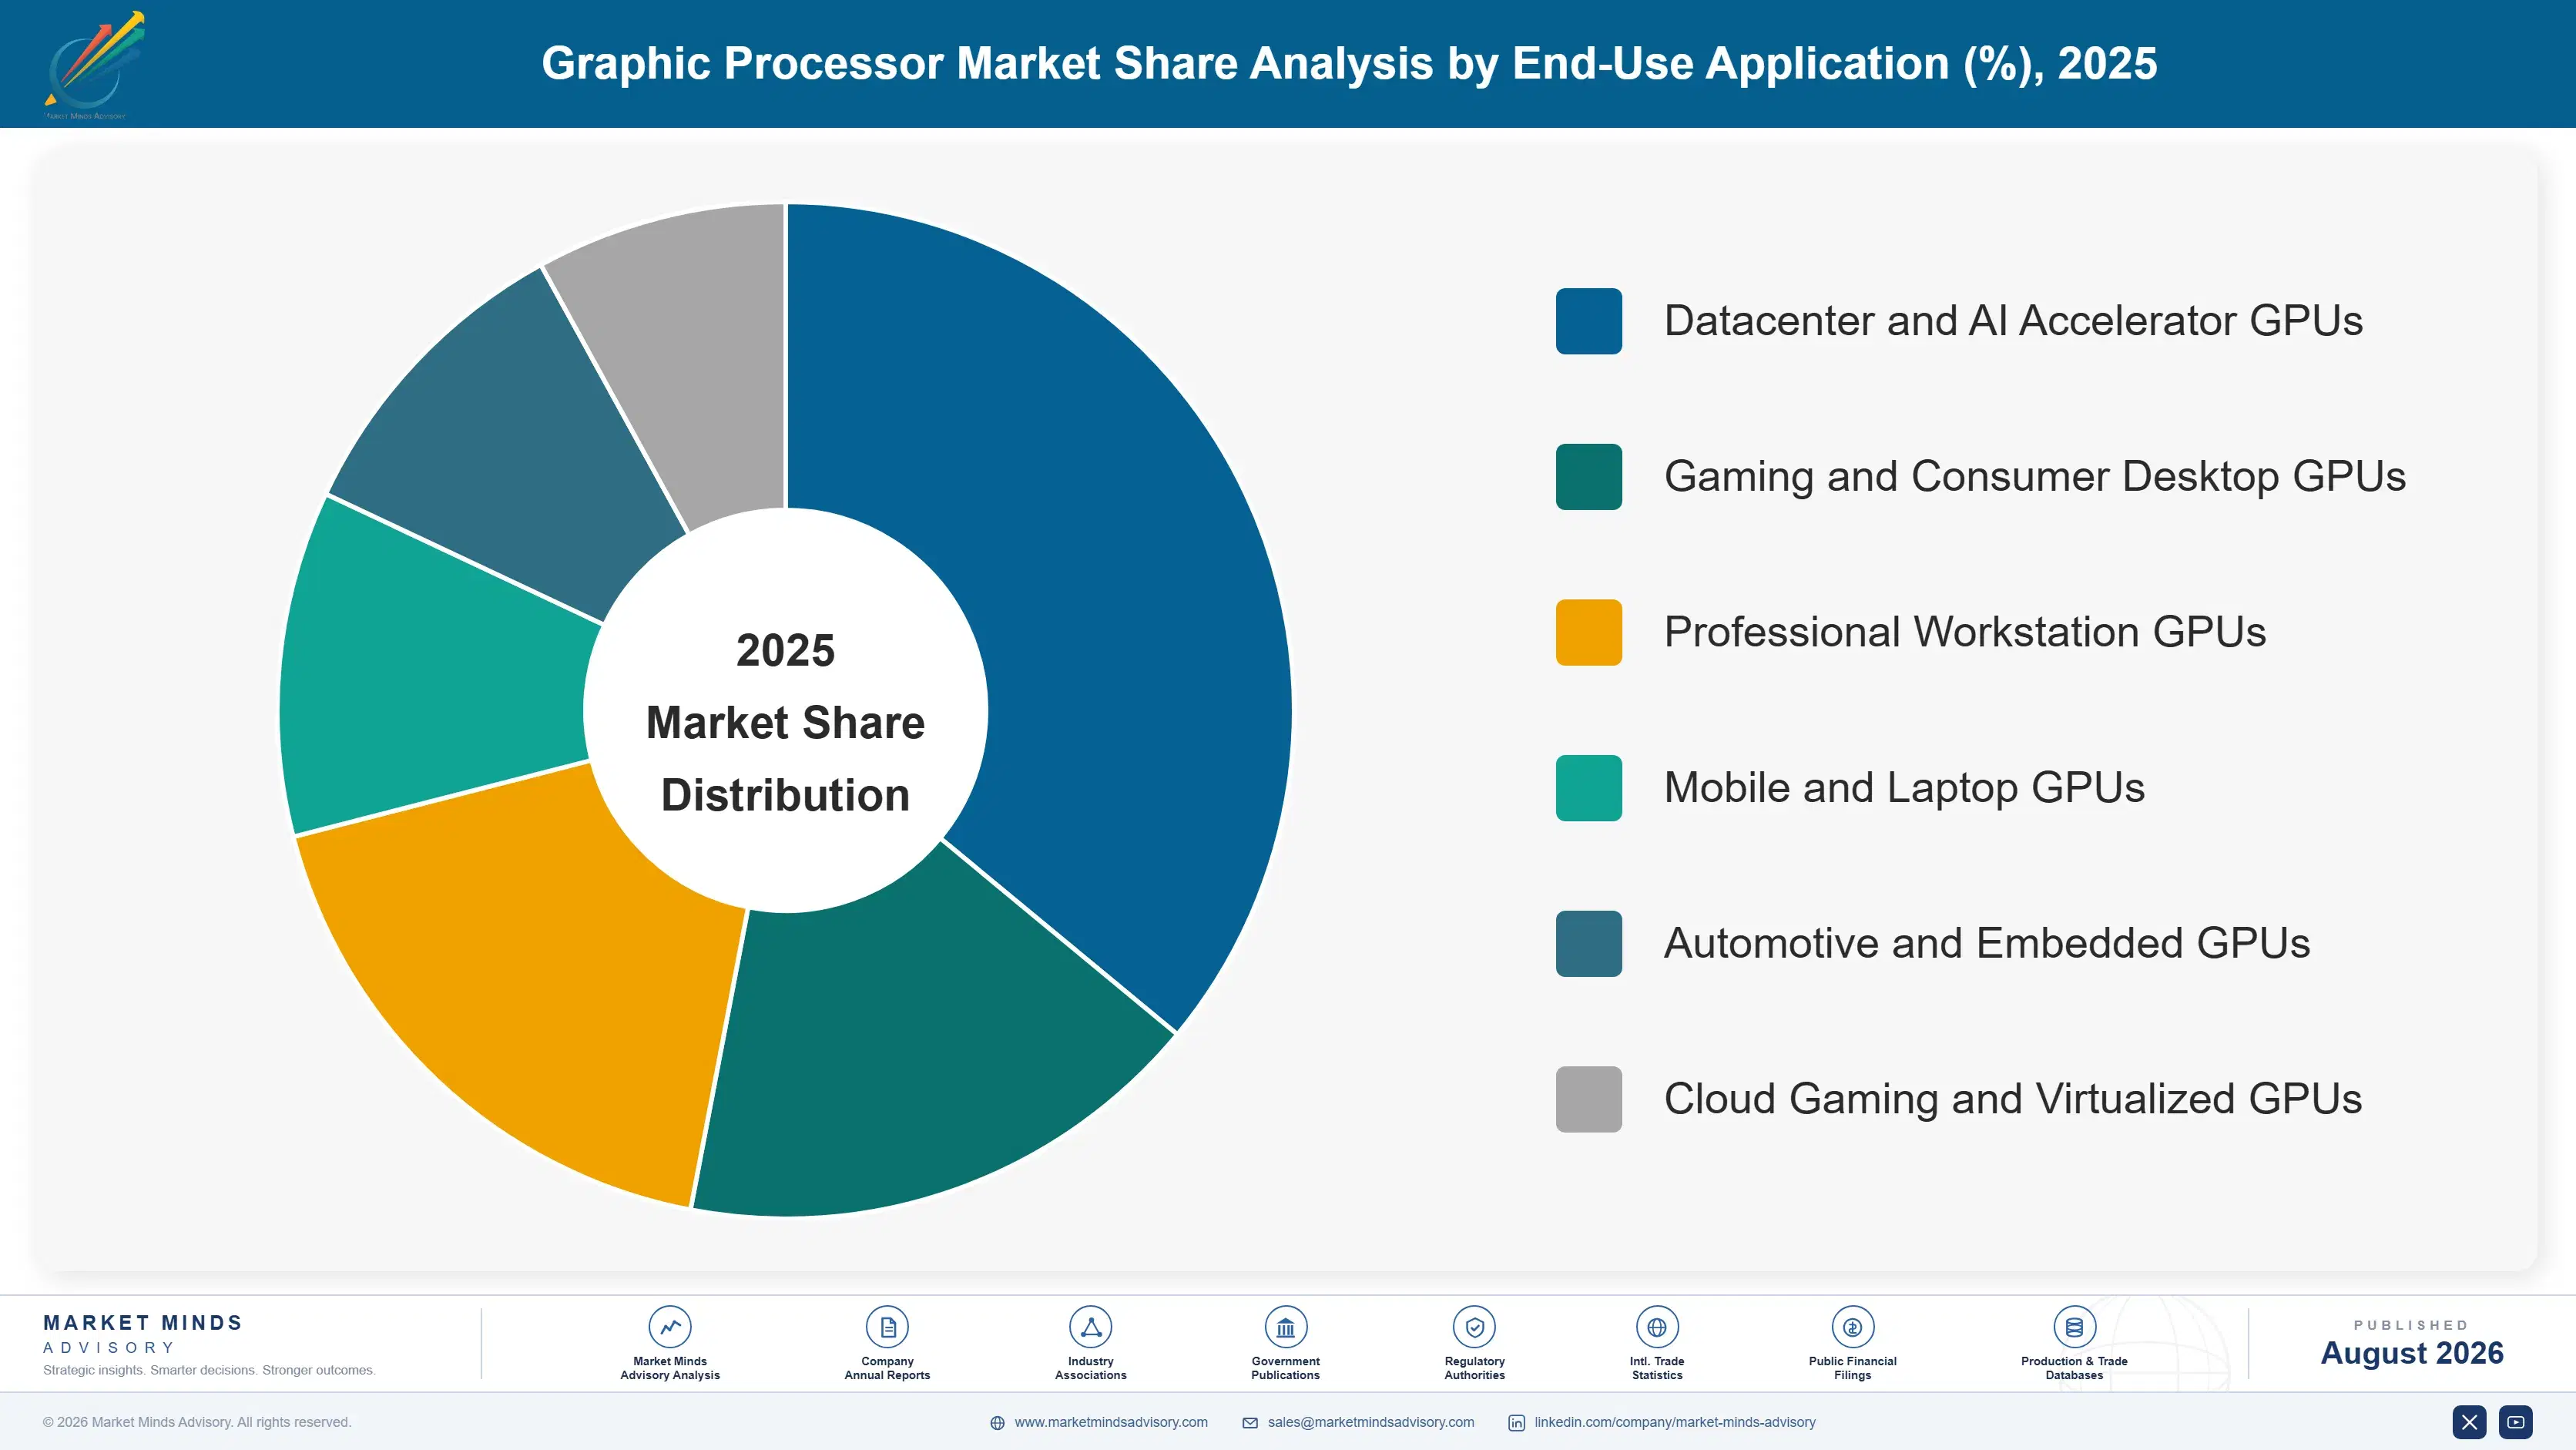
Segmentation follows end-use application, a single deployment-context logic spanning datacenter and AI accelerator, gaming, professional workstation, mobile and laptop, automotive and embedded, and cloud gaming GPUs. Each application carries distinct performance requirement, buyer group, and procurement cycle, so commercial position tracks the deployment context rather than the underlying silicon architecture or manufacturing process alone.
graphic-processor-market-market-share-analysis-1787301142627

Datacenter and AI Accelerator GPUs

Datacenter and AI accelerator GPUs grow fastest at 22.0%, about 1.91 times the overall market rate, as large language model training and inference workloads keep scaling across hyperscaler, enterprise, and sovereign compute deployments simultaneously. Each new model generation demands more training compute than its predecessor, while inference workloads compound continuously as deployed applications accumulate usage volume rather than happening in discrete bursts like training runs. NVIDIA and AMD have both expanded datacenter accelerator product lines and advanced packaging capacity to meet this demand, and hyperscalers increasingly specify multi-year supply commitments during vendor qualification rather than relying on spot-market purchasing for critical compute capacity across their entire compute fleet and multi-year infrastructure roadmap.
CAGR 22.0%

Automotive and Embedded GPUs

Automotive and embedded GPUs grow second-fastest at 14.0%, driven by advanced driver assistance systems and autonomous driving programs that require substantial onboard compute for real-time sensor fusion and perception processing tasks. Each new vehicle generation with advanced autonomy features requires meaningfully more onboard compute than its predecessor, creating sustained unit value growth independent of overall vehicle production volume. NVIDIA and Qualcomm have both expanded automotive-grade accelerator product lines targeting this application specifically, and automakers increasingly specify multi-year platform commitments given the multi-year vehicle development cycles involved in bringing new autonomous-capable vehicle models to market across multiple regional regulatory jurisdictions, from North America to the European Union and across East Asia broadly.
CAGR 14.0%
Full segment breakdown across 6 segments available in the complete report.

Regional Architecture and Country Demand Map

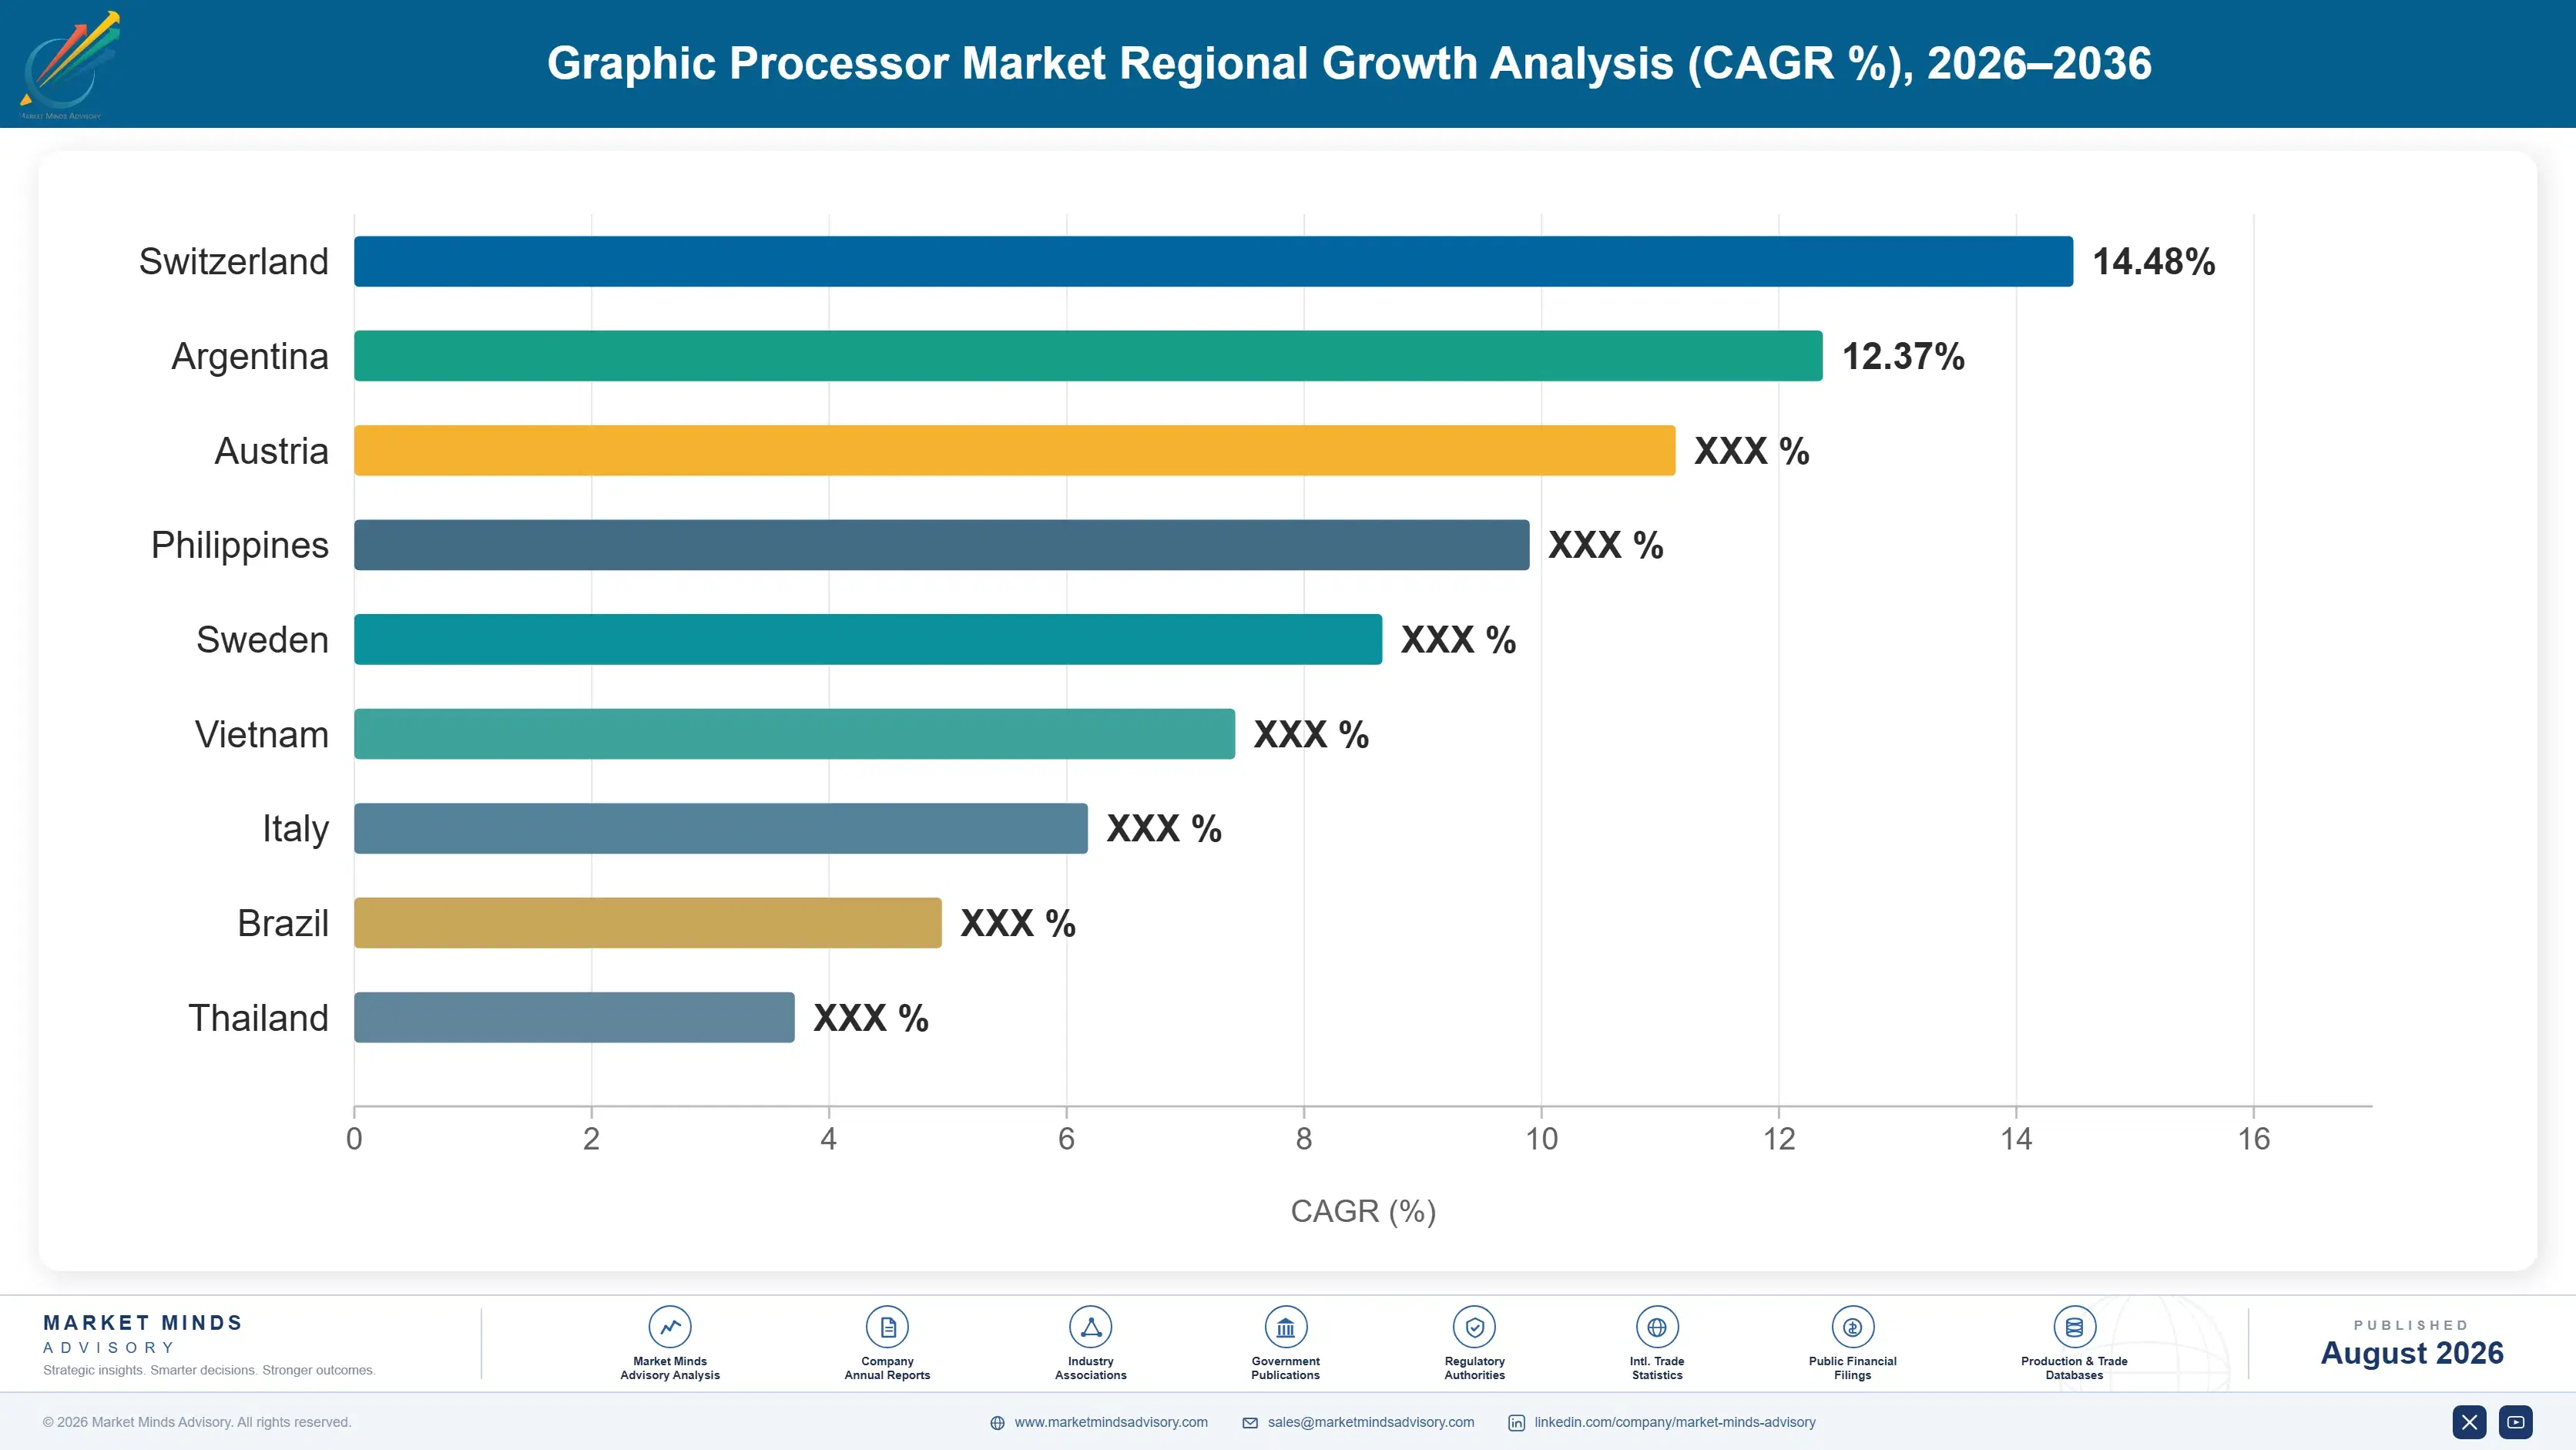
North America leads at 32% of global value on concentrated hyperscaler capital expenditure and chip design leadership, followed by East Asia at 27% and Western Europe at 18% on enterprise and sovereign compute investment. Remaining regions together account for the balance of overall global demand today.

North America

United States hyperscalers anchor North American demand almost single-handedly, since Microsoft, Google, Amazon, and Meta collectively commit more capital toward AI compute infrastructure than any other buyer group worldwide, concentrating both design leadership and consumption in the same geography. NVIDIA, AMD, and Intel all maintain their primary design and headquarters operations domestically, giving the region first access to newly launched accelerator architectures ahead of international allocation. Canada's data center sector contributes meaningful secondary demand, benefiting from favorable power costs and proximity to American cloud infrastructure. Growth of 12.5% outpaces the global rate as hyperscaler capital expenditure keeps climbing alongside expanding sovereign and enterprise deployment across the continent's data center corridors.
Share: 32% | CAGR: 12.5% (2026 to 2036)

Western Europe

Germany and France host substantial enterprise and research computing demand, though the region's AI infrastructure buildout trails North America and East Asia considerably given more fragmented cloud provider investment across national boundaries. The United Kingdom's technology sector sustains meaningful demand through both domestic AI research institutions and cloud provider data center investment. The European Union's digital sovereignty initiatives have begun directing public capital toward domestic compute capacity, though implementation pace varies considerably across individual member states and national budgets. Growth of 10.0% trails the global average because the region's hyperscaler investment intensity remains lower than markets with more concentrated hyperscaler capital commitment and faster permitting timelines for new data center construction projects.
Share: 18% | CAGR: 10.0% (2026 to 2036)
Regional intelligence for 5 additional markets available in the complete report: East Asia, South Asia and Pacific, Latin America, Middle East and Africa, Eastern Europe. Contact sales@marketmindsadvisory.com.
graphic-processor-market-country-cagr-analysis-1787301143188

Where Chipmakers Can Defend Compute Margin

Suppliers can defend margin against commoditized silicon pricing in several distinct ways beyond simply shipping more accelerators into a growing compute base. The four levers below identify genuine commercial advantage: software platform lock-in, advanced packaging capacity security, sovereign contract positioning, and custom silicon partnership revenue across major hyperscaler, sovereign, and enterprise accounts worldwide and their evolving procurement cycles.

Deepen Proprietary Software Platform Lock-In Now

Hardware alone commoditizes quickly once competing architectures reach comparable raw performance, but proprietary software stacks that developers have already optimized their workloads against create switching costs that persist for years after any single hardware generation. Suppliers with mature developer tooling, libraries, and framework integration can charge premiums of 30% to 50% over comparable raw performance from newer entrants, since customers value avoiding costly workload requalification more than the incremental hardware cost difference. NVIDIA's CUDA platform exemplifies this durable advantage across its installed developer base of several million active engineers worldwide.
Market Impact: Commands a durable 30% to 50% price premium

Secure Advanced Packaging Capacity Ahead of Demand

Advanced packaging capacity, not wafer fabrication, has become the binding supply constraint across most datacenter accelerator product lines, and suppliers that secure long-term capacity commitments ahead of demand spikes avoid the allocation queues squeezing competitors without equivalent agreements. Suppliers with secured packaging capacity can guarantee delivery timelines that secure premium pricing of roughly 15% to 25% over suppliers offering uncertain lead times, since buyers value delivery certainty during periods of severe industry-wide shortage. Long-term foundry relationships built over multiple product cycles protect this advantage durably against newer entrants lacking comparable relationships.
Market Impact: Commands a durable 15% to 25% price premium

Win Sovereign AI Infrastructure Contracts Early

Sovereign AI programs represent a genuinely new demand category commanding both scale and government-backed payment certainty, and suppliers that win early framework agreements with national programs secure multi-year revenue visibility that spot-market enterprise sales cannot match. Suppliers with established government relationship infrastructure can negotiate framework agreements worth several billion dollars across a program's multi-year buildout timeline, capturing share before competitors even establish local government relationships. Early positioning in Gulf state and Southeast Asian sovereign programs, several already exceeding 10 billion dollars in committed capital, is already shaping longer-term regional market structure.
Market Impact: Secures multi-year framework contracts worth over 1 billion

Develop Custom Silicon Partnerships With Hyperscalers

Hyperscalers increasingly want customized accelerator designs optimized for their specific internal workloads rather than accepting general-purpose merchant silicon built for the broadest possible customer base. Suppliers offering custom silicon design services can capture design revenue plus ongoing production royalties worth considerably more per relationship than a comparable merchant silicon sale, often exceeding 1 billion dollars across a multi-year program lifecycle, while also deepening the customer relationship beyond a simple transactional hardware purchase. Broadcom has built a substantial business specifically around this custom silicon partnership model with major hyperscaler accounts across multiple product generations.
Market Impact: Adds over 1 billion dollars per program lifecycle

Who Controls the Margin Pool

Concentration runs extremely high at 82% held by the top five suppliers, evaluated on revenue from graphic processor and AI accelerator product lines specifically. NVIDIA and AMD lead on datacenter scale and software platform depth, while Intel, Qualcomm, and Huawei compete across different architecture specialties and regional footprints. The gap between leader and challenger is severe, since leading-edge process access and packaging capacity alone take years to secure.
Competitive activity currently runs along three dimensions. Software platform depth matters most, as suppliers race to lock developers into proprietary tooling that survives multiple hardware generations. Advanced packaging capacity runs a close second, determining who can actually ship committed volume rather than merely design competitive silicon. Sovereign and custom silicon partnership positioning is the third, converting one-time hardware sales into multi-year framework relationships.

Pressure is building from two directions. Chinese domestic accelerator manufacturers are scaling rapidly under government encouragement, narrowing the technology gap despite export control restrictions limiting their access to leading-edge fabrication. Meanwhile hyperscaler custom silicon programs are commercializing internal accelerator designs that could displace merchant GPU purchases for a meaningful share of internal workloads. Rankings will shift toward suppliers combining defensible software platforms with genuine supply chain security.
graphic-processor-market-company-positioning-matrix-1787301143729

Competitive Moat and Risk Dimensions

NVIDIA CORPORATION

Moat: CUDA Software Platform Depth

NVIDIA's CUDA software platform has accumulated over a decade of developer tooling, libraries, and framework integration that competitors cannot quickly replicate, creating switching costs that persist across multiple hardware generations. That platform depth lets NVIDIA command premium pricing even when competing architectures reach comparable raw benchmark performance.
NVIDIA CORPORATION

Risk: Exposure to Customer Concentration

A small number of hyperscaler customers account for a substantial share of NVIDIA's datacenter revenue, and those same customers are simultaneously developing custom silicon specifically to reduce their dependence on NVIDIA hardware for at least a portion of their internal workloads. That concentration creates revenue risk smaller, more diversified competitors do not carry.
ADVANCED MICRO DEVICES, INC.

Moat: Multi-Architecture Product Breadth

AMD competes across datacenter, gaming, and embedded segments simultaneously with a unified architecture roadmap, giving it breadth that narrower specialists cannot match while still investing meaningfully in datacenter accelerator competitiveness against the market leader. That diversification spreads cyclical risk across genuinely uncorrelated end markets and customer segments.
ADVANCED MICRO DEVICES, INC.

Risk: Software Platform Still Maturing

AMD's software platform remains considerably less mature than NVIDIA's despite meaningful recent investment, and that gap continues to influence purchasing decisions among developers already deeply invested in the competing platform's tooling and libraries built and refined by developers over many prior years of sustained investment.

Key Players

NVIDIA Corporation
Advanced Micro Devices, Inc.
Intel Corporation
Qualcomm Incorporated
Huawei Technologies Co., Ltd.

Others

Apple Inc.
MediaTek Inc.
Samsung Electronics Co., Ltd.
Broadcom Inc.
Imagination Technologies Limited
Arm Holdings plc
Amazon.com, Inc.
Alphabet Inc.
Microsoft Corporation
Cerebras Systems Inc.
Graphcore Limited
Biren Technology Co., Ltd.
Moore Threads Technology Co., Ltd.
Tenstorrent Inc.
Shanghai Zhaoxin Semiconductor Co., Ltd.

Recent Developments

MARCH 2025

NVIDIA unveils next-generation datacenter accelerator architecture

NVIDIA disclosed its next-generation datacenter accelerator architecture at its annual developer conference, detailing meaningful performance and power efficiency improvements over the prior generation alongside expanded high-bandwidth memory capacity. This was a product announcement, not a corporate transaction, extending NVIDIA's datacenter product roadmap significantly into the following fiscal year.
Signal: Shows the market leader continuing to extend its architecture and performance lead over competitors on an annual cadence.
OCTOBER 2024

AMD acquires AI infrastructure software company

AMD acquired a privately held AI infrastructure software company specializing in inference optimization and workload orchestration tools for an undisclosed sum. The acquisition was a full corporate purchase, not a licensing arrangement or joint venture, giving AMD direct ownership of the underlying software technology and its associated intellectual property.
Signal: Indicates suppliers increasingly prioritize software platform investment to close the gap with the market leader quickly.
JANUARY 2025

Saudi Arabia and a major chipmaker sign sovereign AI infrastructure agreement

A major chipmaker signed a multi-year framework agreement to supply datacenter accelerators for Saudi Arabia's national AI infrastructure buildout program spanning multiple planned data center campuses. The arrangement was a supply agreement, not an acquisition or joint venture, extending the chipmaker's sovereign customer relationships meaningfully across the broader Gulf region.
Signal: Signals sovereign AI programs increasingly compete directly with commercial hyperscalers for constrained global supplier allocation capacity.

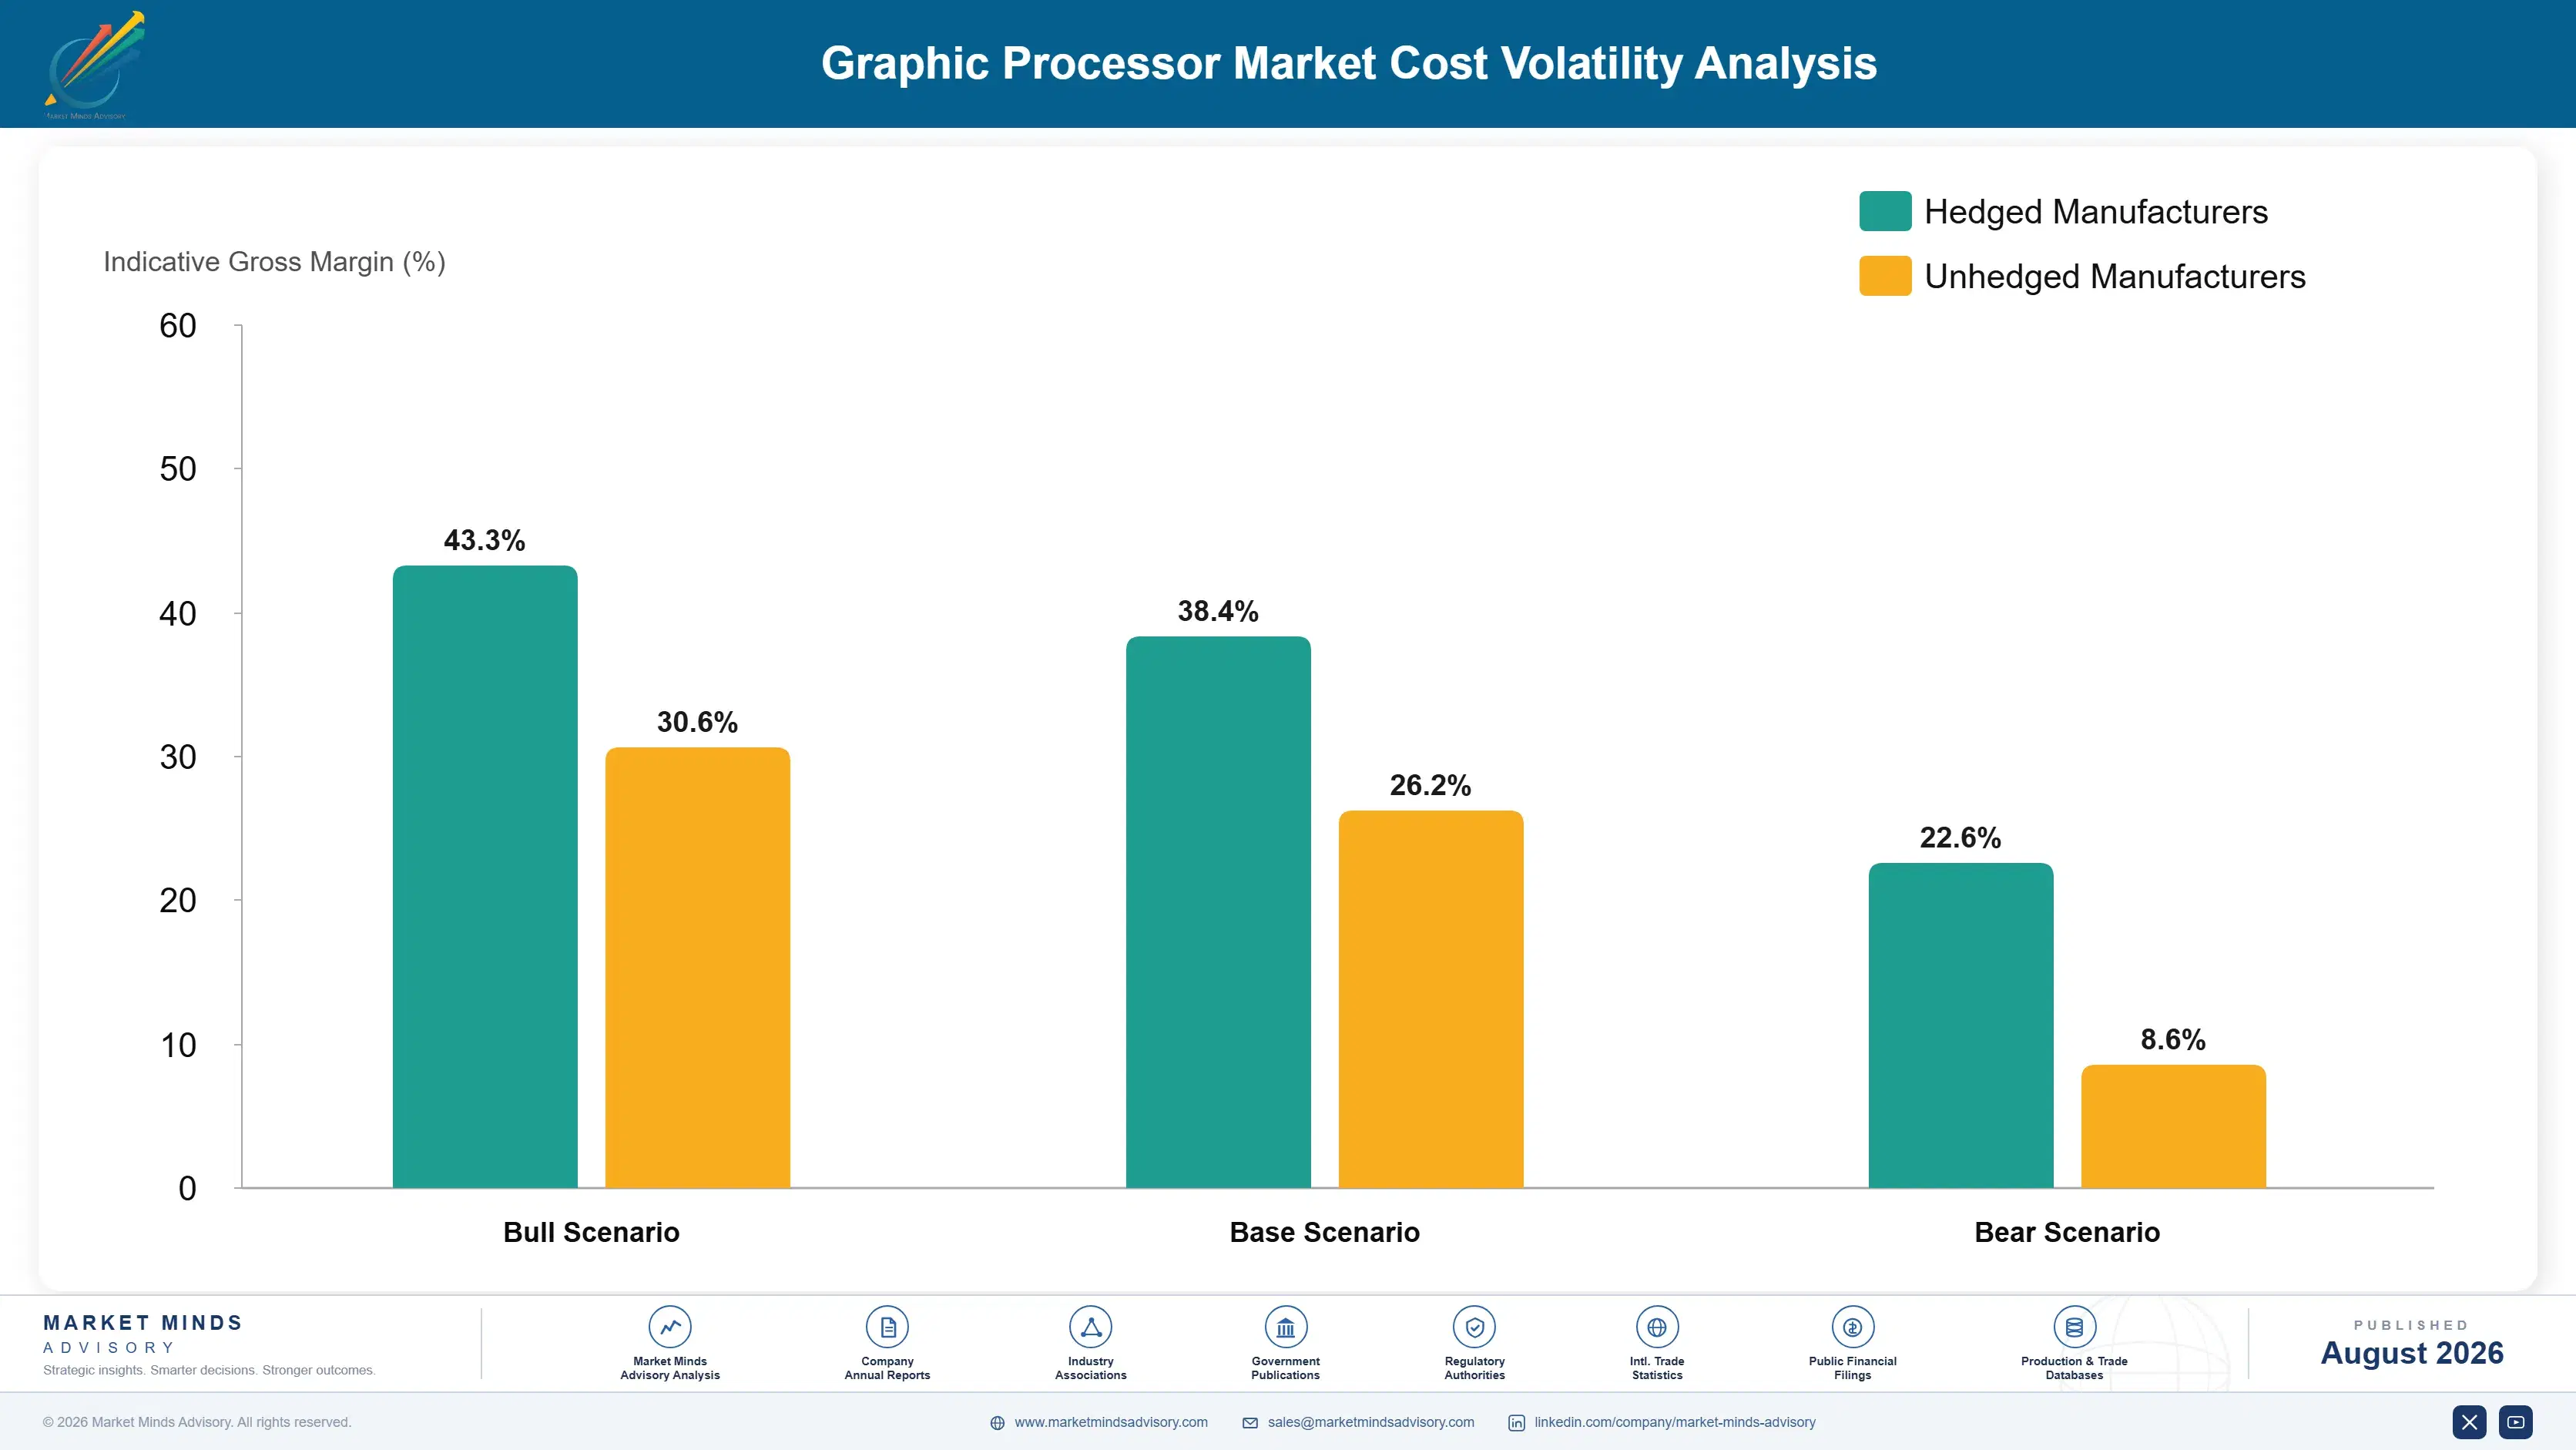
Advanced Wafer and Packaging Cost Exposure

Leading-edge wafer fabrication and advanced packaging together account for roughly 45% to 55% of accelerator system COGS, sourced primarily from TSMC's advanced node capacity in Taiwan and from specialized packaging facilities concentrated in Taiwan and increasingly the United States. High-bandwidth memory adds a further 15% to 20%, sourced from a concentrated set of memory manufacturers in South Korea, Japan, and the United States.
Advanced packaging capacity constraints drove meaningful cost pressure through 2024 as demand for chip-on-wafer-on-substrate assembly outpaced available capacity industry-wide across nearly every major accelerator product line. TSMC's disclosed capital expenditure guidance for 2024 highlighted advanced packaging as a priority investment area specifically to relieve this bottleneck, noting that packaging constraints limited shipment volume more than wafer availability itself throughout the year across most customer accounts.

Smaller specialty accelerator developers carry more exposure than the largest diversified suppliers, since they lack the purchasing scale and long-standing relationships to secure priority allocation from constrained foundry and packaging capacity. Suppliers without long-term capacity agreements face additional exposure to allocation uncertainty, while those with secured multi-year commitments absorb volatility more predictably across their broader production planning cycles.
graphic-processor-market-cost-volatility-analysis-1787301143932

Lock Foundry Capacity Through Long-Term Agreements

Advanced node wafer capacity is the largest single cost and availability constraint across most accelerator product lines, concentrated among very few qualified foundry partners globally. Long-term capacity agreements with volume commitments, common practice among the largest diversified suppliers, secure priority allocation and pricing predictability that smaller competitors relying on spot allocation cannot access reliably.

Diversify High-Bandwidth Memory Sourcing

Reliance on a single high-bandwidth memory supplier concentrates both price and availability risk unnecessarily across an entire accelerator product line. Qualifying secondary memory suppliers across multiple regions, even at modestly higher unit cost, protects continuity when any single supplier faces capacity constraints or a sudden demand spike from competing accelerator programs across the industry.

Invest Directly in Packaging Capacity Expansion

Suppliers that co-invest directly in packaging facility expansion alongside foundry partners secure guaranteed capacity access that pure customers relying on shared allocation cannot match reliably. That direct investment also gives suppliers earlier visibility into capacity timelines, letting them plan product launches with greater confidence than competitors dependent entirely on supplier disclosure and public capacity announcements.

Portfolio Architecture for Margin Defence

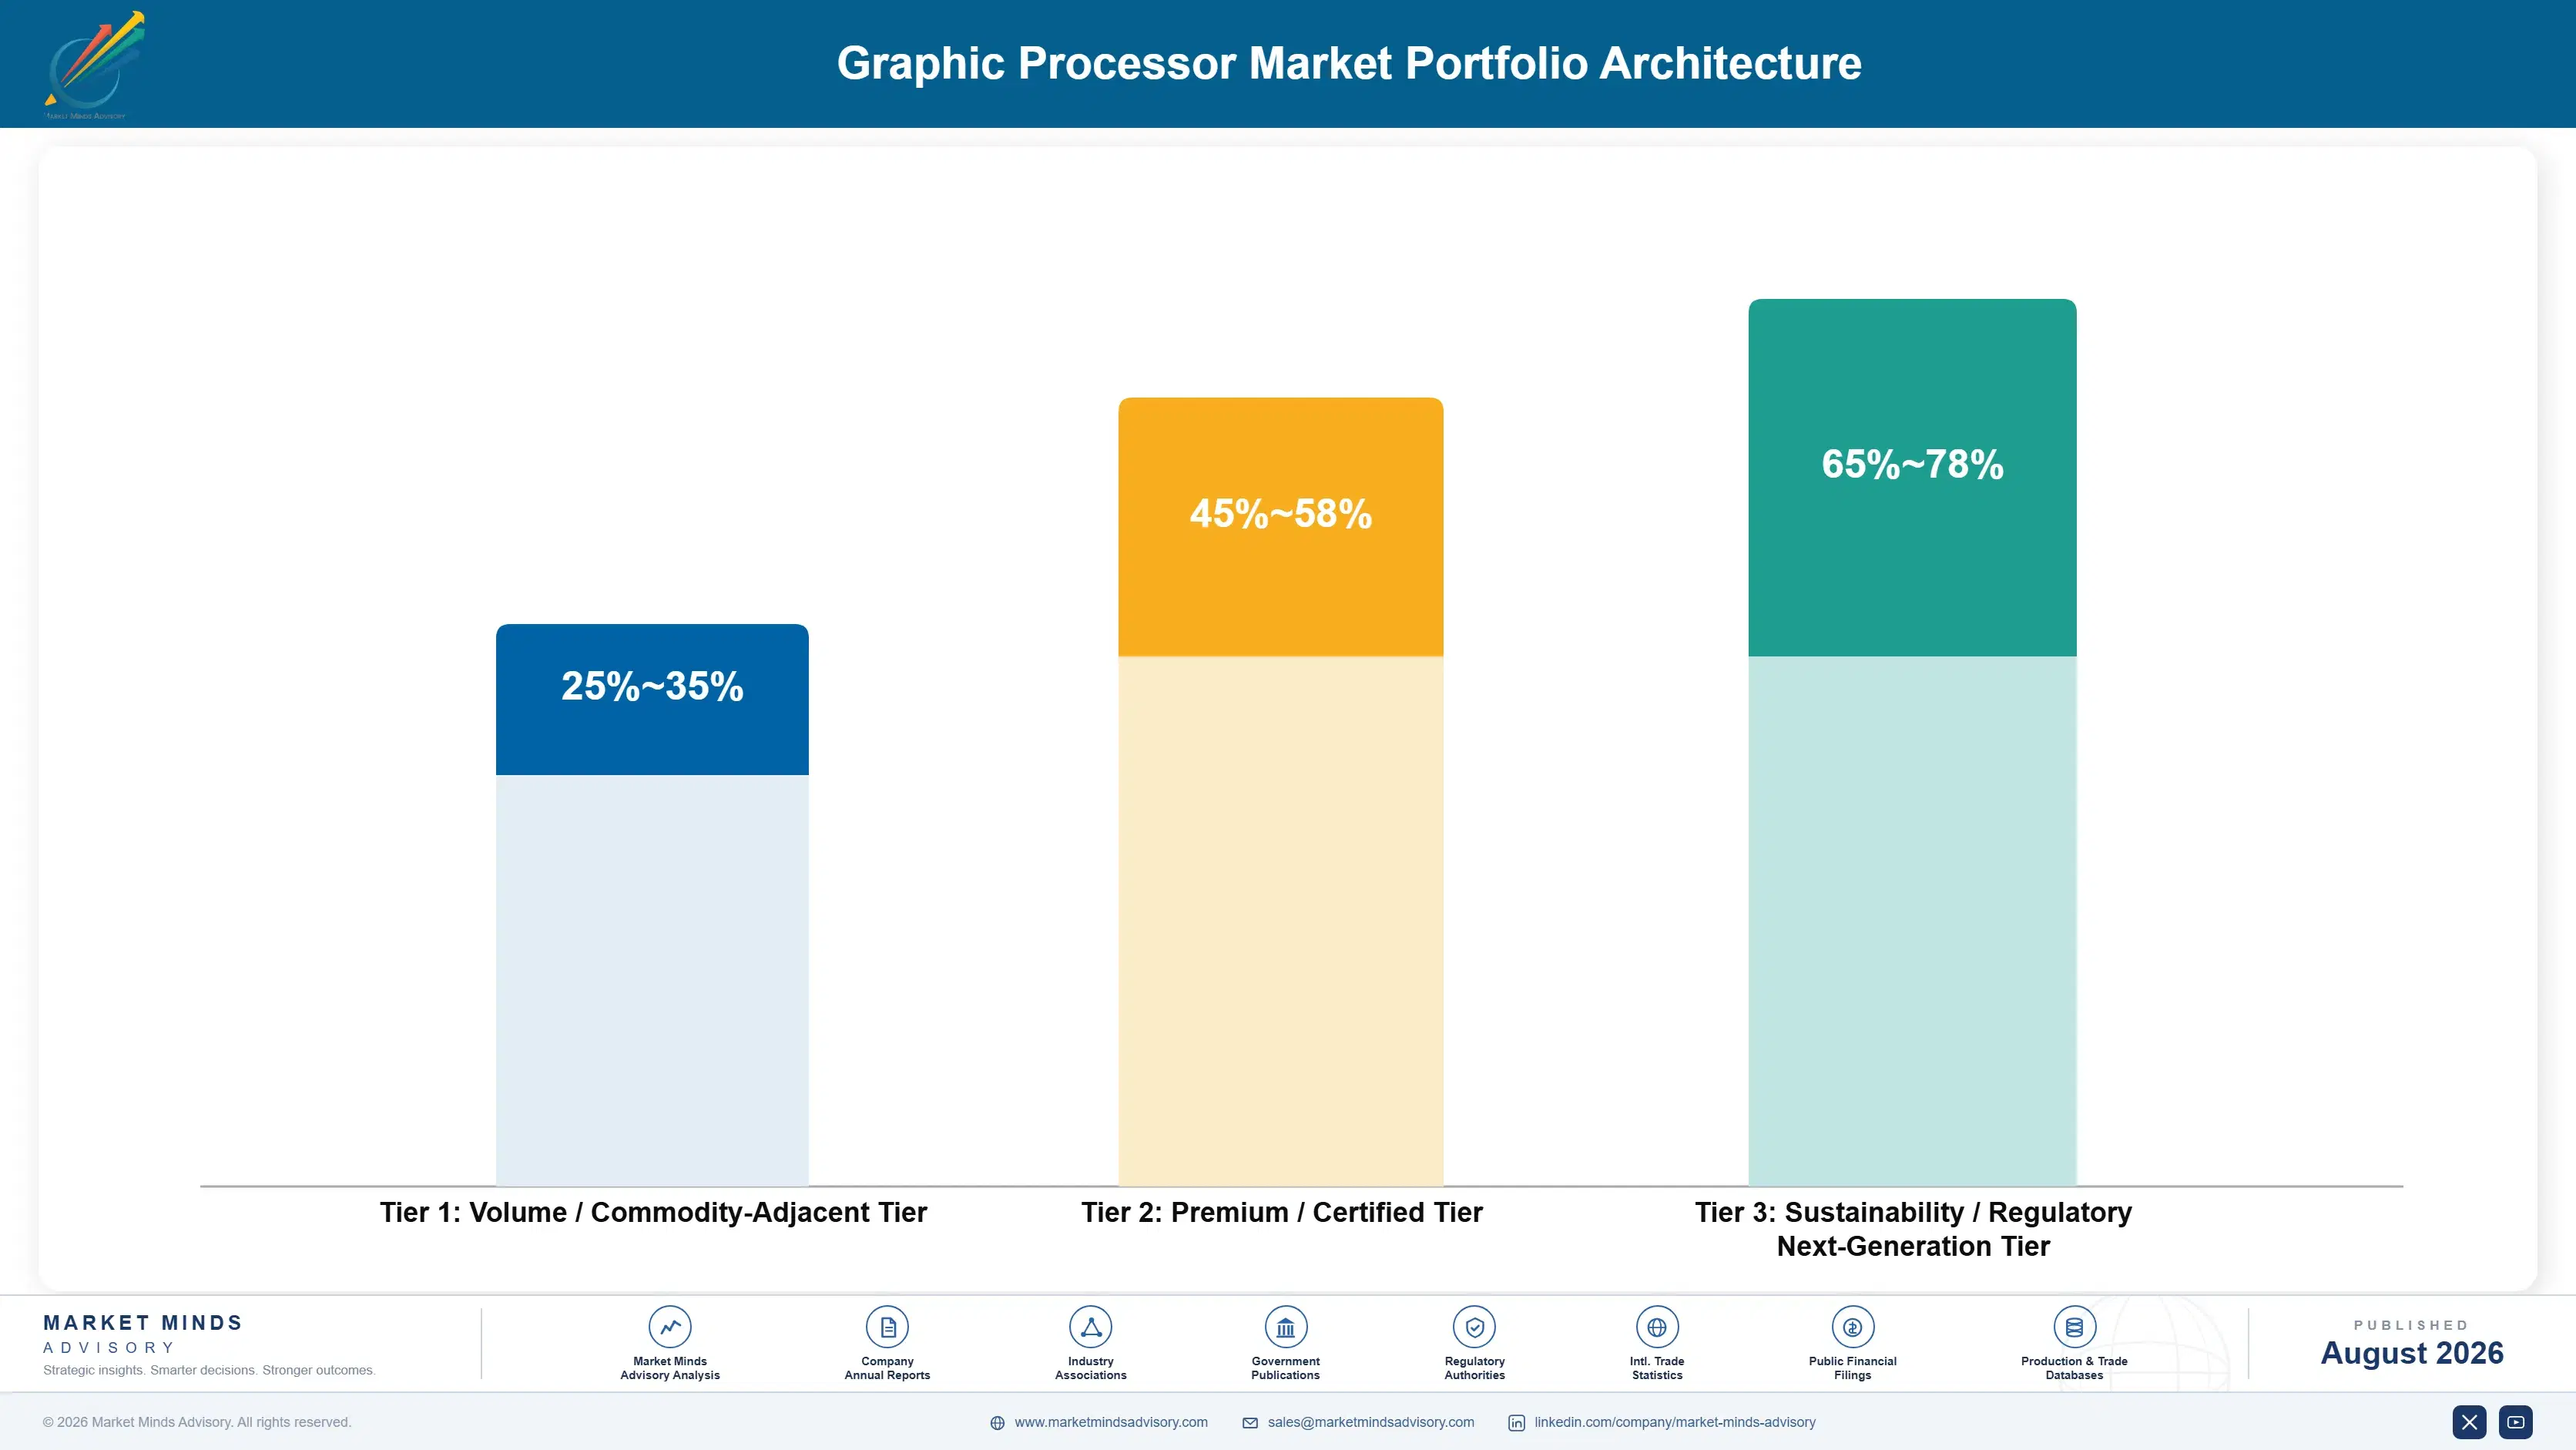
The portfolio splits into three tiers with extreme margin separation tied to compute density and software platform depth. Volume tier products carry mainstream gaming and integrated GPUs competing largely on price. Premium certified products carry professional and workstation accelerators backed by certified software driver support. Sustainability and next-generation products, meaning flagship datacenter AI accelerators, attract the sector's most active research investment and command by far the
The tension between volume and premium runs through nearly every supplier's product roadmap. Volume products fund the manufacturing scale and brand recognition premium products eventually depend on, yet volume margins keep compressing as integrated graphics capture more of the mainstream gaming market. Suppliers that under-invest in premium datacenter capability risk missing the single largest profit pool in the industry, while those chasing premium exclusively struggle to fund the manufacturing base for broader consumer demand.

High-value margin pools concentrate overwhelmingly in datacenter AI accelerators where compute density and software platform maturity carry the largest financial stakes, and where supply constraints alone justify extraordinary pricing power. Gaming and consumer GPUs generate meaningful steady volume but dramatically thinner margin, since that segment competes against a wider set of lower-cost alternatives with adequate but unremarkable performance.

Volume / Commodity-Adjacent Tier

Mainstream gaming and integrated GPUs competing largely on price against a crowded field of value-oriented alternatives offering broadly comparable performance for everyday consumer applications and mainstream entertainment use cases across most price-sensitive market segments.
Gross Margin: 25-35%

Premium / Certified Tier

Professional and workstation accelerators backed by certified software driver support and formal application qualification, commanding meaningful pricing premiums over consumer equivalents across most enterprise design, engineering, and content creation markets.
Gross Margin: 45-58%

Sustainability / Regulatory / Next-Generation Tier

Flagship datacenter AI accelerators still supply-constrained across most major markets, targeting training and inference performance conventional consumer hardware simply cannot achieve at any comparable price point across current or prior generation products.
Gross Margin: 65-78%
graphic-processor-market-portfolio-architecture-1787301144461

High-value Sub-segments and Strategic Watch-out

Flagship Datacenter AI Accelerators

High value and high growth, driven by hyperscaler and sovereign AI infrastructure buildout simultaneously, with software platform and supply chain barriers protecting incumbent suppliers from new entrant price competition on the largest hyperscaler and sovereign accounts worldwide across every major geographic market and infrastructure buildout program.
Gross Margin: 65-78%

Professional Workstation Accelerators

High value with moderate growth, anchored by enterprise design and engineering software certification requirements, where documented driver reliability increasingly decides vendor qualification for large corporate procurement contracts across engineering, architecture, and media production sectors worldwide, from independent design studios to the largest multinational engineering enterprises.
Gross Margin: 45-58%

Mainstream Gaming and Consumer GPUs

The category's largest volume base by unit count, competing on price against a crowded field of value alternatives, generating steady but thin margin as integrated graphics capture more of the entry-level and mainstream consumer market segments across most developed and rapidly emerging consumer electronics markets globally.
Gross Margin: 25-35%

Legacy Single-Purpose Accelerator Designs

Strategic watch-out where general-purpose custom silicon increasingly threatens to displace narrowly specialized accelerator designs across major workload categories, creating genuine technology risk for suppliers slow to adapt their product roadmaps accordingly before losing meaningful share to more flexible, general-purpose rivals entirely across nearly every affected workload category.
Gross Margin: 20-35%

Compute Fleet Economics of Deployment

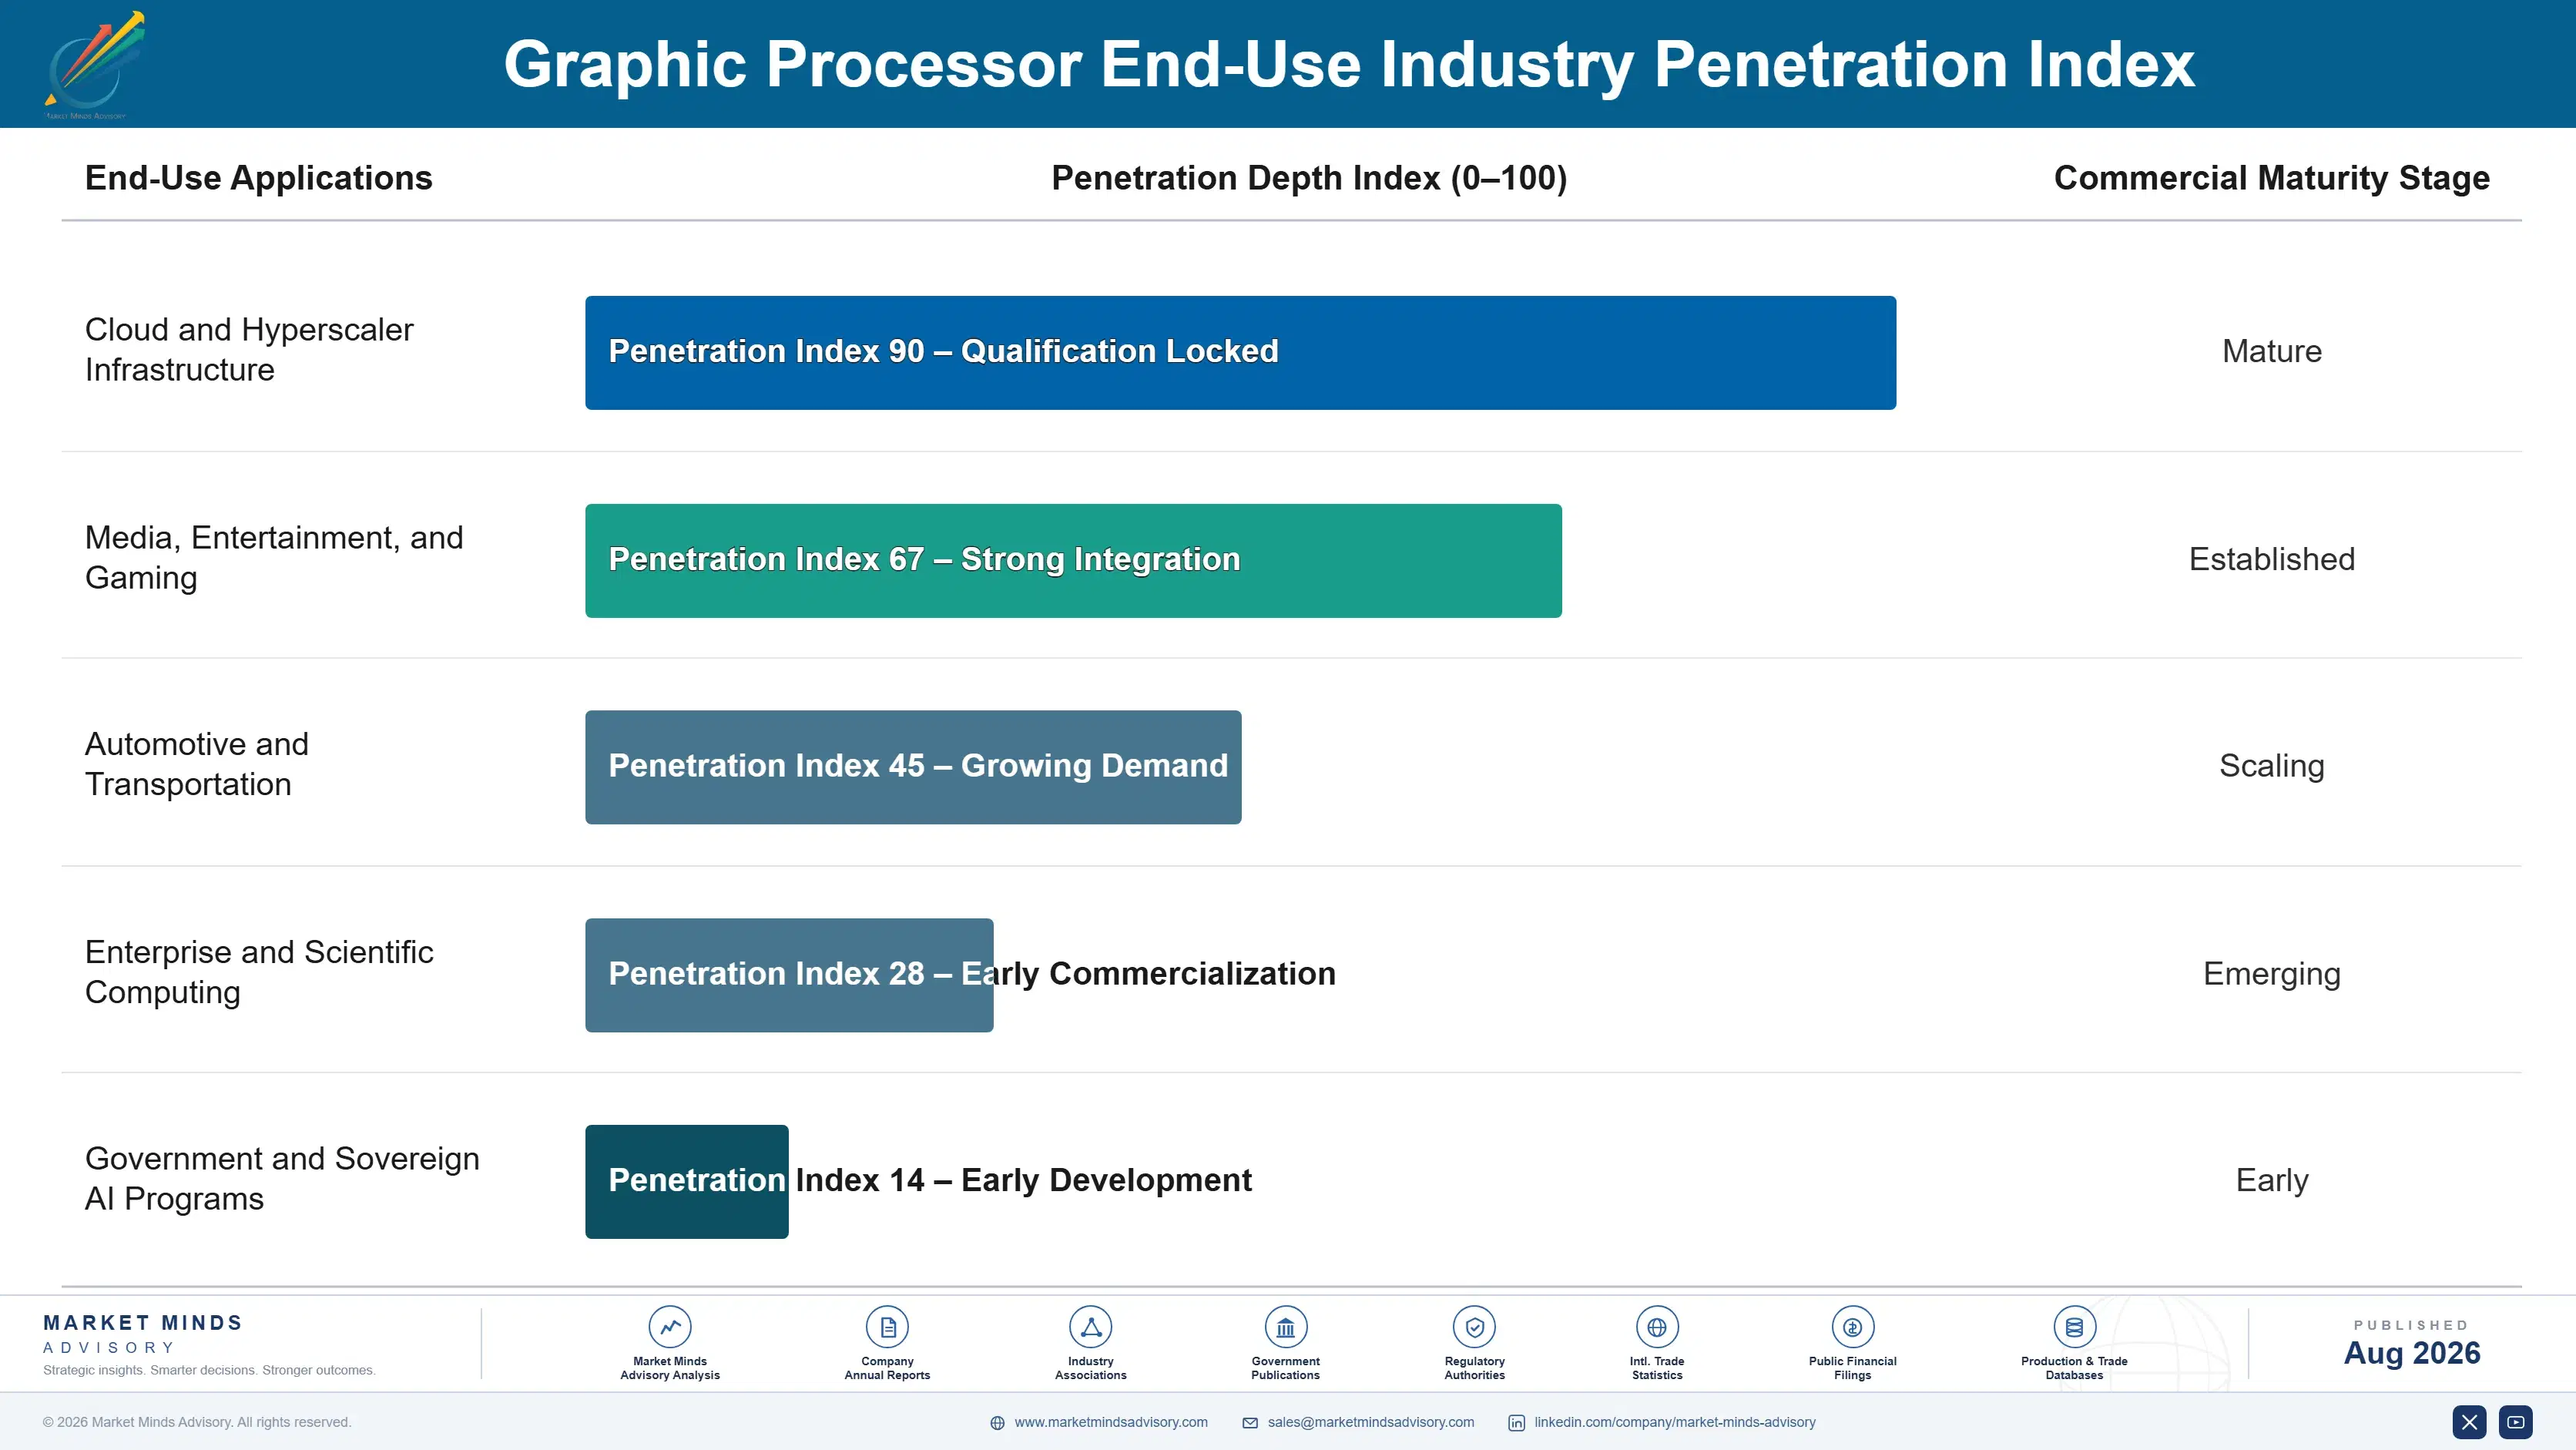
GPU demand behaves like an annuity once a buyer commits to a software architecture, since developers optimize workloads against specific tooling and switching stacks requires costly requalification that most organizations avoid without a decisive reason. That structure rewards incumbency heavily: a supplier that wins the initial platform commitment keeps the customer relationship through multiple hardware refresh cycles unless a competitor demonstrates an overwhelming performance or cost advanta
Adoption depth varies sharply by end-use vertical. Hyperscaler and large enterprise AI deployments have adopted the newest accelerator generations almost immediately upon availability, since compute advantage there translates directly into competitive product capability. Smaller enterprises and research institutions lag well behind, treating flagship hardware as aspirational rather than standard, partly because budget constraints are genuinely tighter and partly because workload scale rarely justifies premium hardware.

Buyer profiles have shifted generationally. Procurement decisions that once sat primarily with individual research teams now route through centralized infrastructure and capital allocation committees at larger organizations, rewarding suppliers able to present integrated total-cost-of-ownership data rather than relationship selling alone. Younger infrastructure engineers entering leadership roles treat compute allocation planning as a core strategic function rather than a routine procurement task.
graphic-processor-market-end-use-penetration-index-1787301144987

MMA's Read on Compute Silicon

These are among the four positions where our research anticipates prominent divergence between winners and laggards over the coming forecast period. Each is grounded in the demand model, the regulatory perimeter, and the announced capacity pipeline.
01 / SOFTWARE PLATFORM STRATEGY

Developer tooling depth will separate winners from commoditized hardware sellers

Raw silicon performance is converging across leading suppliers as manufacturing processes mature, which means suppliers competing solely on benchmark numbers rather than software platform depth will see margin compress steadily over the next several years across most conventional segments. Developer tooling and framework integration create switching costs that persist across multiple hardware generations, a moat pure silicon performance cannot replicate quickly. Suppliers that invest in platform depth now, before rivals establish comparable developer mindshare, will hold accounts competitors cannot easily dislodge for years.
02 / SOVEREIGN COMPUTE POSITIONING

Early sovereign contracts will define share gains through 2036

Sovereign AI infrastructure programs are committing unprecedented capital toward domestic compute capacity, and each program creates a demand wave that rewards suppliers with established government relationships built well ahead of formal procurement processes. Suppliers without sovereign positioning increasingly cannot compete for this segment quickly, since governments prioritize established, trust-verified relationships over unproven newcomers regardless of price offered. Those investing in sovereign relationships now, ahead of competitors still focused purely on commercial hyperscaler accounts, will capture disproportionate share as sovereign programs keep expanding.
03 / ADVANCED PACKAGING INVESTMENT

Supply chain security will decide who actually ships committed volume

Advanced packaging capacity has become the binding constraint across most datacenter accelerator product lines, and suppliers with secured long-term foundry relationships can guarantee delivery timelines that competitors dependent on spot allocation simply cannot match regardless of their architectural quality. Suppliers without secured capacity face allocation uncertainty that erodes customer trust precisely when demand for delivery reliability keeps rising across the industry. Incumbent suppliers with deep foundry relationships are positioned to capture a disproportionate share of this capacity-constrained market for years to come.
04 / CUSTOM SILICON COMPETITION

Hyperscaler in-house chips will permanently reshape merchant silicon economics

Hyperscalers are scaling internal custom silicon programs aggressively, permanently redirecting a meaningful share of their internal workloads away from merchant GPU purchases that they once sourced entirely from third parties by default. That shift is simultaneously freeing merchant suppliers to redirect investment toward sovereign and enterprise accounts where custom silicon competition remains limited by scale and technical resources. The net effect redraws competitive geography in ways unlikely to reverse regardless of future architectural innovation from any single merchant supplier going forward.

Engagement Snapshot From the Field

A live engagement with an industry participant carrying material or product regulatory and market exposure ahead of a defining policy shift, showing how our research translates into a defensible multi-year portfolio strategy.
MARKET MINDS ADVISORY · CLIENT ENGAGEMENT SUMMARY
Graphic Processor Producer Strategic Portfolio Review and Transition Roadmap 2026·Investment Scenario on Graphic Processor Exposure Evaluation 2025-26
CLIENT PROFILE
A regional cloud infrastructure provider serving enterprise customers across a specific geography, reporting approximately 1.4 billion dollars in annual revenue, approached MMA after repeated allocation shortfalls from its primary GPU supplier threatened committed customer AI service level agreements for the coming fiscal year and its broader multi-year growth roadmap across several customer verticals (client-reported, unverified by MMA).
STRATEGIC CHALLENGE
Leadership faced pressure to secure reliable compute allocation without overcommitting capital to hardware that might sit underutilized if customer demand growth moderated unexpectedly. Sales leadership wanted guaranteed capacity to support committed customer contracts, while finance needed a defensible multi-year capital plan that balanced allocation certainty against genuine utilization risk across the fleet.
MMA APPROACH
MMA modeled utilization scenarios across a range of demand growth assumptions, benchmarked multi-supplier diversification strategies against comparable regional cloud providers, and assessed which suppliers offered credible allocation guarantees backed by demonstrated delivery history rather than marketing commitments alone, drawing on comparable engagements MMA had completed across the broader cloud infrastructure sector.
KEY FINDINGS
  1. Diversifying across two suppliers rather than relying on a single primary relationship reduced allocation risk meaningfully without significantly increasing operational complexity for the engineering team.
  2. Signing multi-year volume commitments ahead of announced product launches secured priority allocation that spot-market purchasing could not reliably access during periods of severe shortage.
  3. Utilization modeling showed the client had meaningfully more headroom in its existing fleet than initially assumed, reducing the urgency of the near-term expansion decision (client-reported, unverified by MMA).
  4. Secondary supplier relationships required separate software optimization work that the client had not originally budgeted for in its original transition timeline or budget planning.
CLIENT PROFILE
A regional cloud infrastructure provider serving enterprise customers across a specific geography, reporting approximately 1.4 billion dollars in annual revenue, approached MMA after repeated allocation shortfalls from its primary GPU supplier threatened committed customer AI service level agreements for the coming fiscal year and its broader multi-year growth roadmap across several customer verticals (client-reported, unverified by MMA).
STRATEGIC CHALLENGE
Leadership faced pressure to secure reliable compute allocation without overcommitting capital to hardware that might sit underutilized if customer demand growth moderated unexpectedly. Sales leadership wanted guaranteed capacity to support committed customer contracts, while finance needed a defensible multi-year capital plan that balanced allocation certainty against genuine utilization risk across the fleet.
MMA APPROACH
MMA modeled utilization scenarios across a range of demand growth assumptions, benchmarked multi-supplier diversification strategies against comparable regional cloud providers, and assessed which suppliers offered credible allocation guarantees backed by demonstrated delivery history rather than marketing commitments alone, drawing on comparable engagements MMA had completed across the broader cloud infrastructure sector.
KEY FINDINGS
  1. Diversifying across two suppliers rather than relying on a single primary relationship reduced allocation risk meaningfully without significantly increasing operational complexity for the engineering team.
  2. Signing multi-year volume commitments ahead of announced product launches secured priority allocation that spot-market purchasing could not reliably access during periods of severe shortage.
  3. Utilization modeling showed the client had meaningfully more headroom in its existing fleet than initially assumed, reducing the urgency of the near-term expansion decision (client-reported, unverified by MMA).
  4. Secondary supplier relationships required separate software optimization work that the client had not originally budgeted for in its original transition timeline or budget planning.
RECOMMENDED STRATEGY
Phase 1: Phase 1 (0 to 6 months): Optimize utilization across the existing fleet to capture identified headroom before committing to new hardware purchases. Phase 2: Phase 2 (6 to 18 months): Establish a secondary supplier relationship with multi-year volume commitments, prioritizing the highest-demand workload categories first. Phase 3: Phase 3 (18 to 36 months): Build software portability across both supplier architectures to preserve negotiating leverage at future contract renewal points.
OUTCOME
The provider avoided a near-term capital commitment that utilization modeling showed was not yet necessary, while securing a secondary supplier relationship that has since provided meaningful allocation flexibility during subsequent industry-wide shortage periods across multiple customer product categories and geographic markets served (client-reported, unverified by MMA).

Frequently Asked Questions

Foundational context covering the market sizes, CAGR, scope, country, region and competition that inform every finding below. This section is provided to cover basics and most often pre-purchase conversations, answered from the MMA Primary Research Dataset.

What is the current size of the Graphic Processor Market?

The market reached an estimated 115.0 billion dollars in 2025. That figure reflects global revenue across datacenter, gaming, professional, mobile, automotive, and cloud gaming GPU applications.

How large will the Graphic Processor Market be by 2036?

MMA projects the market will reach approximately 380.8 billion dollars by 2036 under the base case scenario. That represents roughly 2.97 times the 2026 market value.

What is the CAGR for the Graphic Processor Market 2026 to 2036?

The base case CAGR is 11.5% annually across the full ten-year forecast period. Bull and bear scenarios run 12.8% and 10.2% respectively, reflecting AI infrastructure spending uncertainty.

Which segment is growing fastest?

Datacenter and AI accelerator GPUs grow fastest at 22.0% CAGR, about 1.91 times the overall market rate. Large language model training and inference demand is the primary driver.

Who are the major companies in the Graphic Processor Market?

NVIDIA, AMD, Intel, Qualcomm, and Huawei lead the category by a consistent revenue basis. Together they hold roughly 82% of global graphic processor revenue combined.

Which country is growing fastest?

India leads national growth at an estimated 16.5% CAGR, driven by expanding cloud infrastructure investment from both domestic companies and international hyperscalers. Data center buildout keeps accelerating.

Report Segmentation Architecture

The full report scope spans multiple orthogonal segmentation dimensions, with cross-tabulated demand data provided for each dimension pair. Coverage extends further to regional breakdowns, trend trajectories, and the competitive detail needed to support segment-level decision-making.

By End-Use Application

  • Datacenter and AI Accelerator GPUs
  • Gaming and Consumer Desktop GPUs
  • Professional Workstation GPUs
  • Mobile and Laptop GPUs
  • Automotive and Embedded GPUs
  • Cloud Gaming and Virtualized GPUs

By End-Use Industry

  • Cloud and Hyperscaler Infrastructure
  • Media, Entertainment, and Gaming
  • Automotive and Transportation
  • Enterprise and Scientific Computing
  • Government and Sovereign AI Programs

By Commercial Dimension

  • Direct Hyperscaler Contract Sales
  • OEM and Device Integration Sales
  • Distributor and Channel Sales
  • Custom Silicon Design Partnerships

By Region

  • North America
  • Western Europe
  • East Asia
  • South Asia and Pacific
  • Latin America
  • Middle East and Africa
  • Eastern Europe

Scope, Methodology, and Coverage

Every figure in this report is reproducible from documented input assumptions. The scope below maps the historical period, the forecast horizon, the segmentation dimensions, and the countries covered, alongside the underlying primary and qualitative methodology.
Historical Period
2020 to 2025
Forecast Period
2026 to 2036
Base Year
2025 (USD billions; MMA Primary Research Dataset, August 2026)
Market Definition
The graphic processor market covers discrete and integrated GPUs and AI accelerators used for datacenter training and inference, gaming, professional visualization, mobile computing, automotive, and cloud gaming applications. It includes chip sales, associated software licensing, and custom silicon design partnerships. General-purpose CPUs, standalone memory products, and networking silicon are excluded unless integrated directly into a graphics processing package.
Quantitative Units
USD billions (current prices); unit shipment volume where applicable
Segmentation Dimensions
By End-Use Application; By End-Use Industry; By Commercial Dimension; By Region
Regions Covered
North America, Western Europe, East Asia, South Asia and Pacific, Latin America, Middle East and Africa, Eastern Europe
Countries Covered
USA, China, Germany, France, UK, Japan, South Korea, India, Australia, Canada, Brazil, Mexico, Indonesia, Vietnam, Thailand, Malaysia, UAE, Saudi Arabia, South Africa, Nigeria, Turkey, Poland, Netherlands, Italy, Spain, Sweden, Switzerland, Argentina, Colombia, Singapore, and additional markets relevant to this sector
Key Companies Profiled
NVIDIA Corporation; Advanced Micro Devices, Inc.; Intel Corporation; Qualcomm Incorporated; Huawei Technologies Co., Ltd.; Apple Inc.; MediaTek Inc.; Samsung Electronics Co., Ltd.; Broadcom Inc.; Imagination Technologies Limited; Arm Holdings plc; Amazon.com, Inc.; Alphabet Inc.; Microsoft Corporation; Cerebras Systems Inc.; Graphcore Limited; Biren Technology Co., Ltd.; Moore Threads Technology Co., Ltd.; Tenstorrent Inc.; Shanghai Zhaoxin Semiconductor Co., Ltd.
Quantitative Methodology
Primary survey, n=3,800 respondents, Q4 2025, six countries; demand-side model with trade association cross-validation
Qualitative Methodology
47 expert interviews, Q4 2025; applied to validate demand model assumptions, identify emerging dynamics, and assess competitive positioning
Report Format
PDF and XLSX data workbook (Word format preview document)
Publisher
Market Minds Advisory
Report Code
MMA-2026-TEC-201
Published
August 2026
Contact
sales@marketmindsadvisory.com | www.marketmindsadvisory.com

Purchase the full Graphic Processor Market Report (2026 to 2036).

The full MMA Graphic Processor report sizes the market across six application categories, five end-use industries, four commercial contracting models, and seven regions through 2036. It profiles twenty participants on a consistent basis of graphic processor revenue, scoring the top five on software platform depth, advanced packaging supply security, and sovereign contract positioning. Scenario models quantify how hyperscaler capital expenditure, custom silicon adoption, and export control policy move both demand and achievable pricing. The report also includes delivered cost modeling by application category, a sovereign AI program tracker across major markets, and a supplier displacement risk assessment built for buyers, suppliers, and investors.
Six-segment application demand model through 2036
Sovereign AI infrastructure investment program tracker
Software platform competitive positioning assessment tool
Advanced packaging capacity benchmarking dataset and analysis
Wafer and packaging cost sensitivity model
Supplier displacement risk scoring by application

Built For The People Who Decide

From boardroom strategy to bench-side execution, this report is read cover-to-cover by leaders shaping the next decade of their industry, turning demand scenarios, market dynamics and valuation benchmarks into decisions.
CXOs/ Presidents/ VPs/ Managers
M&A and Corporate Development
Strategy Teams and R&D Heads
Procurement and Product Directors
Regulatory and Compliance Leaders
Investor Relations and Equity Analysts