Market Minds Advisory
Food & Beverage Industrial Disinfection and Cleaning Market

Food & Beverage Industrial Disinfection and Cleaning Market: Food & Beverage Industrial Disinfection and Cleaning Market: The Chemical Is The Cheap Part

Chemistry accounts for roughly 14% of what cleaning actually costs a food plant. The other 86% is water, heat and the 17% of available line hours during which nothing whatsoever is being produced.

Lead Analyst

Published

August 2026

Make Smarter Decisions with Customized Research Insights

Request a free sample report and evaluate market opportunities, growth trends, and competitive dynamics relevant to your business needs.

2025 MARKET VALUE$12.8BMarket Size 2025
2036 FORECAST VALUE$25.3BBase Case , 2026 to 2036
CAGR 2026 TO 20366.4 %Bull 7.6% / Bear 5.2%
INCREMENTAL OPPORTUNITY$11.7BNet 10- year value creation
EXPANSION MULTIPLE1.86x2036 value over 2026 base
Strategic Levers
M&A Pipeline
Regional Outlook
Country Rankings
Competitive Intelligence
Segmental Deep-dive
Call-Us : 91 93563 13602

Executive Snapshot and Market Trajectory.

Plants buy chemistry and then pay for downtime. Cleaning consumes around 17% of available line hours and the chemical accounts for roughly 14% of total cleaning cost, which means any supplier arguing about drum price is arguing about entirely the wrong number.
East Asia holds 28% of value on processing capacity that keeps expanding, with Western Europe at 25% on regulatory intensity and dairy density behind it. Dry cleaning and low-moisture sanitation grows at 9.6%, half again the market rate of 6.4%, because in a powder or chocolate plant water is the hazard rather than the tool anybody wants. Chemical volume simply tracks the processing output and barely moves at all in either direction otherwise here.
Concentration reaches only 42%, low for a technical category, since regional formulators compete effectively on service response and local plant knowledge. Regulation drives specification, with FSMA preventive controls and EU hygiene requirements both pushing environmental monitoring programmes alongside the chemistry rather than in place of it. Retailer audit requirements now move faster than regulation does and reach further into supplier plants, which is where the practical standard gets set.
Market Definition
The market covers cleaning and disinfection chemicals, systems and verification services supplied to industrial food and beverage processing operations, spanning clean-in-place chemical programmes, open plant and foam cleaning chemicals, dry cleaning and low-moisture sanitation, automated dosing and control systems, environmental monitoring and verification services, and water recovery and rinse reuse systems. Retail and foodservice cleaning products, water treatment chemicals for boiler and cooling duty, packaging sterilisation consumables sold with filling equipment, personal hygiene products, and pest control services are excluded.
Base Year Value
$12.8B in 2025 (MMA Primary Research Dataset, August 2026)
Forecast Period
2026 to 2036, eleven discrete annual values
CAGR
6.4% base case. Bull 7.6%. Bear 5.2%.
Fastest Growth Segment
Dry Cleaning and Low-Moisture Sanitation: 9.6% CAGR
Fastest Growth Country
India: 8.4% CAGR
Fastest Growth Region
South Asia and Pacific: 8.6% CAGR
Largest Region
East Asia: 28% of 2025 global value
Market Leaders
Ecolab, Solenis, Kersia, Christeyns, Evonik. Source: MMA Analysis based on disclosed food and beverage hygiene and cleaning revenue, company annual reports 2025.
Primary Survey
n=3,800 procurement and R&D decision-makers, Q4 2025, six countries
Methodology
Demand-side build-up, cross-validated against public data, 47 expert interviews

Food & Beverage Industrial Disinfection and Cleaning Market Forecast Scenarios

food-beverage-industrial-disinfection-and-cleaning-size-forecast-scenario-1787719725598
Growth from 2020 to 2025 ran at 5.2% and split unevenly across the category. Chemical volumes tracked processing output and grew slowly. Verification services grew considerably faster as retailer audit requirements tightened and environmental monitoring moved from an occasional exercise to a documented weekly programme. Dry cleaning capability grew fastest of all, following a series of low-moisture product recalls that made wet cleaning in dry plants look like a hazard.
The 6.4% base case rests on three mechanisms. Automated phase control based on conductivity and turbidity measurement rather than fixed timers keeps spreading, because it cuts cycle time, which is what actually costs money. Dry sanitation capability keeps expanding across low-moisture processing. And water recovery in final rinse keeps advancing as cleaning remains the largest single water consumer at most sites. None of the three depends on new chemistry at all.
The bull case at 7.6% assumes a significant listeria or salmonella event in low-moisture processing accelerates dry sanitation investment across the sector, which is how previous step changes here happened. The bear case at 5.2% is processors deferring automation and control investment and continuing to clean on fixed timers, which costs them more and requires no capital approval.

Hours Lost, Not Litres Bought

A clean-in-place cycle runs pre-rinse, caustic, intermediate rinse, acid, final rinse and sanitiser, and every stage consumes water, heat and time while producing nothing. Caustic runs around 1.5% at roughly 78 degrees. Across a dairy or beverage site the whole sequence takes about 17% of available line hours. That is the number a plant manager thinks about, and the chemistry cost barely touches it.
FIVE-FIRM CONCENTRATION42%Share of category revenue held by the largest hygiene suppliers
PRODUCTION TIME CLEANING17%Available line hours consumed by cleaning rather than production
CIP CAUSTIC CONCENTRATION1.5%Typical alkaline strength through the main cleaning stage
CHEMICAL SHARE OF COST14%Portion of total cleaning cost the chemistry actually represents
PLANT WATER SHARE31%Site water intake taken by cleaning and rinsing operations
CIP CYCLE TEMPERATURE78 CHeat required through the main alkaline recirculation stage
Which is why cycle time is the commercial battleground. Most plants still clean on fixed timers set years ago with generous safety margins built in. Conductivity and turbidity instruments can end each phase on measurement rather than on a clock, which typically removes 20 to 30% of cycle duration. The chemistry barely changes. The recovered production hours are worth many times the chemical spend.
Dry processing is a different business entirely and gets treated as the same one far too often. In powder, chocolate and cereal plants, introducing water creates exactly the conditions salmonella needs in equipment that then dries out around it. Cleaning there means vacuum, brush, compressed air and alcohol-based sanitisers. A wet clean in a dry plant is not a compromise; it is an active hazard.
"Every supplier in this category sells on cost per litre and every customer is actually buying back production hours. The two conversations have almost nothing to do with each other, and the gap between them is where most of the available margin has been sitting for twenty years."
Principal Analyst, Process Hygiene Practice · MMA Specialty Chemicals and Hygiene Services Practice · August 2026

Market Trends

Measurement Replaces Timers In Cycle Control

Conductivity and turbidity instruments end each cleaning phase when the measurement confirms the phase has finished rather than when a fixed timer expires, which typically removes 20 to 30% of cycle duration without changing the chemistry at all. Most plants still run timers set years earlier with generous margins. The recovered production hours are worth considerably more than the entire chemical spend, and the instruments cost very little by comparison with anything else on the line. Nobody has to change a single thing about what they are actually buying here.
Market Impact: Runs 400 environmental swabs every week
Dry Sanitation Separates From Wet Cleaning Entirely

Low-moisture processing in powder, chocolate and cereal plants requires vacuum, brush, compressed air and alcohol-based sanitisers, because introducing water creates precisely the conditions salmonella needs in equipment that subsequently dries out around it. That segment grows at 9.6%. Suppliers built around liquid chemistry find they have very little to sell into it, and the required competence is procedural and equipment-based rather than formulation-based in any meaningful sense. The competence needed is procedural rather than chemical, which is why sanitation contractors rather than chemical suppliers are winning most of this work.
Market Impact: Addresses 31% of site water

Market Opportunities and Growth Drivers

Environmental Monitoring Becomes A Documented Weekly Obligation

FSMA preventive controls and EU hygiene requirements both expect environmental monitoring programmes with documented sampling, and retailer audits enforce them more aggressively than regulators do. Swab counts at a mid-sized ready-to-eat plant now run to around 400 weekly, with whole genome sequencing used to trace persistent strains back to their harbourage points. That converts verification from an occasional exercise into a recurring service line that suppliers can hold for years. A processor cannot quietly stop a programme its largest customer expects to see documented every single week of the year.
Market Impact: Argues over 14% of cost

Water Constraint Pushes Rinse Recovery Into Scope

Cleaning takes around 31% of site water intake at a typical processing plant, which makes it the largest single consumer and therefore the first target whenever water becomes scarce or expensive. Final rinse water is clean enough to serve as the next cycle's pre-rinse with minimal treatment, and recovery systems capture that directly. Regulatory acceptance varies by jurisdiction and product category, which slows adoption more than the engineering ever does. Cleaning is the first place anybody looks when water becomes scarce or expensive at almost any large processing site anywhere.
Market Impact: Requires 15% maximum storage concentration

Market Restraints and Challenges

Cost Per Litre Is The Wrong Conversation

Procurement buys hygiene chemistry on unit price because that is the line item visible on a purchase order, while the chemical represents roughly 14% of what cleaning actually costs. Root cause is that downtime, water and energy sit in different budgets nobody consolidates. Commercial impact is that suppliers compete on the least valuable dimension available. Mitigation runs through total cost modelling that a few suppliers present well and most do not attempt at all. Suppliers end up competing very hard over the least valuable single number on the whole page.
Market Impact: Cuts cycle duration by 25%

Peracetic Acid Works Well And Handles Badly

Peracetic acid displaced chlorine across many applications because it is effective at low temperature, breaks down to acetic acid and water, and forms no chlorinated by-products anybody has to explain. Root cause of the difficulty is that it is corrosive, hazardous at concentration and unmistakably unpleasant in confined areas. Commercial impact is handling and storage cost. Mitigation involves on-site generation and closed dosing, both of which require capital that smaller processors rarely commit. Smaller processors continue storing drummed solution and accepting the handling risk that comes attached to it instead.
Market Impact: Grows dry sanitation at 9.6%
3 additional market trends, 4 additional growth drivers, and 2 additional restraints and challenges are covered in the full report. Contact sales@marketmindsadvisory.com to access the complete intelligence.

Segment CAGR and Growth Architecture

Segmentation follows the type of offering supplied: what the processor buys and how it is delivered into the plant. Six categories cover the market without overlap. End-use processing sector, plant scale and contracting model are treated as separate commercial dimensions throughout this report rather than as segmentation logic in their own right entirely here.
food-beverage-industrial-disinfection-and-cleaning-market-share-analysis-1787719725878

Dry Cleaning and Low-Moisture Sanitation

Vacuum, brush, compressed air and alcohol-based sanitation for powder, chocolate, cereal and other low-moisture processing grows at 9.6%, half again the market rate of 6.4%, because water introduced into those plants creates exactly the conditions salmonella needs in equipment that then dries out around it. Competence here is procedural and equipment-based rather than formulation-based, which means suppliers built entirely around liquid chemistry discover they have remarkably little to sell into the fastest growing part of their own market. Specialist sanitation contractors are taking these accounts now while chemical suppliers work out what they could reasonably sell into a plant where the whole point is keeping water out of it entirely.
CAGR 9.6%

Automated Dosing and Control Systems

Conductivity and turbidity based phase control grows at 8.4% by ending each cleaning stage on measurement rather than on a timer, which removes 20 to 30% of cycle duration and returns production hours worth many times the chemical spend. Instrument cost is modest against everything else on a processing line. Adoption is slowed by the fact that timer-based cycles run acceptably and nobody is required to change them, so the case has to be made commercially rather than through any compliance requirement. Deferred decisions here are considerably harder to explain than most capital cases, since the payback arrives in recovered production hours almost immediately after the system has been commissioned.
CAGR 8.4%
Full segment breakdown across 6 segments available in the complete report.

Regional Architecture and Country Demand Map

Geography follows installed processing capacity and the intensity with which hygiene requirements are enforced. East Asia leads on processing volume, Western Europe on regulatory and audit pressure, and India grows fastest from a modest base. Chemical intensity per tonne processed varies enormously between all of them.

North America

FSMA preventive controls set the compliance floor and retailer audit programmes set the practical standard, which sits considerably above it in most ready-to-eat categories. Environmental monitoring is well established, with whole genome sequencing used routinely to trace persistent listeria strains back to harbourage points in drains and equipment framework. Dry sanitation capability developed early here following low-moisture recalls that reshaped how the sector thinks about water. Meat and poultry processing consumes substantial volume in open plant and foam cleaning chemistry. Water recovery has advanced less here than in water-scarce regions, since abundant supply at most processing locations has kept the payback period on rinse reuse investment longer than plant capital committees will accept.
Share: 24% | CAGR: 5.6% (2026 to 2036)

Western Europe

Dairy and brewing density drives clean-in-place consumption, with processing sites running cycles frequently enough that recovered cycle time translates directly into meaningful production volume. Regulatory intensity is high and audit pressure from retailers is higher still, particularly across private label supply. Water scarcity in southern Europe has pushed rinse recovery further here than anywhere else. Regional formulators compete effectively against the multinationals on service response, which is why concentration stays lower than the technical content would suggest. Dry sanitation adoption lags North American practice somewhat, largely because low-moisture processing represents a smaller proportion of regional output and the recalls that changed thinking elsewhere happened predominantly on the other side of the Atlantic.
Share: 25% | CAGR: 4.8% (2026 to 2036)
Regional intelligence for 5 additional markets available in the complete report: East Asia, South Asia and Pacific, Latin America, Middle East and Africa, Eastern Europe. Contact sales@marketmindsadvisory.com.
food-beverage-industrial-disinfection-and-cleaning-country-cagr-analysis-1787719726172

Sell The Hours Back To Them

Cleaning takes 17% of line hours, chemistry is 14% of cleaning cost, water is 31% of site intake and dry sanitation grows at 9.6%. Four levers work on cycle time, verification recurrence, dry capability and water recovery rather than on unit chemical pricing, which is the one place where absolutely everybody else already competes.

Price Recovered Production Hours, Not Litres

Measurement-based phase control removes 20 to 30% of cycle duration, and at 17% of line hours consumed by cleaning that returns production capacity worth several times the entire chemical spend at most sites. Suppliers who model that and present it against the plant's own throughput value win on a dimension procurement cannot benchmark. Those quoting cost per litre compete against every regional formulator on the one measure where none of them can differentiate. Nobody has ever benchmarked recovered production hours across suppliers, because no purchase order records any of them.
Market Impact: Returns 25% of the total cleaning cycle duration

Convert Verification Into A Recurring Service Line

Environmental monitoring now runs to around 400 swabs weekly at a mid-sized ready-to-eat plant, with sequencing used to trace persistent strains to their harbourage points. That is recurring, audit-driven and effectively impossible for a processor to stop once retailer programmes expect it. Suppliers holding the monitoring hold the relationship, because the swab data explains why the chemistry is specified the way it is and nobody else has that evidence. A verification contract renewed on audit calendars rather than purchasing cycles behaves quite differently from the way any chemical supply agreement does.
Market Impact: Runs around 400 verification swabs every single week

Build Dry Sanitation Capability Before Competitors Do

Low-moisture sanitation grows at 9.6% and requires vacuum, brush, compressed air and procedural competence rather than liquid formulation, which means chemistry-led suppliers hold almost nothing that sells into it. Building the capability means equipment, training and validated procedures rather than product development. Suppliers who do it reach the fastest growing segment of the category; those who do not watch specialist sanitation contractors take that work permanently away from them. Equipment and validated procedure are what has to be built here, and neither of those is a formulation problem anybody can solve in a laboratory.
Market Impact: Reaches a whole segment growing at 9.6% annually

Attach Water Recovery To Every Cycle Review

Cleaning takes around 31% of site water intake, which makes it the first place anybody looks when water gets scarce or expensive, and final rinse water is clean enough to serve as the next cycle's pre-rinse after minimal treatment. Recovery systems are engineering rather than chemistry, and suppliers reviewing cycles anyway are already standing in the right place. Regulatory acceptance varies by product category and slows adoption more than the engineering does. Nobody else in the plant is having that conversation with anything like the same degree of credibility either.
Market Impact: Recovers up to 31% of site water intake

Who Controls the Margin Pool

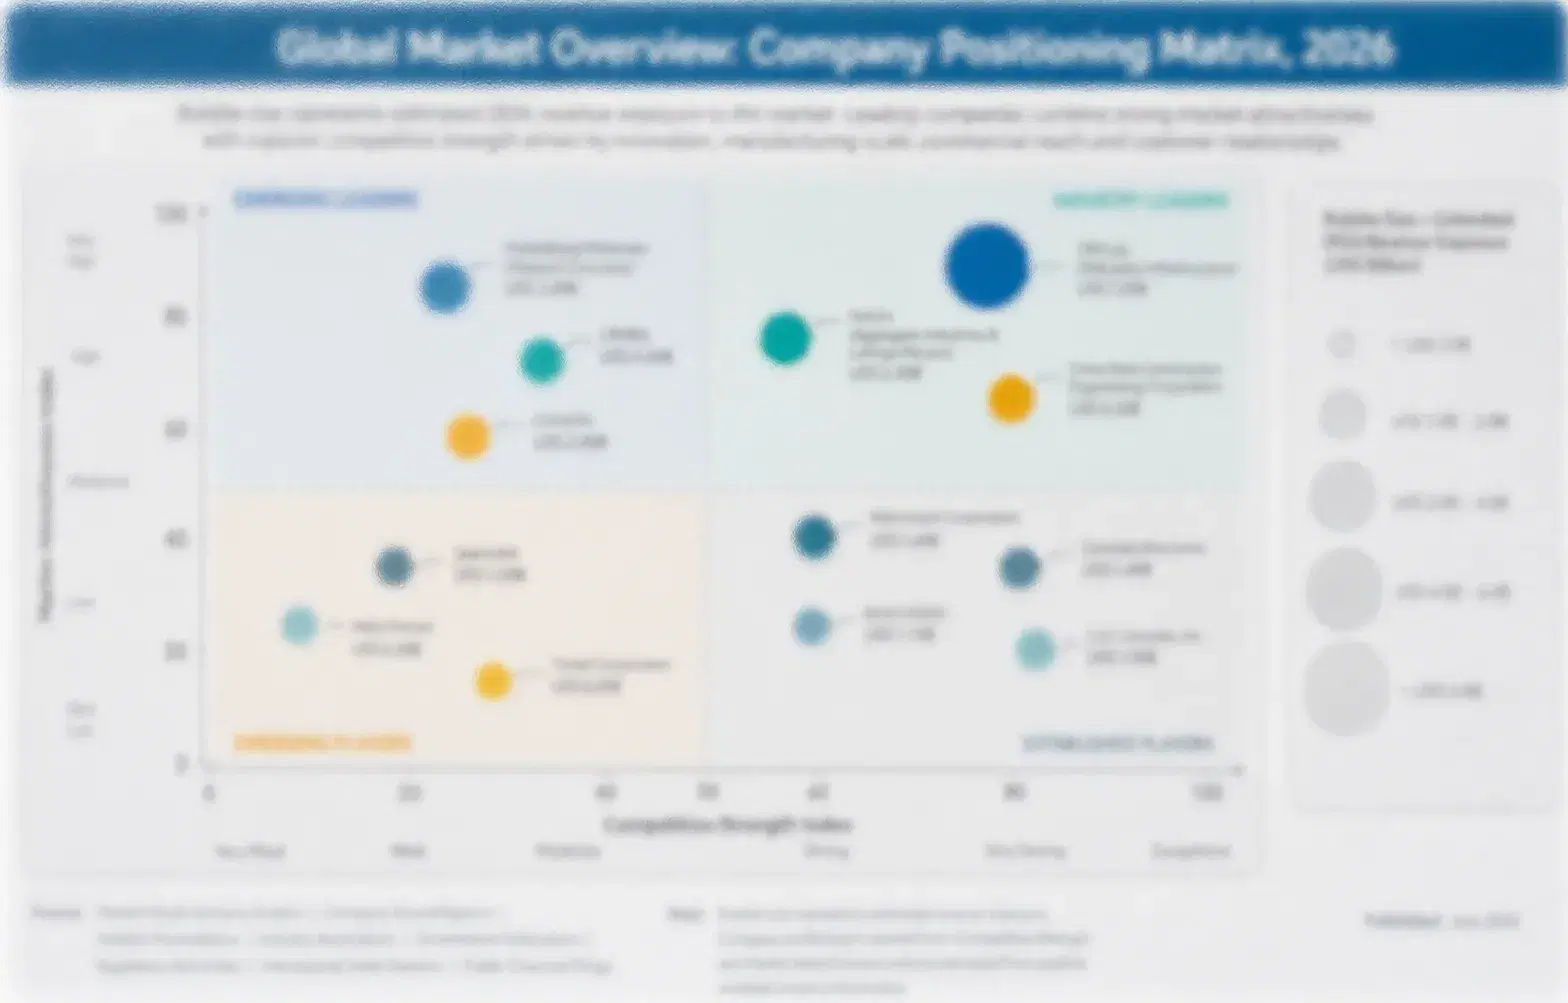
Measured on disclosed food and beverage hygiene and cleaning revenue, the five largest suppliers hold a CR5 of just 42%, which is low for a technically demanding category and reflects how effectively regional formulators compete on service response and plant familiarity. Ecolab holds the broadest global service network, Solenis and Kersia carry substantial processing sector positions, Christeyns holds strong European dairy and beverage depth, and Evonik supplies peracetic chemistry across the whole field. No supplier here approaches the position an equivalent player would hold in most technical chemical categories.
Three contests run at once. Chemical supply competes on price and local service, where regional formulators do well. Control and dosing systems compete on cycle time evidence. And verification services compete on laboratory turnaround and sequencing capability. Each of the three rewards a completely different kind of organisation.

Pressure builds from specialist dry sanitation contractors taking the fastest growing work from chemistry-led suppliers who have nothing appropriate to offer. Rankings shift toward whoever can present total cleaning cost credibly rather than unit chemical price. Freight geography does the rest, and it has not changed in decades and shows no sign of ever doing so.
food-beverage-industrial-disinfection-and-cleaning-company-positioning-matrix-1787719726451

Competitive Moat and Risk Dimensions

ECOLAB

Moat: Service Density And Site Familiarity

The company's field service network reaches processing sites at a frequency regional competitors cannot match, and technicians who know a specific plant's cycle history carry knowledge that transfers with considerable difficulty. Hygiene failures create urgency, and urgency rewards whoever can be on site quickly. That combination is far harder to replicate than the chemistry.
ECOLAB

Risk: Service Cost Against Regional Formulators

Regional formulators compete on chemical price without carrying a comparable service structure, and procurement buying on unit cost frequently cannot see what the service actually prevents. That pressure is constant and it intensifies whenever a plant has gone a long period without any hygiene incident to remind anybody why the arrangement exists.
SOLENIS

Moat: Process Chemistry Breadth Across Utilities

Supplying water treatment and process chemistry alongside hygiene programmes gives the company a position across several plant utilities rather than one, which makes the relationship harder to unpick and creates conversations about water that a hygiene-only supplier never gets to have. Water recovery in cleaning sits naturally within that breadth, and the technical capability already exists internally.
SOLENIS

Risk: Dry Sanitation Capability Gap

The fastest growing segment requires vacuum, brush and procedural competence rather than chemistry, and a portfolio built around liquid and water treatment products has limited relevance to it. Specialist sanitation contractors are establishing themselves in low-moisture plants while chemical suppliers work out what they could reasonably sell there.

Players Tracked

Prominent Players

Ecolab
Solenis
Kersia
Christeyns
Evonik

Other Key Players

Neogen
Zep
Spartan Chemical Company
Stepan
Enviro Tech Chemical Services
Birko
Chemstar WATER
Holchem Laboratories
Callington Haven
Realco
Tetra Pak
GEA Group
Alfa Laval
SPX FLOW
Krones

Recent Developments

MARCH 2025

Low-moisture processor converts three lines to fully dry sanitation

A snack and cereal processor converted three production lines from periodic wet cleaning to fully dry sanitation procedures using vacuum, brush and alcohol-based methods. This was an internal operational change rather than any commercial transaction, and it removed liquid chemical demand from those lines entirely.
Signal: Growth in this part of the market removes chemical volume rather than adding any of it.
JULY 2025

Dairy group installs conductivity based phase control across sites

A dairy processing group completed installation of conductivity and turbidity based cleaning phase control across multiple production sites, replacing fixed timer sequences. This was a capital investment rather than any supply agreement, and reported cycle time reduction fell within the usual 20 to 30% range.
Signal: Recovered production hours justified the capital far more readily than any chemical saving ever would have done.
NOVEMBER 2025

Retailer programme extends sequencing requirements to supplier plants

A major retailer extended whole genome sequencing requirements for environmental monitoring isolates to its private label supplier plants. This was an audit specification change rather than any regulation, and it obliged suppliers to arrange sequencing capability they had not previously needed to hold at all.
Signal: Private label supply now carries testing obligations that no regulation anywhere has ever actually imposed on anybody.

Caustic, Peroxide, Acid, Freight

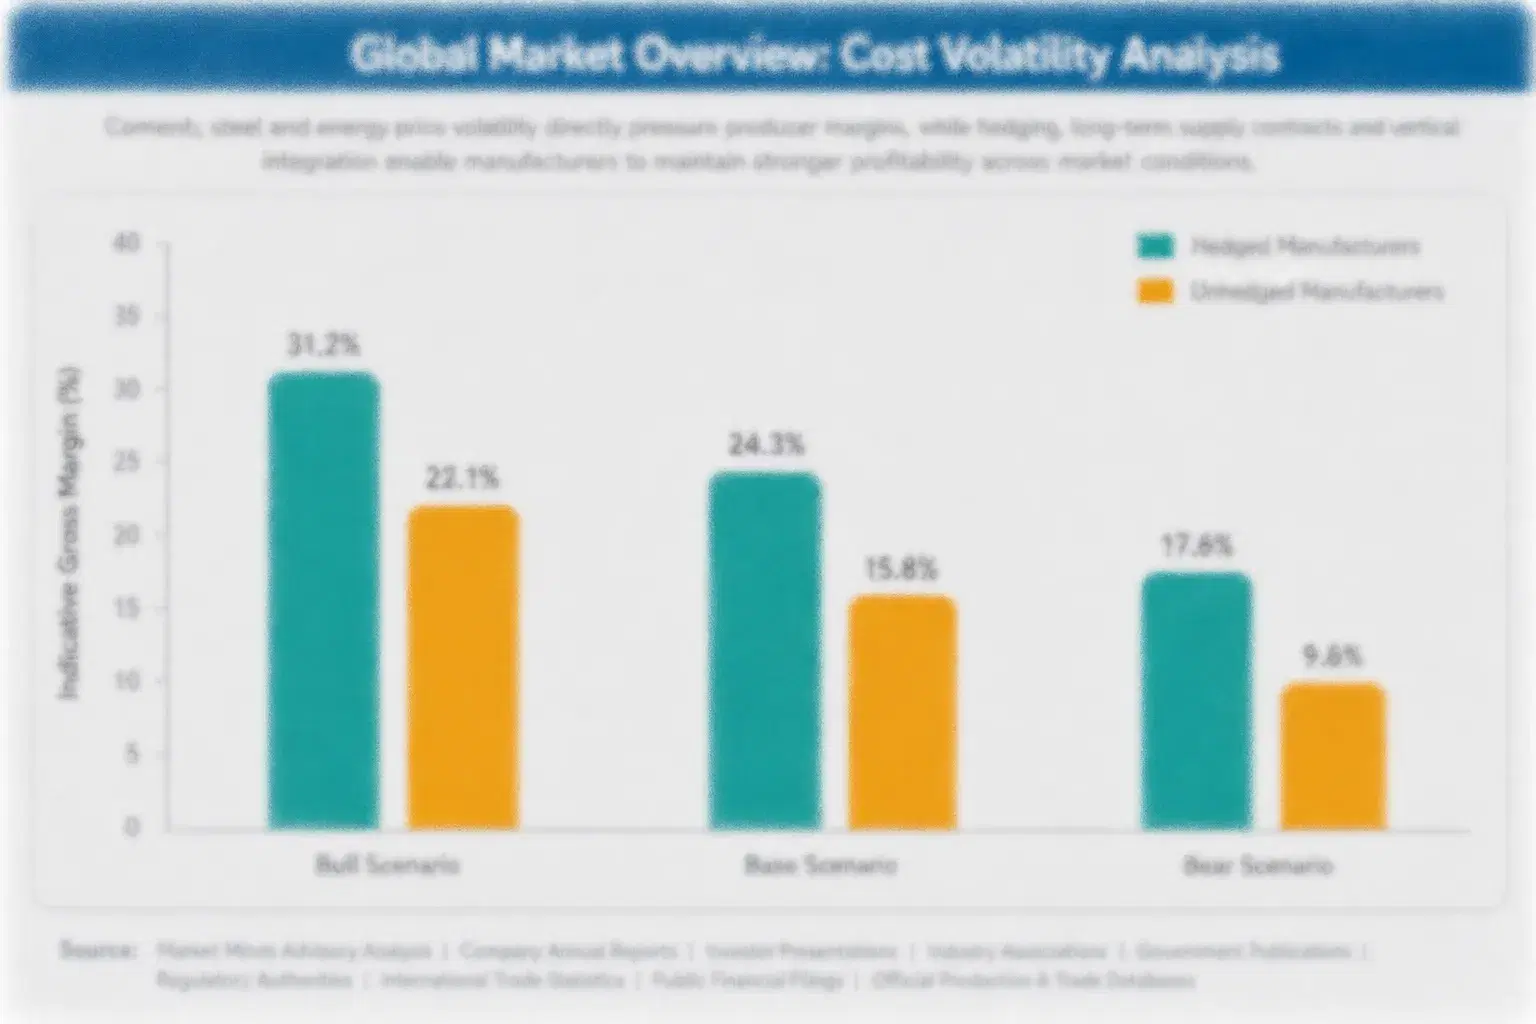
Four input groups carry the cost. Caustic soda, nitric and phosphoric acid, hydrogen peroxide and acetic acid for peracetic production, and surfactant packages together account for 48 to 62% of finished product cost, with packaging and freight taking a further substantial share because these products ship heavy. Caustic comes from chlor-alkali plants, hydrogen peroxide from processes running on natural gas derived hydrogen, and both sit downstream of energy pricing.
Energy moved everything. European electricity and gas pricing rose sharply through 2022, which IEA data documents, and chlor-alkali production is electricity-intensive enough that caustic pricing followed immediately. Hydrogen peroxide moved with gas pricing over the same period, which EIA data records for the underlying feedstock. European formulators carried cost increases they could not fully pass through, and several regional suppliers reformulated toward lower alkaline concentrations to hold pricing.

Exposure divides by freight geography rather than by purchasing scale. Dilute cleaning products ship heavy and travel badly, so a formulator serving plants within a few hundred kilometres holds a delivered cost advantage that a distant supplier with better raw material pricing cannot overcome. That is precisely why concentration stays at 42% where technical capability would otherwise favour scale.
food-beverage-industrial-disinfection-and-cleaning-cost-volatility-analysis-1787719726752

Concentrate products and dilute at the plant

Dilute products ship heavy and freight takes a substantial share of delivered cost, so supplying concentrate for on-site dilution removes water from the transport equation entirely. It requires dosing equipment at the plant and operator training to prevent dilution errors. The freight saving is large enough to change delivered cost position against nearer competitors considerably.

Generate peracetic acid on site where volume supports it

Peracetic acid is corrosive, hazardous at storage concentration and expensive to ship as a dilute solution across any distance. On-site generation from hydrogen peroxide and acetic acid removes the storage hazard and the freight together. Capital requirements mean it only makes sense above a certain plant volume, which limits it to larger processing sites.

Contract caustic supply through energy price cycles

Chlor-alkali production is electricity-intensive and caustic pricing followed European power costs immediately through the crisis, leaving formulators carrying increases they could not pass through to processors on annual contracts. Longer term caustic contracting costs volume flexibility. It removes the exposure that has repeatedly compressed formulator margin without warning. Larger formulators have moved first on this.

Portfolio Architecture for Margin Defence

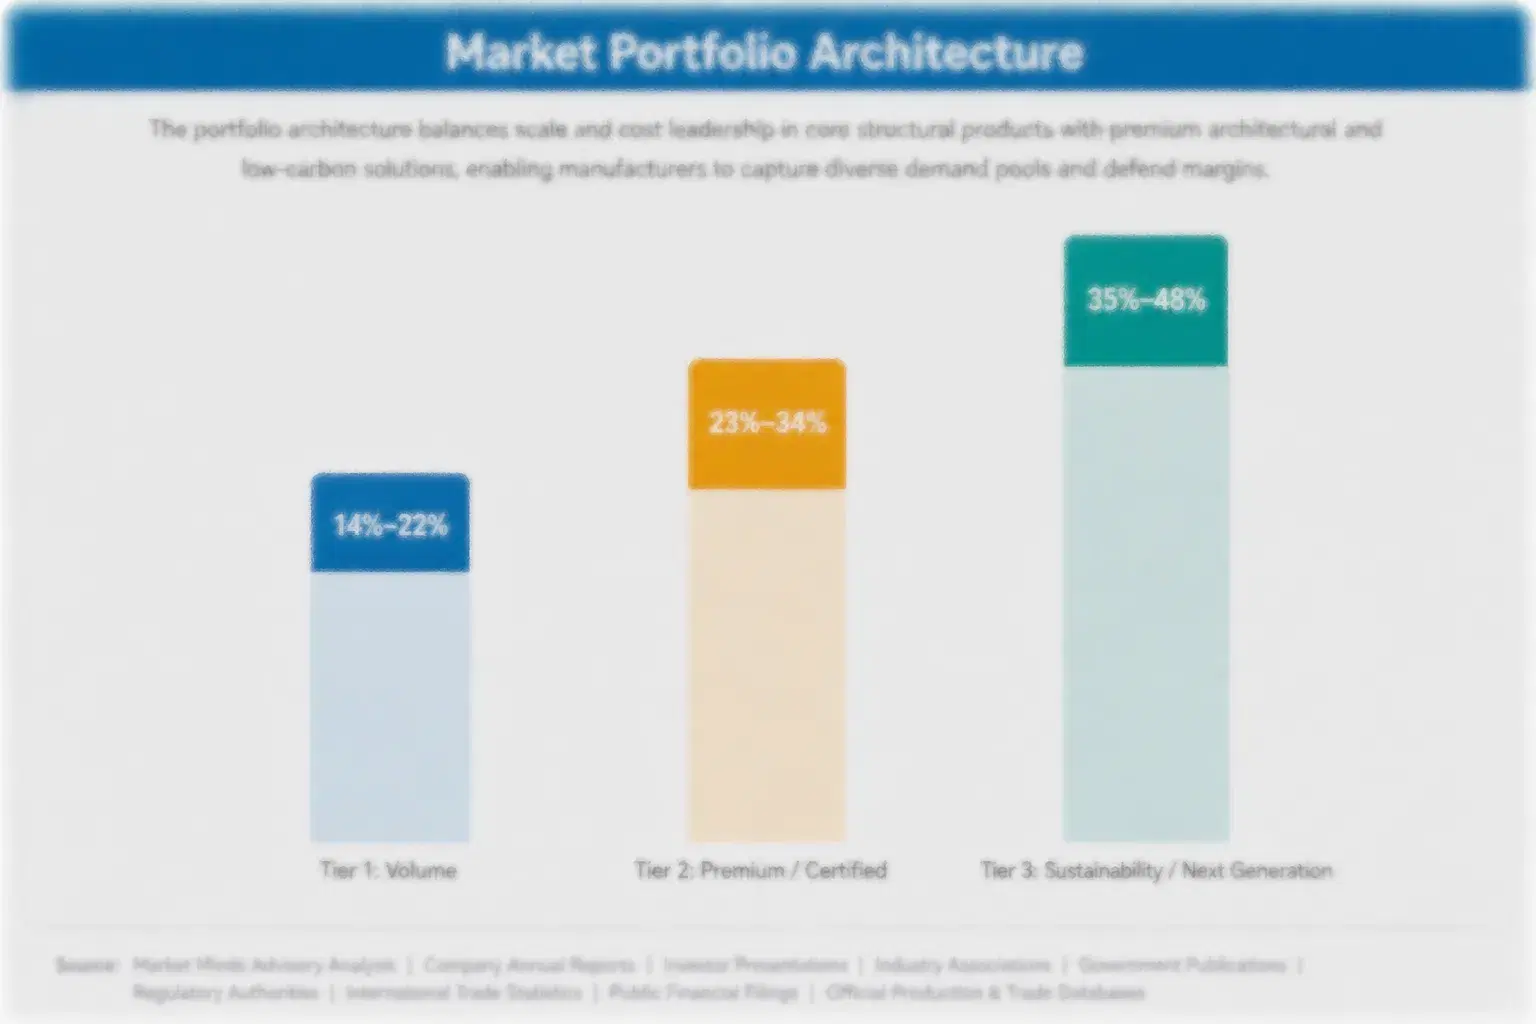
Margin follows what cannot be benchmarked on a purchase order. Open plant and foam cleaning chemicals earn thinly against regional formulators. Clean-in-place chemical programmes earn modestly, improved where service is genuinely valued. Water recovery systems earn moderately on engineering content. Automated dosing and control earns well on cycle time evidence. Environmental monitoring and verification earns better on recurring audit-driven demand. Dry sanitation earns best, on procedural competence that very few chemical suppliers hold.
The tension is that volume sits in the commodity chemistry and growth sits everywhere else. A supplier can hold substantial chemical tonnage at thin margin while specialist contractors take the dry sanitation work and instrument suppliers take the control systems. Defending tonnage means competing on price against formulators with better freight economics, which is a contest nobody with a service structure attached ever wins.

High-value pools sit in three places. Dry sanitation procedural capability, which chemistry-led suppliers largely lack. Verification services, recurring because retailer audits require them and effectively impossible for a processor to discontinue. And cycle time evidence, which converts a chemical conversation into a production capacity conversation that procurement cannot benchmark against anything.

Volume / Commodity-Adjacent

Open plant, foam cleaning and standard clean-in-place chemistry supplied against regional formulator competition. The 10-point range separates suppliers with local production and short delivery distances from those shipping dilute product across longer routes.
Gross Margin: 16-26%

Premium / Certified

Automated dosing and control systems alongside water recovery engineering supplied with cycle time and consumption evidence. The 14-point spread reflects how differently instrument-led control packages and larger recovery engineering projects are priced and delivered.
Gross Margin: 30-44%

Sustainability / Regulatory / Next-Generation

Dry sanitation programmes and environmental monitoring with sequencing capability, both driven by regulation and retailer audit rather than by preference. The 20-point range is wide because procedural sanitation contracts and laboratory verification services earn on quite different structures.
Gross Margin: 42-62%
food-beverage-industrial-disinfection-and-cleaning-portfolio-architecture-1787719727037

High-value Sub-segments and Strategic Watch-out

Dry Sanitation Programmes

Highest margin and fastest growth at 9.6%, protected by procedural and equipment competence that chemistry-led suppliers do not hold and cannot formulate their way into. The risk is that specialist contractors are establishing these positions now while chemical suppliers are still deciding. Time is short.
Gross Margin: 48-62%

Verification And Monitoring Services

Strong recurring economics driven by retailer audit requirements that a processor cannot unilaterally discontinue without losing the account. The risk is laboratory capacity and sequencing turnaround, where independent testing houses compete directly and often at lower cost. Turnaround time decides more of it than price.
Gross Margin: 40-52%

Clean-In-Place Chemical Supply

The volume core, tracking processing output and generating the tonnage that supports service coverage across a territory. Suppliers hold it because it funds the field structure, not because the margin on it justifies much attention on its own. The margin alone would not justify it.
Gross Margin: 18-28%

Freight-Exposed Dilute Supply

The strategic watch-out. Dilute products ship heavy and a formulator two hundred kilometres away holds a delivered cost advantage nothing else overcomes. The risk is defending tonnage on price in a contest that service structures simply cannot win. Distance beats purchasing power quite reliably here.
Gross Margin: 12-20%

Cleaning Never Stops Recurring

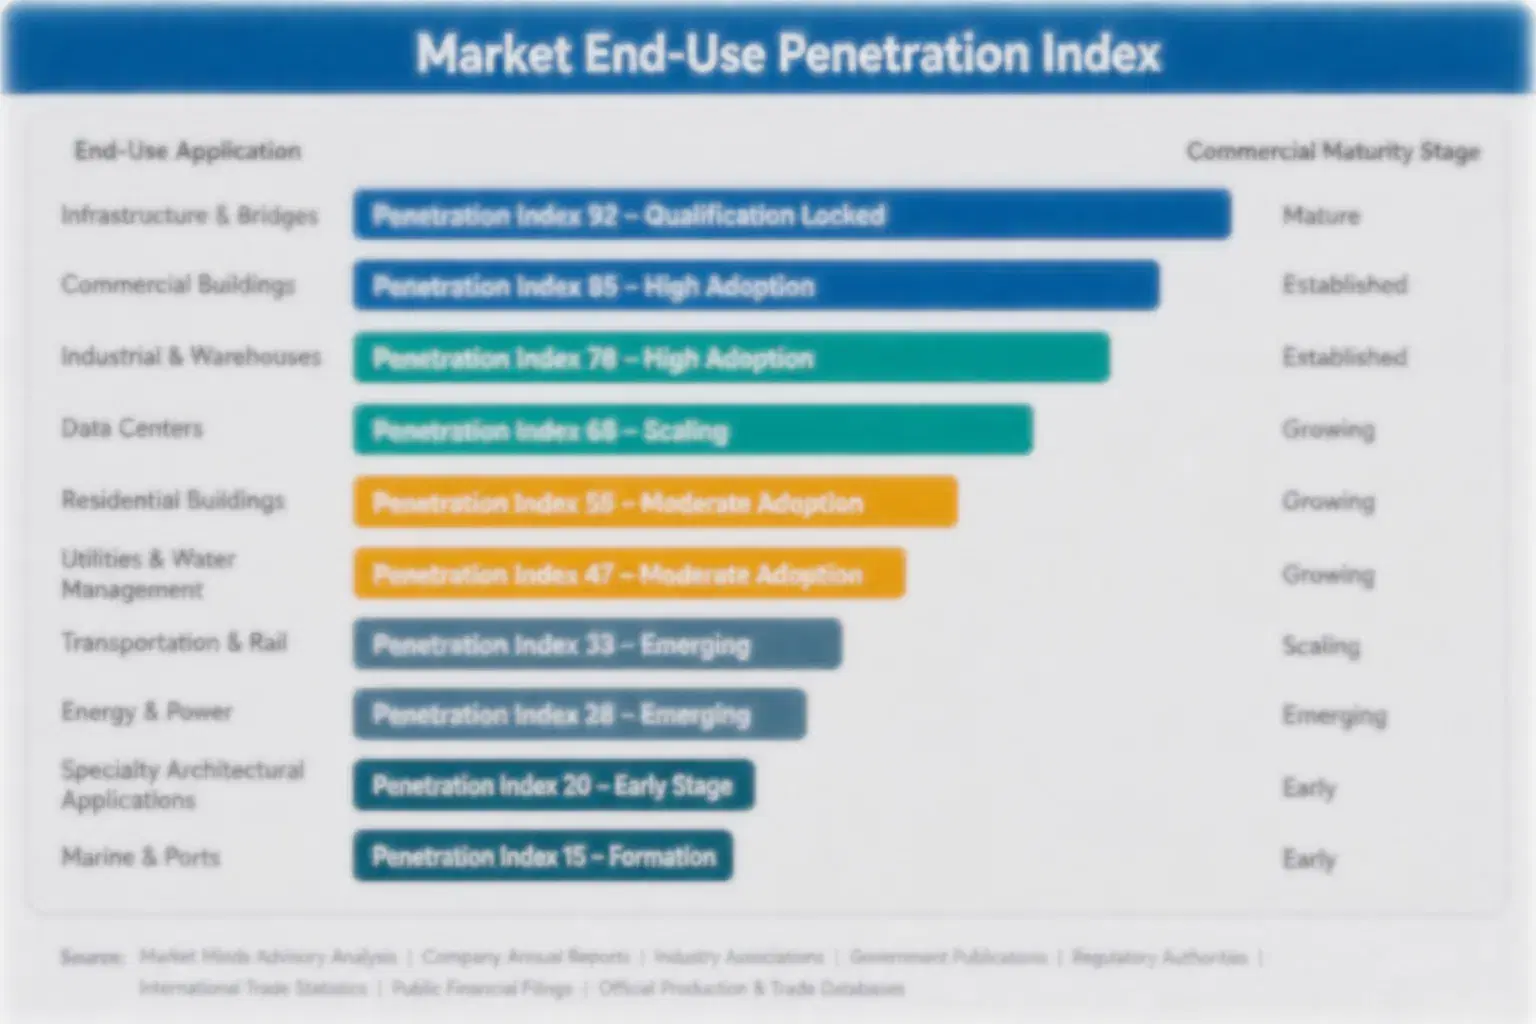
Demand here is genuinely annuity-shaped in a way very few industrial categories manage. Every production run generates a cleaning cycle, every cycle consumes chemistry, and no plant has ever reduced the frequency for commercial reasons. Verification adds a second recurring stream tied to audit calendars rather than to production volume. Revenue tracks processing output almost mechanically and continues through downturns, because a plant running at reduced volume still cleans.
Stickiness varies enormously by what is being supplied. Chemical supply changes hands on price with limited friction, since a competing formulator matches a caustic specification easily. Control systems and dry sanitation procedures stick hard, because validation work has been done and repeating it means revalidating food safety controls nobody wants to reopen. Verification services sit in between, sticky through data continuity rather than through any contractual arrangement.

The decision has moved from plant hygiene managers toward operations and finance over the past decade. Hygiene managers specify what works and increasingly cannot approve what it costs. Operations directors respond to cycle time and throughput arguments, and finance responds to water and energy consumption. Suppliers selling to the hygiene manager alone are addressing somebody with considerably less authority than ten years ago.
food-beverage-industrial-disinfection-and-cleaning-end-use-penetration-index-1787719727319

Sell Time, Not Chemistry

These are among the four positions where our research anticipates prominent divergence between winners and laggards over the coming forecast period. Each is grounded in the demand model, the regulatory perimeter, and the announced capacity pipeline.
01 / CYCLE TIME MONETISATION

Recovered hours are worth more than any chemical

Cleaning consumes around 17% of all available line hours and measurement-based phase control removes 20 to 30% of cycle duration without altering the chemistry involved in any way whatsoever at all. At most sites the recovered production capacity is worth several times over the entire annual chemical spend. Suppliers who model that against the plant's own throughput value compete on a dimension that procurement simply cannot benchmark, while those still quoting cost per litre compete where nobody differentiates at all.
02 / DRY CAPABILITY BUILDING

The fastest growth needs no liquid chemistry at all

Low-moisture sanitation grows at 9.6% and it requires vacuum, brush, compressed air and validated procedure rather than any formulation work, so chemistry-led suppliers currently hold almost nothing at all that will sell into it. Building that capability means equipment, operator training and supervision and procedural development rather than any product development. Specialist sanitation contractors are already establishing these positions right now, and every plant that appoints one becomes considerably harder for any chemical supplier ever to reach afterwards at all.
03 / VERIFICATION SERVICE RETENTION

Swab data holds the relationship better than supply contracts

Environmental monitoring runs to around 400 swabs every week at a mid-sized ready-to-eat plant, and it is driven by retailer audit requirements that the processor cannot simply discontinue without risking the whole of the account entirely. The supplier who holds that monitoring also holds all the evidence explaining exactly why the chemistry is specified as it is. That continuity of data binds up a relationship far more effectively than any contractual term that anybody has ever yet managed to write down.
04 / FREIGHT POSITION DEFENCE

Dilute product travels badly and always has

Cleaning chemistry ships heavy because most of what actually moves is water, and a formulator operating within just a few hundred kilometres of a plant holds a delivered cost advantage that superior raw material buying simply cannot overcome anywhere. That single fact explains why concentration sits at only 42% in an otherwise technically demanding category. Supplying a concentrate for dilution at the plant itself removes the water from that freight equation entirely and changes the whole of that calculation quite materially.

Engagement Snapshot From the Field

A live engagement with an industry participant carrying material or product regulatory and market exposure ahead of a defining policy shift, showing how our research translates into a defensible multi-year portfolio strategy.
MARKET MINDS ADVISORY · CLIENT ENGAGEMENT SUMMARY
Food & Beverage Industrial Disinfection and Cleaning Producer Strategic Portfolio Review and Transition Roadmap 2026·Investment Scenario on Food & Beverage Industrial Disinfection and Cleaning Exposure Evaluation 2025-26
CLIENT PROFILE
A regional hygiene chemical formulator supplying dairy, beverage and prepared food processors across several countries, with reported revenue of 96 million dollars (client-reported, unverified by MMA). Roughly 81% came from clean-in-place and open plant chemical supply. No dry sanitation capability existed and verification services were subcontracted to an independent laboratory throughout the entire period under review.
STRATEGIC CHALLENGE
Chemical margins had compressed for four consecutive years as processors consolidated purchasing and benchmarked unit pricing across suppliers more aggressively. Management was planning a capacity investment to reduce production cost per litre. That defended a position on the one dimension where every competitor could match any move, while the growing parts of the category went entirely unaddressed.
MMA APPROACH
MMA analysed customer plants by cleaning cycle time, water consumption and processing type, then compared that against where the client's revenue actually sat. Twenty-six expert interviews with plant hygiene managers, operations directors and procurement leads established who now decides and on what basis. The analysis treated cycle time, dry capability and verification as the routes rather than production cost.
KEY FINDINGS
  1. Cleaning consumed between 14 and 21% of line hours across customer plants, and no customer had ever been shown that figure by the client or by any competitor.
  2. Four customers operated low-moisture processing lines the client supplied nothing to, and two had already appointed specialist dry sanitation contractors of their own.
  3. Subcontracted verification meant an independent laboratory held the swab data explaining why the client's chemistry was specified in the way that it was.
  4. Operations directors interviewed responded strongly to throughput arguments, while every commercial conversation the client held was being held with hygiene managers alone.
CLIENT PROFILE
A regional hygiene chemical formulator supplying dairy, beverage and prepared food processors across several countries, with reported revenue of 96 million dollars (client-reported, unverified by MMA). Roughly 81% came from clean-in-place and open plant chemical supply. No dry sanitation capability existed and verification services were subcontracted to an independent laboratory throughout the entire period under review.
STRATEGIC CHALLENGE
Chemical margins had compressed for four consecutive years as processors consolidated purchasing and benchmarked unit pricing across suppliers more aggressively. Management was planning a capacity investment to reduce production cost per litre. That defended a position on the one dimension where every competitor could match any move, while the growing parts of the category went entirely unaddressed.
MMA APPROACH
MMA analysed customer plants by cleaning cycle time, water consumption and processing type, then compared that against where the client's revenue actually sat. Twenty-six expert interviews with plant hygiene managers, operations directors and procurement leads established who now decides and on what basis. The analysis treated cycle time, dry capability and verification as the routes rather than production cost.
KEY FINDINGS
  1. Cleaning consumed between 14 and 21% of line hours across customer plants, and no customer had ever been shown that figure by the client or by any competitor.
  2. Four customers operated low-moisture processing lines the client supplied nothing to, and two had already appointed specialist dry sanitation contractors of their own.
  3. Subcontracted verification meant an independent laboratory held the swab data explaining why the client's chemistry was specified in the way that it was.
  4. Operations directors interviewed responded strongly to throughput arguments, while every commercial conversation the client held was being held with hygiene managers alone.
RECOMMENDED STRATEGY
Phase 1: Phase one: instrument cycle times at the ten largest customer plants and present recovered hours against their own throughput value directly. Phase 2: Phase two: build dry sanitation capability through equipment and training before specialist contractors take all the remaining low-moisture accounts away. Phase 3: Phase three: bring verification in house so the swab data supporting every chemical specification sits with the client itself instead of elsewhere.
OUTCOME
Cycle instrumentation at eight plants identified recoverable hours worth more than those sites' combined annual chemical spend (client-reported, unverified by MMA). Dry sanitation capability was built and two low-moisture accounts secured. Verification remained subcontracted pending laboratory investment. The capacity investment was deferred, having addressed a cost position that competitors could match within a year anyway.

Frequently Asked Questions

Foundational context covering the market sizes, CAGR, scope, country, region and competition that inform every finding below. This section is provided to cover basics and most often pre-purchase conversations, answered from the MMA Primary Research Dataset.

What is the current size of the Food & Beverage Industrial Disinfection and Cleaning Market?

The market was worth 12.8 billion dollars in 2025, covering chemistry, systems and verification services for industrial food and beverage processing. It reaches 13.62 billion dollars in 2026.

How large will the Food & Beverage Industrial Disinfection and Cleaning Market be by 2036?

MMA forecasts 25.33 billion dollars by 2036, an increase of 11.71 billion dollars over the 2026 base. That represents an expansion multiple of 1.86 times across the forecast period.

What is the CAGR for the Food & Beverage Industrial Disinfection and Cleaning Market 2026 to 2036?

The base case compounds at 6.4% annually. The bull case reaches 7.6% if a major low-moisture contamination event accelerates dry sanitation investment, while the bear case sits at 5.2%.

Which segment is growing fastest?

Dry cleaning and low-moisture sanitation, at 9.6%, half again the market rate of 6.4%. Water in a powder or chocolate plant is a hazard rather than a cleaning tool.

Who are the major companies in the Food & Beverage Industrial Disinfection and Cleaning Market?

Ecolab, Solenis, Kersia, Christeyns and Evonik lead on disclosed food and beverage hygiene revenue. Concentration is only 42%, so regional formulators hold substantial positions in every market.

Which country is growing fastest?

India at 8.4%, as organised dairy and packaged food processing expands and export requirements pull hygiene standards upward. Domestic formulators hold most of that volume.

Report Segmentation Architecture

The full report scope spans multiple orthogonal segmentation dimensions, with cross-tabulated demand data provided for each dimension pair. Coverage extends further to regional breakdowns, trend trajectories, and the competitive detail needed to support segment-level decision-making.

By Offering Type

  • Clean-in-Place Chemical Programmes
  • Open Plant and Foam Cleaning Chemicals
  • Dry Cleaning and Low-Moisture Sanitation
  • Automated Dosing and Control Systems
  • Environmental Monitoring and Verification Services
  • Water Recovery and Rinse Reuse Systems

By End-Use Industry

  • Dairy Processing
  • Brewing and Beverage Production
  • Meat and Poultry Processing
  • Bakery and Confectionery
  • Low-Moisture and Powder Processing
  • Prepared and Ready-to-Eat Foods

By Commercial Dimension

  • Direct Technical Service Contracts
  • Distributor and Reseller Supply
  • Managed Hygiene Programme Outsourcing
  • Equipment Builder Specification Supply
  • Laboratory Verification Service Contracts
  • Concentrate Supply with On-Site Dilution

By Region

  • North America
  • Western Europe
  • East Asia
  • South Asia and Pacific
  • Latin America
  • Middle East and Africa
  • Eastern Europe

Scope, Methodology, and Coverage

Every figure in this report is reproducible from documented input assumptions. The scope below maps the historical period, the forecast horizon, the segmentation dimensions, and the countries covered, alongside the underlying primary and qualitative methodology.
Historical Period
2020 to 2025
Forecast Period
2026 to 2036
Base Year
2025 (USD billions; MMA Primary Research Dataset, August 2026)
Market Definition
Scope covers chemicals, systems and verification services supplied for cleaning and disinfection of industrial food and beverage processing equipment and environments, spanning clean-in-place chemical programmes including alkaline acid and sanitiser stages, open plant and foam cleaning chemicals, dry cleaning and low-moisture sanitation equipment and consumables, automated dosing and phase control systems, environmental monitoring and verification services including swab testing and sequencing, and water recovery and rinse reuse systems installed for cleaning duty. Retail and foodservice cleaning products, boiler and cooling water treatment chemistry, aseptic packaging sterilisation consumables supplied with filling equipment, personal hygiene and handwash products, pest control services, and wastewater treatment downstream of the plant are excluded from the market size and all derived figures.
Quantitative Units
USD billions (current prices); tonnes of chemistry supplied; cleaning cycle duration in minutes; share of available line hours; site water consumption share
Segmentation Dimensions
By Offering Type; By End-Use Industry; By Commercial Dimension; By Region
Regions Covered
North America, Western Europe, East Asia, South Asia and Pacific, Latin America, Middle East and Africa, Eastern Europe
Countries Covered
USA, China, Germany, France, Netherlands, UK, Japan, India, Brazil, Poland, Italy, Spain, Australia, Mexico, Saudi Arabia
Key Companies Profiled
Ecolab, Solenis, Kersia, Christeyns, Evonik, Neogen, Zep, Spartan Chemical Company, Stepan, Enviro Tech Chemical Services, Birko, Chemstar WATER, Holchem Laboratories, Callington Haven, Realco, Tetra Pak, GEA Group, Alfa Laval, SPX FLOW, Krones
Quantitative Methodology
Primary survey, n=3,800 respondents, Q4 2025, six countries; demand-side model with trade association cross-validation
Qualitative Methodology
47 expert interviews, Q4 2025; applied to validate demand model assumptions, identify emerging dynamics, and assess competitive positioning
Report Format
PDF and XLSX data workbook (Word format preview document)
Publisher
Market Minds Advisory
Report Code
MMA-2026-CHM-141
Published
August 2026
Contact
sales@marketmindsadvisory.com | www.marketmindsadvisory.com

Purchase the full Food & Beverage Industrial Disinfection and Cleaning Market Report (2026 to 2036).

The full report runs to 190 pages and covers all six offering type segments, seven regions and 20 profiled suppliers in detail. It includes the complete segment CAGR set, regional comparison of processing capacity against chemical intensity, and cycle time economics modelled against recovered production capacity at plant level. Company profiles carry evaluation on disclosed food and beverage hygiene revenue, with moat and risk assessment for the top five suppliers. The competitive section extends to 14 tracked operational, technical and audit developments across 2024 and 2025. Primary research inputs include a quantitative survey of 3,800 respondents and 47 expert interviews conducted in Q4 2025.
Six offering type segments with individual CAGR forecasts
Seven regional markets with processing capacity and intensity comparison
Twenty supplier profiles on consistent revenue evaluation basis
Fourteen tracked operational and audit developments with commercial interpretation
Cycle time economics modelled against recovered production capacity
Dry sanitation capability assessed across chemistry-led supplier portfolios

Built For The People Who Decide

From boardroom strategy to bench-side execution, this report is read cover-to-cover by leaders shaping the next decade of their industry, turning demand scenarios, market dynamics and valuation benchmarks into decisions.
CXOs/ Presidents/ VPs/ Managers
M&A and Corporate Development
Strategy Teams and R&D Heads
Procurement and Product Directors
Regulatory and Compliance Leaders
Investor Relations and Equity Analysts