Market Minds Advisory
EV Powertrain Market

EV Powertrain Market: EV Powertrain Market: Integration Depth, Silicon Carbide Adoption and the Vertical Integration Problem

Manufacturers building their own drive units are shrinking the addressable market faster than electrification expands it, while silicon carbide inverters and multi-in-one integration reshape what an independent supplier must actually deliver.

Lead Analyst

David Horsley

Published

August 2026

Make Smarter Decisions with Customized Research Insights

Request a free sample report and evaluate market opportunities, growth trends, and competitive dynamics relevant to your business needs.

2025 MARKET VALUE$88.0BMarket Size 2025
2036 FORECAST VALUE$288.5BBase Case , 2026 to 2036
CAGR 2026 TO 203611.4 %Bull 12.6% / Bear 10.2%
INCREMENTAL OPPORTUNITY$190.5BNet 10- year value creation
EXPANSION MULTIPLE2.94x2036 value over 2026 base
Strategic Levers
M&A Pipeline
Regional Outlook
Country Rankings
Competitive Intelligence
Segmental Deep-dive
Call-Us : 91 93563 13602

Executive Snapshot and Market Trajectory.

The uncomfortable arithmetic of this market is that it grows quickly while the portion suppliers can actually sell into grows much more slowly. Roughly 38% of drive units are now built by vehicle manufacturers themselves, and the manufacturers doing it happen to be the ones selling the most electric vehicles.
Multi-in-one integrated drive units grow at 17.1%, a full 1.50 times the market rate, because packaging the motor, inverter, gearbox, onboard charger and converter into a single assembly removes mass, wiring, cooling circuits and several vehicle assembly operations at once. East Asia holds 45% of global value, well outside the standard regional band, because China builds well over half the world's electric vehicles and grew its drive unit industry alongside that volume.
Concentration is very low at 31% for the top five, and that figure conceals the real structure entirely. Independent suppliers now compete against each other and against their own largest customers simultaneously, which is an unusual position in automotive components and makes conventional share analysis considerably less informative than it looks. The meaningful divide is between independents and manufacturers building their own units.
Market Definition
This report covers electric traction powertrain systems and components, spanning traction motors, inverters, reduction gearboxes, onboard chargers, direct current converters, power distribution units and integrated drive units across battery electric, plug-in hybrid and hybrid platforms. Battery cells, modules and packs, battery management systems, charging infrastructure, hydrogen fuel cell stacks, and internal combustion engines and transmissions are excluded from the sizing.
Base Year Value
$88.0B in 2025 (MMA Primary Research Dataset, August 2026)
Forecast Period
2026 to 2036, eleven discrete annual values
CAGR
11.4% base case. Bull 12.6%. Bear 10.2%.
Fastest Growth Segment
Multi-in-One Integrated Drive Unit: 17.1% CAGR
Fastest Growth Country
India: 14.2% CAGR
Fastest Growth Region
South Asia and Pacific: 13.6% CAGR
Largest Region
East Asia: 45% of 2025 global value
Market Leaders
BYD FinDreams Powertrain, Nidec, BorgWarner, Schaeffler and ZF Friedrichshafen lead on drive unit shipment volume. Source: MMA Analysis, July 2026.
Primary Survey
n=3,800 procurement and R&D decision-makers, Q4 2025, six countries
Methodology
Demand-side build-up, cross-validated against public data, 47 expert interviews

EV Powertrain Market Forecast Scenarios

ev-powertrain-market-trends-growth-size-forecast-scenario-1787316984540
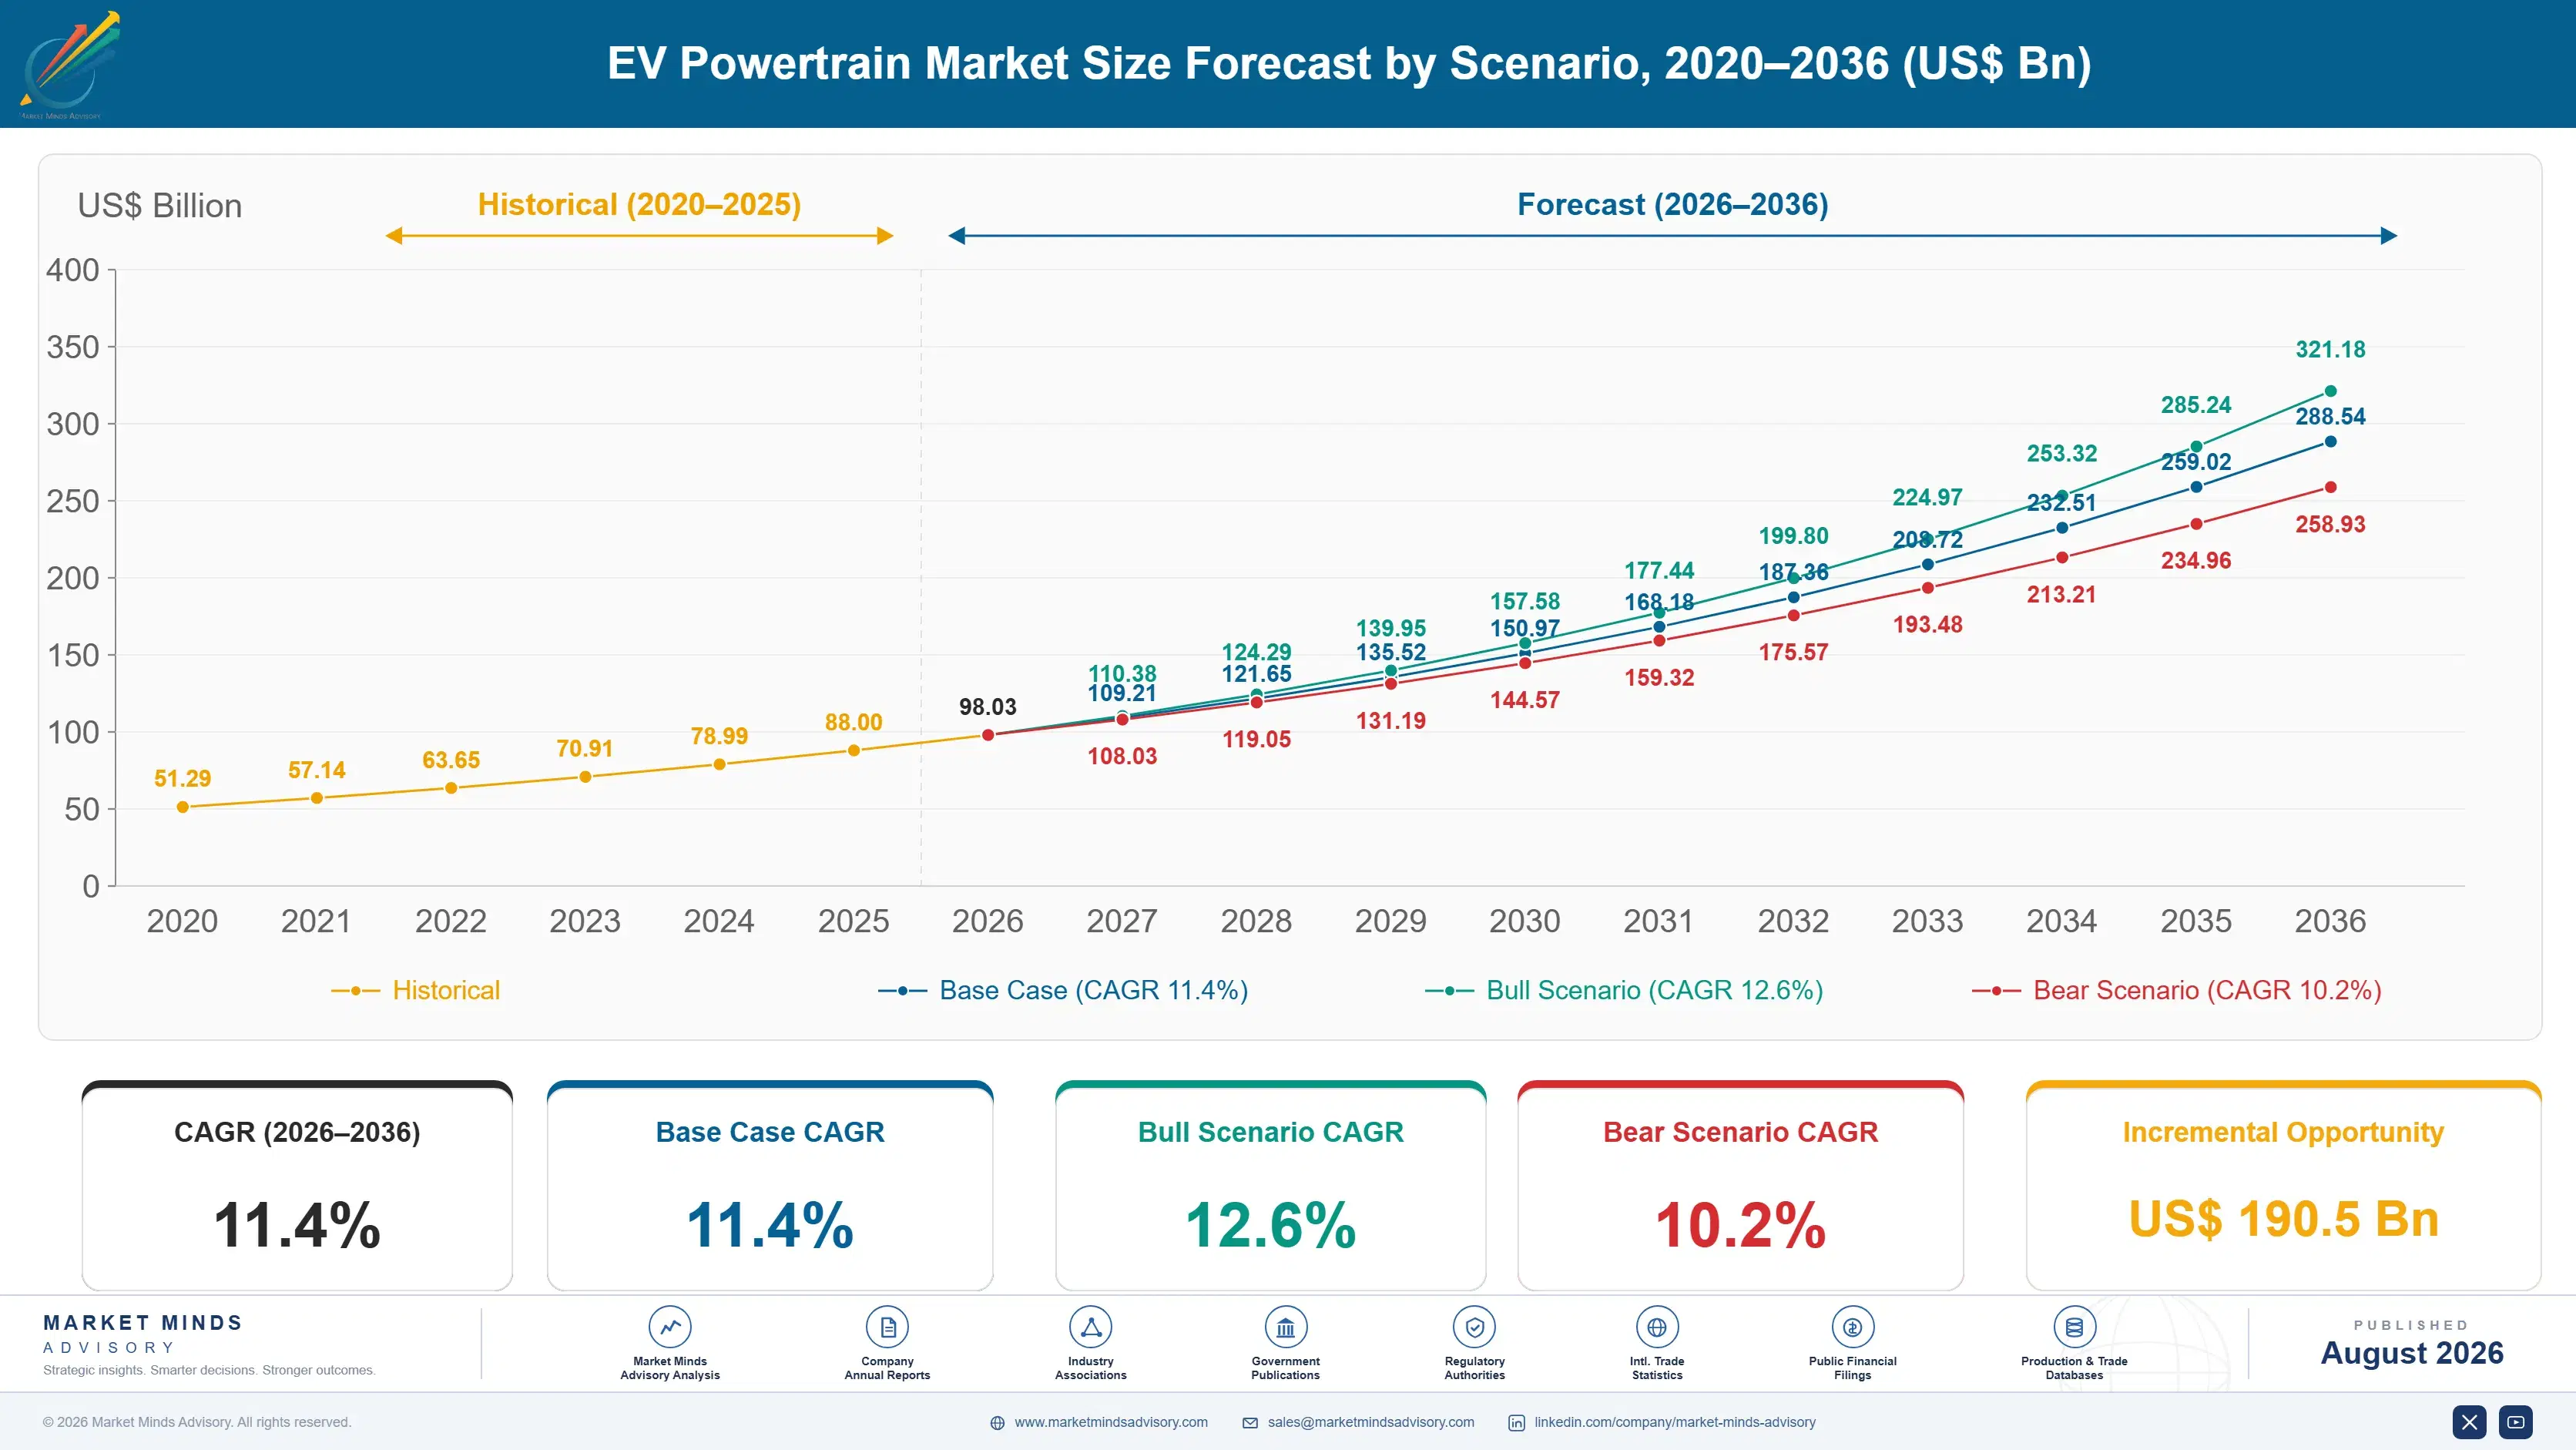
Between 2020 and 2025 the market compounded at 10.0%, and the number hides how uneven the period was. Chinese electric vehicle production grew far faster than anybody planned for, while Western electrification timelines slipped repeatedly and left suppliers holding capacity built against announced volumes. Content per vehicle rose steadily throughout as integration levels increased, which cushioned the disappointment considerably for suppliers positioned on the right programmes.
The base case at 11.4% rests on three mechanisms. Global electric vehicle production keeps expanding even where individual manufacturer targets slip, and every unit carries a drive unit whether the manufacturer builds it or buys it. Integration depth rises steadily, and a multi-in-one unit realises several times the value of discrete component supply. Silicon carbide adoption continues climbing as 800 volt architectures spread beyond premium platforms, raising inverter content on every vehicle that adopts them.
The bull case at 12.6% turns on Western electrification returning to announced trajectories, which would fill the capacity suppliers have already built and paid for. The bear case at 10.2% is vertical integration accelerating: if the manufacturers selling the most electric vehicles keep building their own drive units, the addressable market grows considerably more slowly than vehicle production does.

What Actually Governs Drive Unit Value

An electric drive unit is a motor, an inverter and a gearbox. Described that way it sounds like a solved problem, and in a narrow engineering sense it is. What is not solved is who gets to build it, and that question decides more about this market than any technical development does.
TOP FIVE CONCENTRATION31%Share held by the five largest global powertrain suppliers
AVERAGE SYSTEM PRICE$1,740Typical realised price for a passenger drive unit
VERTICAL INTEGRATION SHARE38%Portion of drive units built by vehicle manufacturers themselves
ELECTRONICS COST SHARE34% of COGSInverter and semiconductor portion of drive unit cost
SYSTEM EFFICIENCY93%Typical energy conversion achieved across the drive cycle
SILICON CARBIDE ATTACH36%Share of new inverters using wide bandgap semiconductors
Vehicle manufacturers treat the drive unit as core technology in a way they never treated engines, which is a striking reversal. Tesla and BYD build their own entirely, several Chinese manufacturers followed, and roughly 38% of world volume now comes from manufacturers rather than suppliers. The logic is that motor control software shapes how a car drives and that integration savings accrue to whoever owns both the vehicle and the unit. Independent suppliers therefore compete against customers, which shapes every commercial conversation they have.
Where independents genuinely win is integration depth and semiconductor capability. A multi-in-one unit combining motor, inverter, gearbox, charger and converter takes engineering across mechanical, power electronics, thermal and software disciplines simultaneously, and very few organisations hold all four convincingly. Silicon carbide inverter design is the same story in miniature.
"Suppliers keep presenting electrification as their growth story and quietly omit that their biggest customers are becoming their biggest competitors. The independents who survive this decade will be the ones selling capability that manufacturers genuinely cannot build themselves, not cheaper versions of what they already make."
Practice Director, Electrified Powertrain, Market Minds Advisory · MMA Automotiv

Market Trends

Silicon Carbide Inverters Spread Beyond Premium Platforms

Wide bandgap semiconductors switch faster and waste less energy as heat than silicon devices, which translates directly into range on a given battery. Silicon carbide reaches roughly 36% of new inverters and climbs as 800 volt architectures spread from premium platforms into mainstream programmes, since higher voltage compounds the efficiency advantage. Device pricing has fallen substantially as wafer capacity expanded, removing the cost objection that limited adoption. The remaining constraint is design capability, because switching that fast creates electromagnetic interference and thermal problems that punish inexperienced engineering teams very badly.
Market Impact: Covers 22 million annual vehicles
Multi-in-One Integration Absorbs Adjacent Component Content

Drive units are steadily absorbing the onboard charger, the direct current converter and the power distribution unit alongside the motor, inverter and gearbox. The commercial argument is vehicle-level rather than component-level: integration removes wiring harness, cooling circuits, housings and assembly operations that each carried their own cost and their own supplier. A multi-in-one unit realises roughly 2.4 times the value of a three-in-one assembly. The engineering demands mechanical, power electronics, thermal and software capability in one organisation, which is precisely why so few suppliers are able to quote these units credibly at all.
Market Impact: Cuts charging time by 50%

Market Opportunities and Growth Drivers

Electric Vehicle Production Growth Sustains Underlying Unit Demand

Global electric vehicle output keeps expanding even where individual manufacturer targets slip, and every vehicle built carries a traction drive unit regardless of who manufactures it. Chinese production alone accounts for well over half of world volume and continues growing, while European and North American programmes still contribute despite repeated timeline revisions. The demand mechanism here is actual production rather than policy sentiment, which makes it considerably more predictable than the announcement cycle suggests. Content per vehicle rises alongside it, as integration depth and semiconductor sophistication both keep increasing across programmes.
Market Impact: Removes 38% of world volume

Higher Voltage Architectures Force Inverter And Motor Redesign

Eight hundred volt platforms charge considerably faster and lose less energy in cabling, and they have moved from premium exclusivity toward mainstream adoption across several manufacturers. The architecture change forces silicon carbide inverters, revised motor insulation systems and redesigned thermal management, none of which carries over from 400 volt designs. That resets competitive positions rather than simply adding content per vehicle, because a supplier holding 400 volt programmes has no automatic claim on the replacement and must win the engineering argument again from the very beginning of the next programme.
Market Impact: Leaves 35% capacity idle

Market Restraints and Challenges

Vehicle Manufacturer Vertical Integration Removes Addressable Volume

Tesla and BYD build their own drive units entirely, several Chinese manufacturers followed, and roughly 38% of world volume never reaches an independent supplier at all. The root cause is that manufacturers treat motor control software as shaping how a car drives, which makes the drive unit core technology rather than a purchased component. Commercially this removes volume from exactly the fastest-growing part of the market. Participants are responding by targeting manufacturers without internal capability, by licensing technology, and by competing on integration depth that in-house teams struggle to match.
Market Impact: Adds 6% to vehicle range

Capacity Built Against Announced Volumes Sits Underutilised

Western manufacturers pushed electrification timelines back repeatedly, and suppliers who committed dedicated drive unit capacity against those announcements now carry serious underutilisation. The root cause is that supplier investment decisions had to precede volumes that turned out to be aspirational rather than committed. Commercially this depresses returns right across the sector and has already forced write-downs at several participants. Participants are responding with flexible lines building multiple architectures, with contract structures carrying volume commitments rather than forecasts, and with considerably more sceptical capacity planning than anything the previous investment cycle featured.
Market Impact: Realises 2.4 times three-in-one val
4 additional market trends, 3 additional growth drivers, and 2 additional restraints and challenges are covered in the full report. Contact sales@marketmindsadvisory.com to access the complete intelligence.

Segment CAGR and Growth Architecture

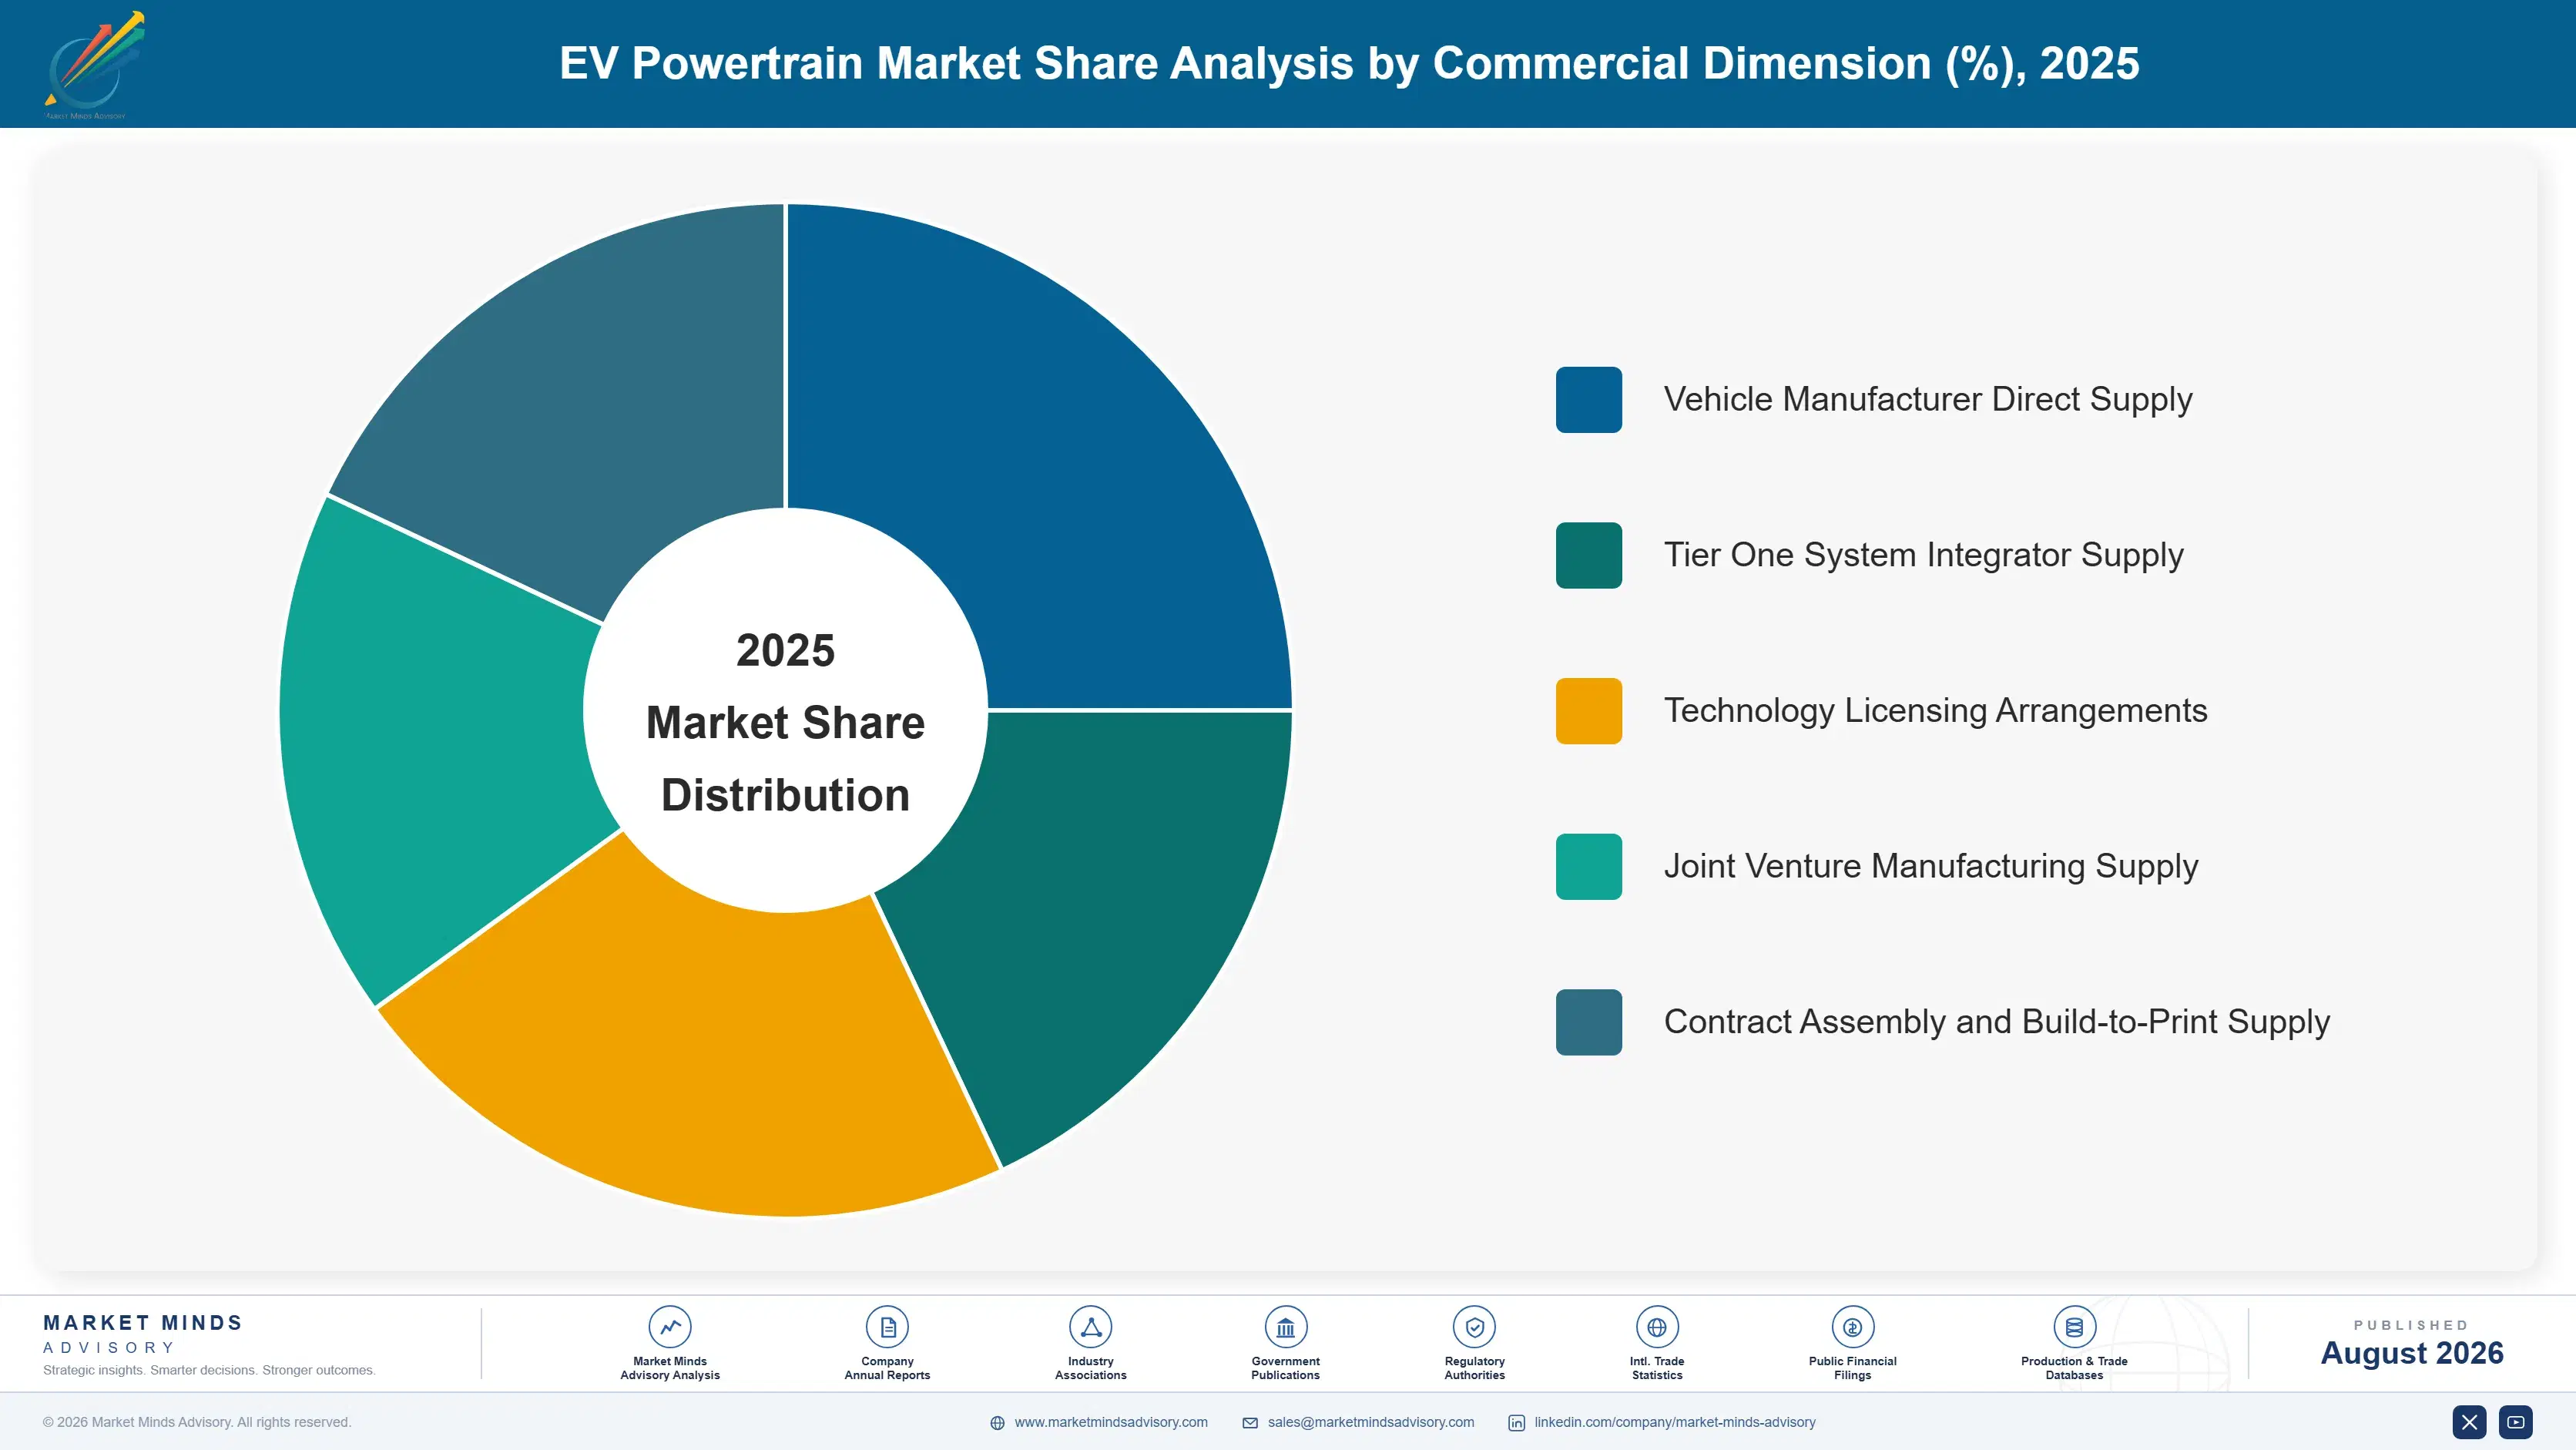
Segmentation follows degree of powertrain integration, because how many functions a supplier packages into one assembly determines the engineering disciplines required, the value realised per vehicle, the competitive field able to quote and whether a manufacturer builds or buys. Motor topology, semiconductor choice, thermal design and voltage architecture all sit downstream of that integration decision.
ev-powertrain-market-trends-growth-market-share-analysis-1787316985118

Multi-in-One Integrated Drive Unit

The fastest segment at 17.1%, a full 1.50 times the market rate, covering assemblies that package the traction motor, inverter and reduction gearbox together with the onboard charger, direct current converter and power distribution unit inside one housing. The argument is made at vehicle level rather than component level. Integration removes wiring harness, cooling circuits, separate housings and several assembly operations, each of which previously carried its own cost and its own supplier relationship. Realised value runs roughly 2.4 times a three-in-one assembly. What limits the competitive field is capability breadth, since quoting credibly demands mechanical, power electronics, thermal and control software engineering inside one organisation, and very few suppliers genuinely hold all four.
CAGR 17.1%

Three-in-One Electric Drive Unit

Growing at 14.0% on assemblies combining traction motor, inverter and reduction gearbox in a single unit, which has become the default architecture across most passenger electric platforms worldwide. Packaging and cost together explain the position. Combining the three removes high-voltage cabling between motor and inverter, shares one cooling circuit and one housing, and cuts vehicle assembly time meaningfully against discrete components. The architecture is mature enough that many suppliers quote it credibly, which is exactly what keeps pricing under pressure. What sustains the segment is that manufacturers without internal capability still need somebody to build these, and the volumes involved are far larger than any premium integration tier will ever reach.
CAGR 14.0%
Full segment breakdown across 5 segments available in the complete report.

Regional Architecture and Country Demand Map

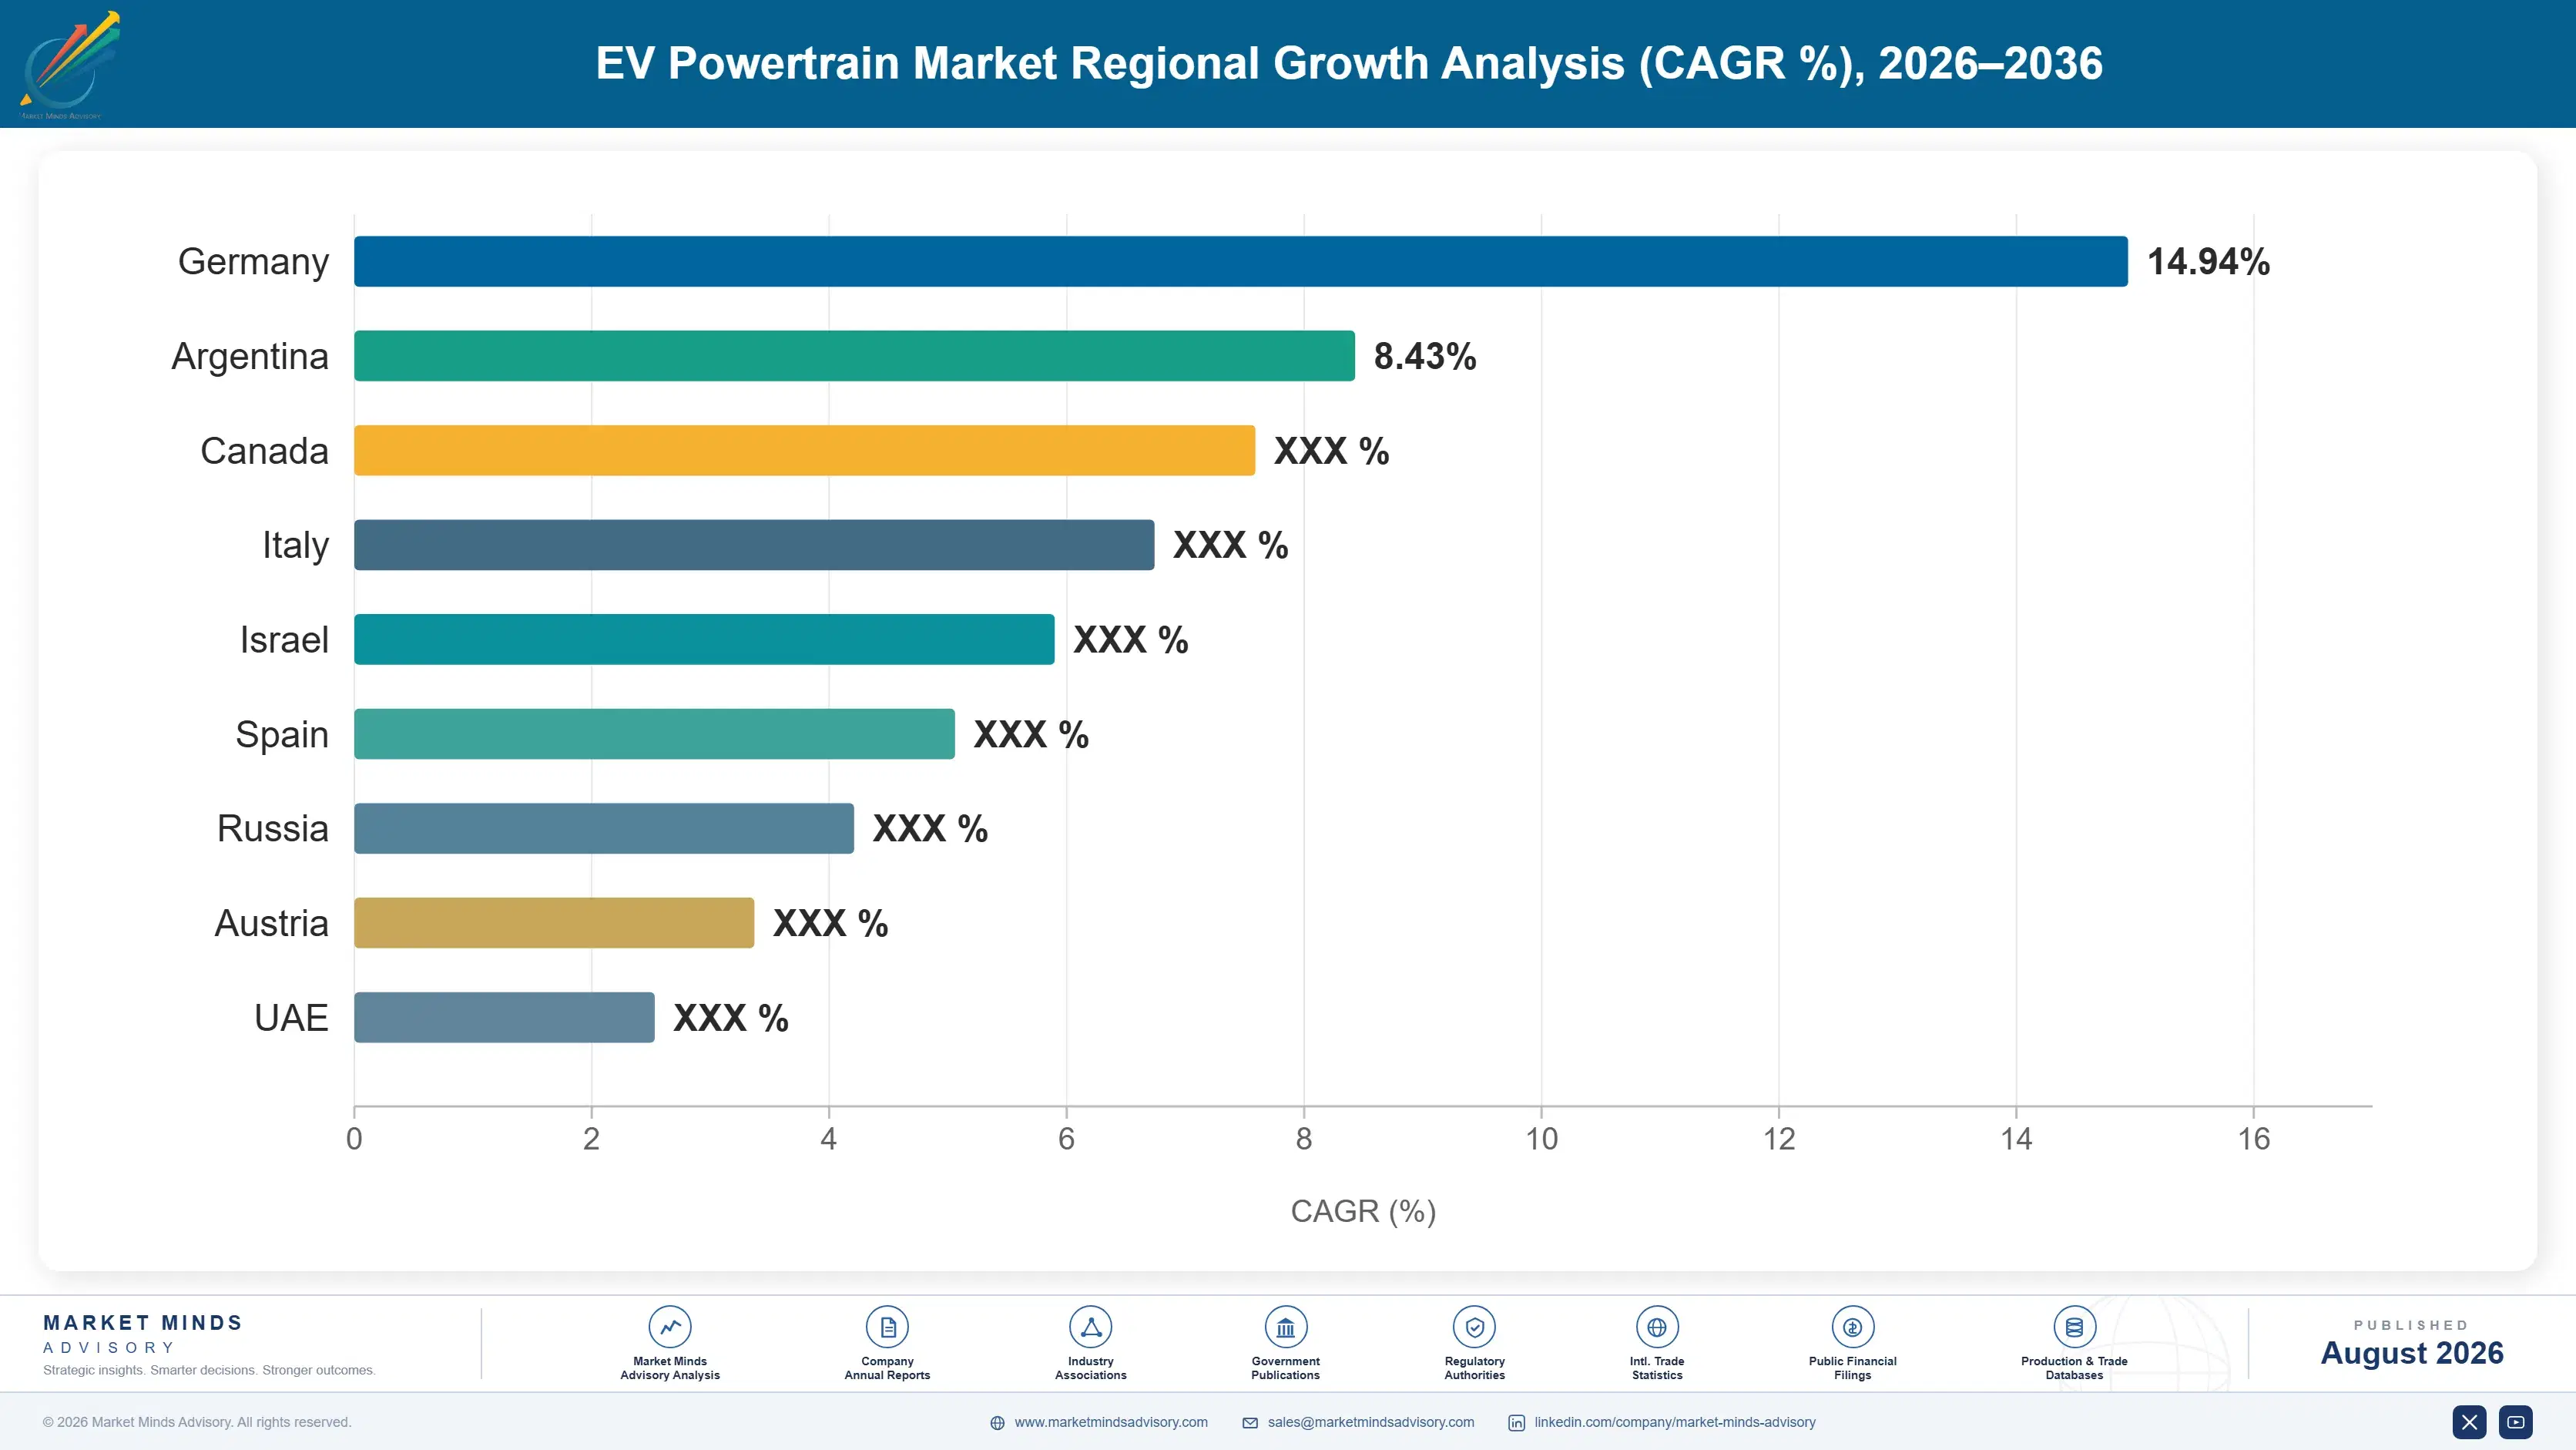
East Asia holds 45% of global value because China builds well over half the world's electric vehicles and grew its drive unit industry alongside that volume. Western Europe follows on engineering depth rather than production, and growth runs fastest across South Asia and Pacific on two-wheeler electrification.

East Asia

Note: East Asia holds 45% against a 22 to 30% band because China builds well over half the world's electric vehicles and the supporting drive unit industry grew up alongside that volume rather than being imported into it. BYD manufactures its own powertrains through FinDreams at a scale no independent supplier approaches, and Inovance, Jing-Jin Electric and Fukuta supply much of the rest of the domestic industry. Japanese suppliers occupy a different position, with Nidec, Denso, Aisin and Hitachi Astemo exporting integrated drive units into European and North American programmes. Korean capability through Hyundai Mobis and LG Magna serves domestic platforms and export work substantially. Manufacturing and demand reinforce each other here.
Share: 45% | CAGR: 12.6% (2026 to 2036)

Western Europe

German engineering depth defines this region rather than production volume. Bosch, ZF, Schaeffler and Mahle all hold integrated drive unit programmes across multiple manufacturers, and the 800 volt architectures that Porsche and Hyundai popularised were engineered substantially here. Vehicle production has not returned to pre-2019 levels and will not, which caps unit growth regardless of electrification pace. What holds value up is content: silicon carbide inverters, higher integration levels and thermal systems all raise realised price per unit. European manufacturers have also proved slower to vertically integrate than Chinese or American ones, which leaves more addressable volume for independent suppliers here than anywhere else. That reluctance to integrate is the region's most commercially useful characteristic.
Share: 20% | CAGR: 9.9% (2026 to 2036)
Regional intelligence for 5 additional markets available in the complete report: North America, South Asia and Pacific, Latin America, Middle East and Africa, Eastern Europe. Contact sales@marketmindsadvisory.com.
ev-powertrain-market-trends-growth-country-cagr-analysis-1787316985633

Where Drive Unit Margin Is Won

Four commercial positions separate the suppliers holding real value against vertically integrating customers from those quoting commodity assemblies into open tenders: holding silicon carbide inverter design capability, selling integration breadth manufacturers cannot replicate internally, reducing rare earth magnet exposure before controls tighten again, and structuring supply contracts on committed volume rather than on announced manufacturer forecasts.

Hold Silicon Carbide Inverter Design Capability Internally

Wide bandgap devices switch fast enough to create electromagnetic interference and thermal problems that punish inexperienced engineering teams badly, and that difficulty is precisely the commercial barrier. Suppliers holding proven silicon carbide inverter design realise 22% to 30% higher prices than silicon equivalents while delivering roughly 6% more vehicle range from the same battery. Device pricing has now fallen enough to remove the cost objection entirely, which means the binding constraint is engineering capability rather than component economics, and that capability takes several full programme cycles to build properly from nothing.
Market Impact: Realises 30% higher pricing across

Sell Integration Breadth Manufacturers Cannot Replicate Internally

A multi-in-one drive unit demands mechanical, power electronics, thermal and control software engineering all inside one organisation, and manufacturers building their own units generally hold only two of those four disciplines convincingly rather than the full set. Suppliers offering genuine multi-in-one capability realise roughly 2.4 times three-in-one value, and they win programmes at manufacturers who would otherwise have chosen to build the units internally. That capability takes several years to assemble properly, but it remains the only genuinely defensible position available against customers determined to bring drive units in house.
Market Impact: Realises 2.4 times the three-in-one

Reduce Rare Earth Magnet Exposure Before Controls Tighten

Permanent magnet traction motors depend directly on neodymium and dysprosium, and Chinese export controls tightened materially right through 2024 and 2025, exposing roughly 14% of total drive unit cost to pricing that nobody outside China influences at all. Suppliers qualifying externally excited synchronous and induction architectures alongside their permanent magnet designs cut that exposure sharply, and they can then quote whichever topology the programme economics actually happen to favour. The trade involved is efficiency and package size, and on many volume platforms that trade proves comfortably acceptable to the customer.
Market Impact: Cuts 14% of drive unit cost exposur

Contract On Committed Volume Not Announced Forecasts

Suppliers who built dedicated drive unit capacity against manufacturer electrification announcements now carry roughly 35% underutilisation across those assets, and several have already written the investment down entirely. Contracts carrying minimum volume commitments or capacity reservation fees shift that risk squarely onto whoever actually controls the production decision itself, which is the customer rather than the supplier. Manufacturers resist those terms strongly, which is exactly why the negotiation matters so much, and the suppliers who did secure them during the last cycle are the ones still earning acceptable returns on electrified programmes today.
Market Impact: Avoids 35% underutilisation risk ac

Who Controls the Margin Pool

Concentration sits at 31% for the top five measured on drive unit shipment volume, the basis used throughout this section, and it is low even for a young category. BYD leads on sheer volume through in-house FinDreams production, while Nidec, BorgWarner, Schaeffler and ZF compete as independents across European, Chinese and North American programmes. The gap to the next tier is narrow, and the more meaningful divide is between independents and manufacturers building their own.
Competitive activity runs on three fronts. Silicon carbide inverter capability is the first, since it decides who can quote 800 volt programmes at all. Integration breadth is the second, and it is the only position holding against a customer considering internal development. The third is motor architecture, where suppliers are qualifying designs that reduce rare earth exposure ahead of the next export restriction rather than in response to it.

Pressure arrives from a direction most component markets never face, which is customers becoming competitors. Roughly 38% of world volume never reaches an independent supplier. Separately, Chinese suppliers compete on delivered cost that Western plants cannot approach. Rankings will shift on who holds credible multi-in-one capability when manufacturers currently building in house reassess that decision.
ev-powertrain-market-trends-growth-company-positioning-matrix-1787316986165

Competitive Moat and Risk Dimensions

NIDEC

Moat: Motor manufacturing scale advantage

Decades of electric motor manufacturing across industrial, appliance and automotive applications spread engineering and production cost across volumes no automotive-only supplier approaches, and that cost position holds even against Chinese competitors. Integrated drive unit programmes across Chinese and European manufacturers also give the business genuine reference credibility when quoting new platforms.
NIDEC

Risk: Chinese pricing and customer integration

Substantial exposure to Chinese programmes places the business directly against domestic competitors with lower cost bases, and against customers increasingly building their own units. Pricing pressure has already forced restructuring in the automotive motor business, and defending share there risks the margins that justify the investment in the first place.
BORGWARNER

Moat: Power electronics and integration depth

Holding motor design, inverter engineering, silicon carbide capability and control software internally lets the business quote genuine multi-in-one drive units rather than assembling around purchased content. That breadth is what wins programmes at manufacturers weighing whether to build internally, because very few in-house teams hold all four disciplines convincingly at once.
BORGWARNER

Risk: Combustion portfolio transition burden

A substantial legacy business tied to internal combustion content must be managed down while electrified investment continues, and the timing of that crossover depends on electrification schedules the company does not control. Repeated timeline slippage stretches the transition and leaves capacity funded against volumes that keep moving further out.

Players Tracked

Prominent Players

BYD FinDreams Powertrain
Nidec
BorgWarner
Schaeffler
ZF Friedrichshafen

Other Key Players

Robert Bosch
Denso
Hitachi Astemo
Valeo
Magna International
Inovance Technology
Hyundai Mobis
Aisin Corporation
Dana Incorporated
American Axle and Manufacturing
LG Magna e-Powertrain
Jing-Jin Electric
Fukuta Electric Machinery
Marelli
Mahle

Recent Developments

MARCH 2025

Silicon carbide inverter production launched for eight hundred volt platform

A supplier began series production of a silicon carbide traction inverter for an 800 volt passenger vehicle platform during the year, which delivers exactly the switching efficiency that higher voltage architectures require and adds meaningful vehicle range on an entirely unchanged battery pack for that manufacturer.
Signal: Silicon carbide capability rather than mot
JULY 2025

Externally excited motor architecture qualified for volume programme

A drive unit manufacturer qualified an externally excited synchronous traction motor for a volume passenger programme, which removes rare earth magnet dependence from that platform entirely after Chinese export controls had exposed a meaningful share of drive unit cost to pricing nobody outside China controls.
Signal: Magnet supply security is now driving moto
NOVEMBER 2025

Manufacturer reverses in-house drive unit programme toward supply agreement

A European vehicle manufacturer abandoned a substantial part of its internal drive unit development and signed a multi-year external supply agreement with an independent supplier instead, having concluded that integration breadth across mechanical, power electronics, thermal and software engineering exceeded what its internal team could deliver on schedule.
Signal: Vertical integration is proving considerab

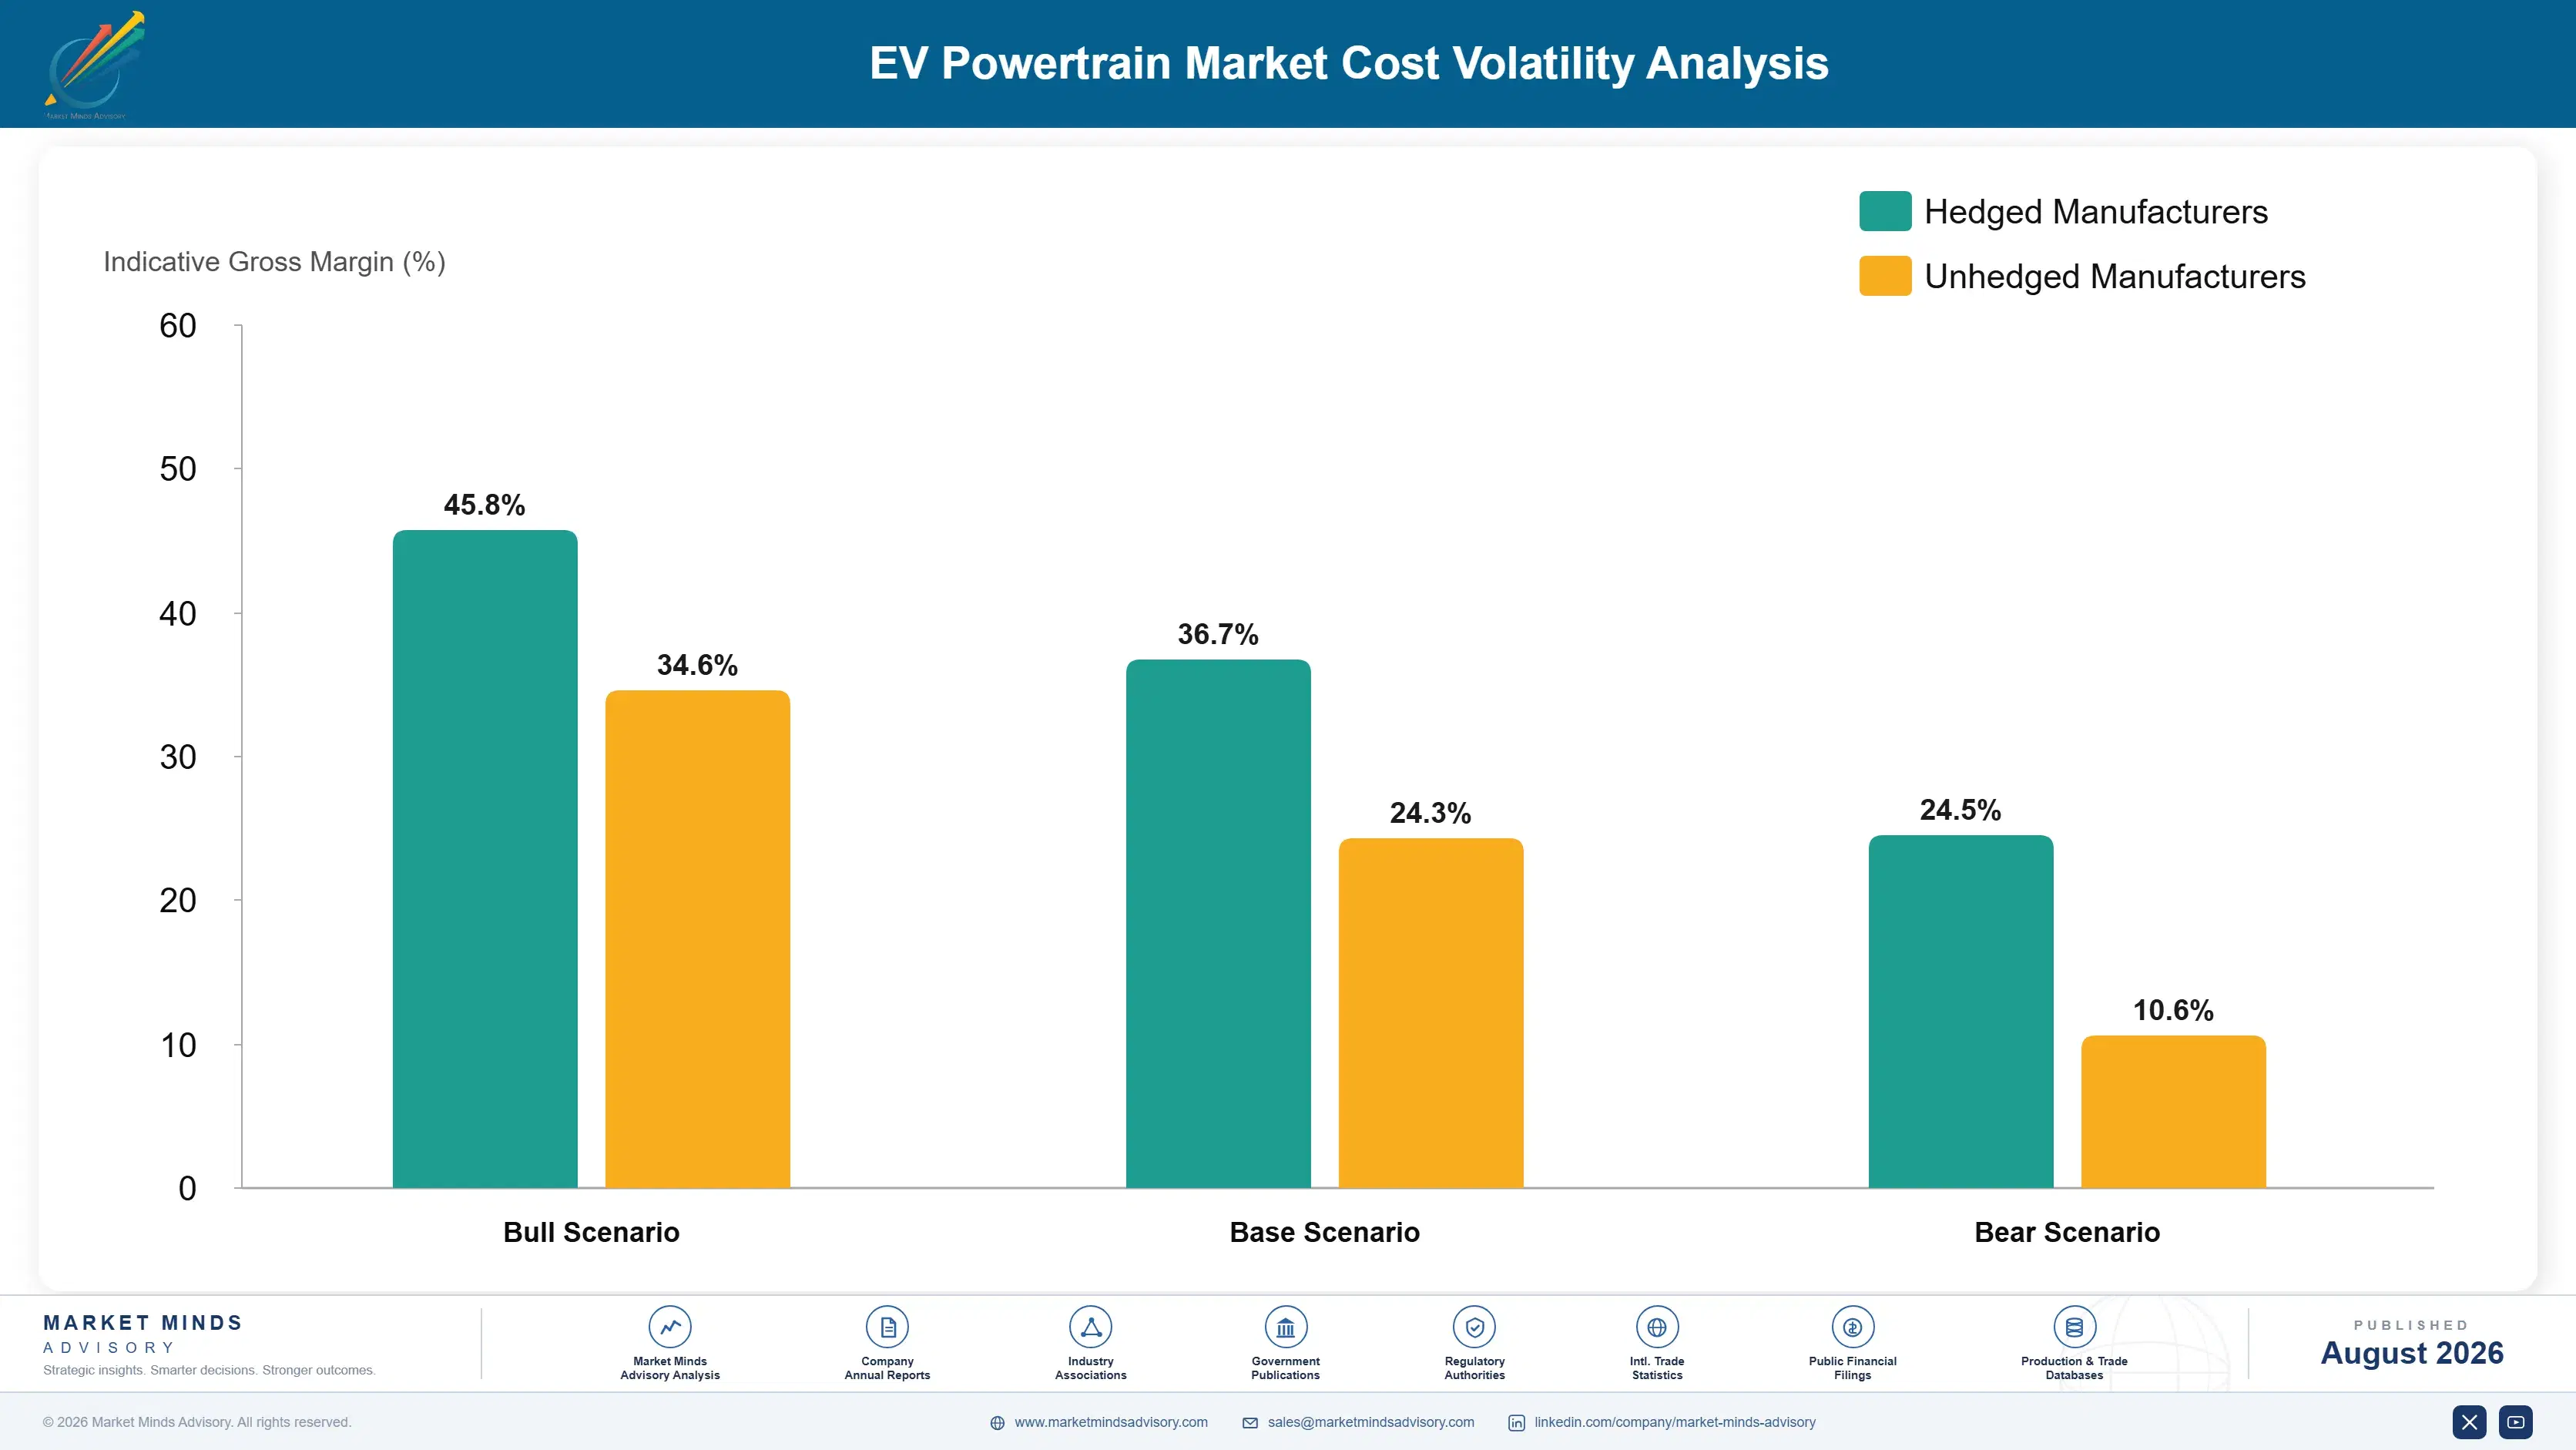
What Drives Drive Unit Cost

Power electronics dominate. Inverter semiconductors, gate drivers, capacitors and the control board together reach roughly 34% of drive unit cost, with silicon carbide devices carrying a premium that has narrowed but not closed. Motor content adds around 28%, of which rare earth magnets alone account for roughly 14% of the total unit. Gearbox castings, gears and bearings contribute a further 18%, and thermal hardware about 9%.
Rare earth magnet pricing moved sharply through 2024 and 2025 as Chinese export controls tightened on neodymium and dysprosium, and suppliers absorbed increases they could not pass through under fixed multi-year programme pricing. Silicon carbide device costs moved the opposite way as wafer capacity expanded. BorgWarner Annual Report 2025 identifies commodity and electrified component cost as continuing margin factors, and IEA Global EV Outlook tracks the underlying component cost trajectory.

The disadvantage mechanism is motor topology rather than purchasing scale. A supplier whose entire range depends on permanent magnet motors carries exposure that a competitor holding qualified externally excited or induction designs simply does not, and during an export restriction that difference is production continuity rather than price. Exposure varies geographically too, since Chinese suppliers source magnets domestically at prices no importer matches.
ev-powertrain-market-trends-growth-cost-volatility-analysis-1787316986360

Qualify motor topologies avoiding rare earth magnet dependence

Externally excited synchronous and induction architectures remove neodymium and dysprosium dependence entirely, at some cost in efficiency and package size. On many volume platforms that trade is genuinely acceptable, particularly where battery capacity rather than motor mass constrains the design. Suppliers holding both topologies quote whichever the programme economics favour rather than being locked into one exposed supply position permanently.

Contract semiconductor supply across multiple qualified vendors

Silicon carbide device supply concentrates among a small group, and qualifying comparable parts from two or three vendors without requalifying the inverter design removes the allocation exposure that a demand spike creates. The cost is duplicated validation at design stage. Against a stopped production line, which the 2021 shortage delivered across this industry, that cost recovers within one incident.

Design housings and gearsets common across integration levels

Shared castings, gearsets and mounting interfaces across three-in-one and multi-in-one variants concentrate purchasing, cut tooling investment and simplify the spare parts position considerably. The constraint is that each variant is then slightly less optimised for its own application. On a cost base where mechanical content approaches a fifth of the total, that compromise is worth accepting on most programmes.

Portfolio Architecture for Margin Defence

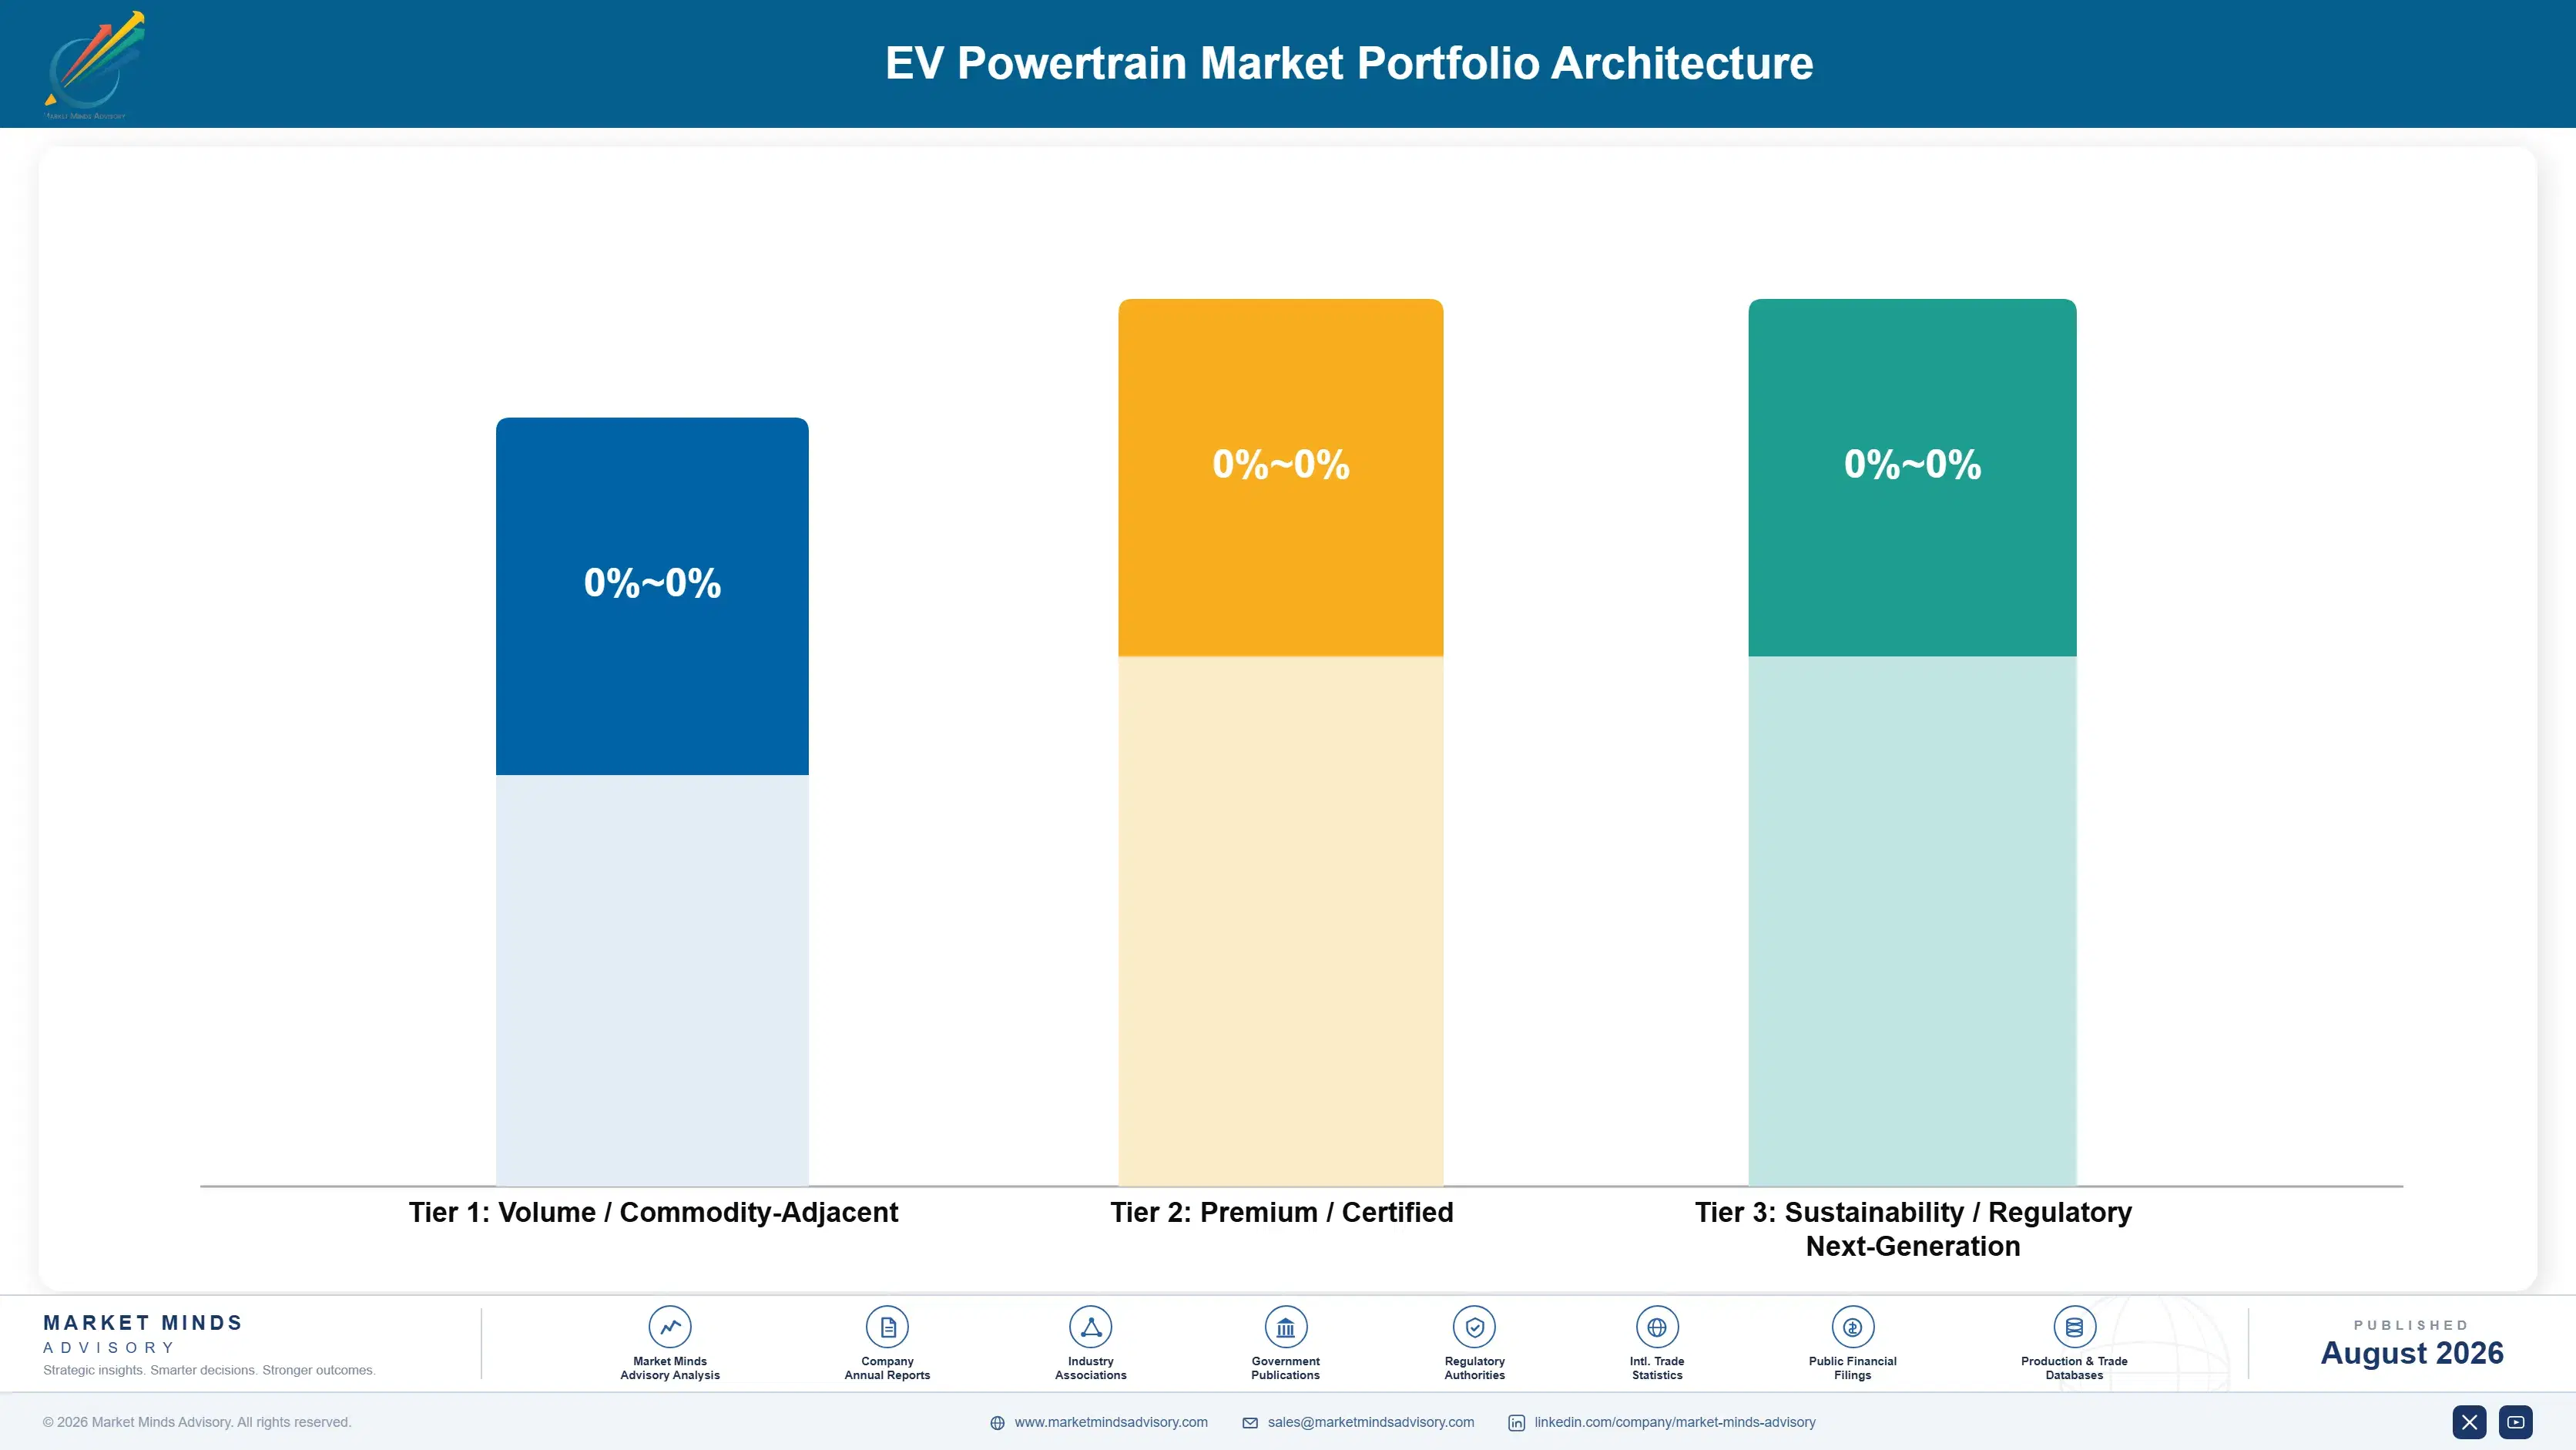
Portfolio economics here divide on capability breadth rather than on volume. Discrete component supply, meaning a motor or a gearbox quoted separately into a programme somebody else integrates, earns gross margins in the low teens because the engineering is settled, many suppliers quote comparable parts and the customer holds the integration knowledge that would otherwise justify a premium. Volume secures the relationship rather than any margin.
The premium tier is three-in-one drive units with silicon carbide inverters. Combining motor, inverter and gearbox with wide bandgap switching demands power electronics capability that discrete suppliers lack, and it delivers range benefits manufacturers will pay for directly. Margins run in the mid twenties to low thirties. Power electronics ownership decides where in that range a supplier actually lands.

Above both sits multi-in-one integration for manufacturers without internal capability. Packaging motor, inverter, gearbox, charger and converter together demands mechanical, power electronics, thermal and software engineering in one organisation, which very few suppliers hold. Realised value runs roughly 2.4 times a three-in-one assembly, margins reach the high thirties, and the position is the only one that genuinely holds against a customer weighing whether to build internally.

Volume / Commodity-Adjacent

Discrete motors, gearboxes or inverters quoted separately into programmes integrated by somebody else. Settled engineering and many credible suppliers keep pricing under constant pressure and margin near the floor throughout.
Gross Margin: 11 to 17%

Premium / Certified

Three-in-one drive units incorporating silicon carbide inverters and integrated thermal management. The range reflects how much of the power electronics capability a supplier genuinely owns rather than purchasing it from third parties.
Gross Margin: 24 to 32%

Sustainability / Regulatory / Next-Generation

Multi-in-one integrated drive units combining six or more functions in one housing. The range is wide because early programmes carry development recovery while later ones price against a thin competitive field.
Gross Margin: 34 to 42%
ev-powertrain-market-trends-growth-portfolio-architecture-1787316986881

High-value Sub-segments and Strategic Watch-out

Multi-in-One Units For Non-Integrating Manufacturers

High value and high growth sitting very squarely together. Integration breadth across all four engineering disciplines is the only position that genuinely holds against customers weighing internal development, and realised value runs a long way above any three-in-one assembly built on the same underlying platform.
Gross Margin: 36 to 43%

Silicon Carbide Inverter Programmes

High value running on genuinely strong growth. Eight hundred volt architectures make wide bandgap switching effectively mandatory, the design difficulty involved thins the competitive field considerably, and device pricing has now fallen far enough that the old cost objection no longer applies to any new programme.
Gross Margin: 30 to 37%

Three-in-One Volume Drive Units

The volume core that keeps assembly capacity properly loaded and platform relationships alive between higher-value programmes. Margins sit only moderate because the architecture is now mature and very widely quoted, but the volumes involved underwrite very nearly everything else that the wider business actually does.
Gross Margin: 20 to 27%

Discrete Component Supply Programmes

The strategic watch-out sitting squarely inside this particular portfolio. Volumes here are real enough and they keep plants loaded, but the customer holds the integration knowledge, pricing faces constant pressure and nothing durable at all accrues to the supplier from the relationship itself over time.
Gross Margin: 11 to 17%

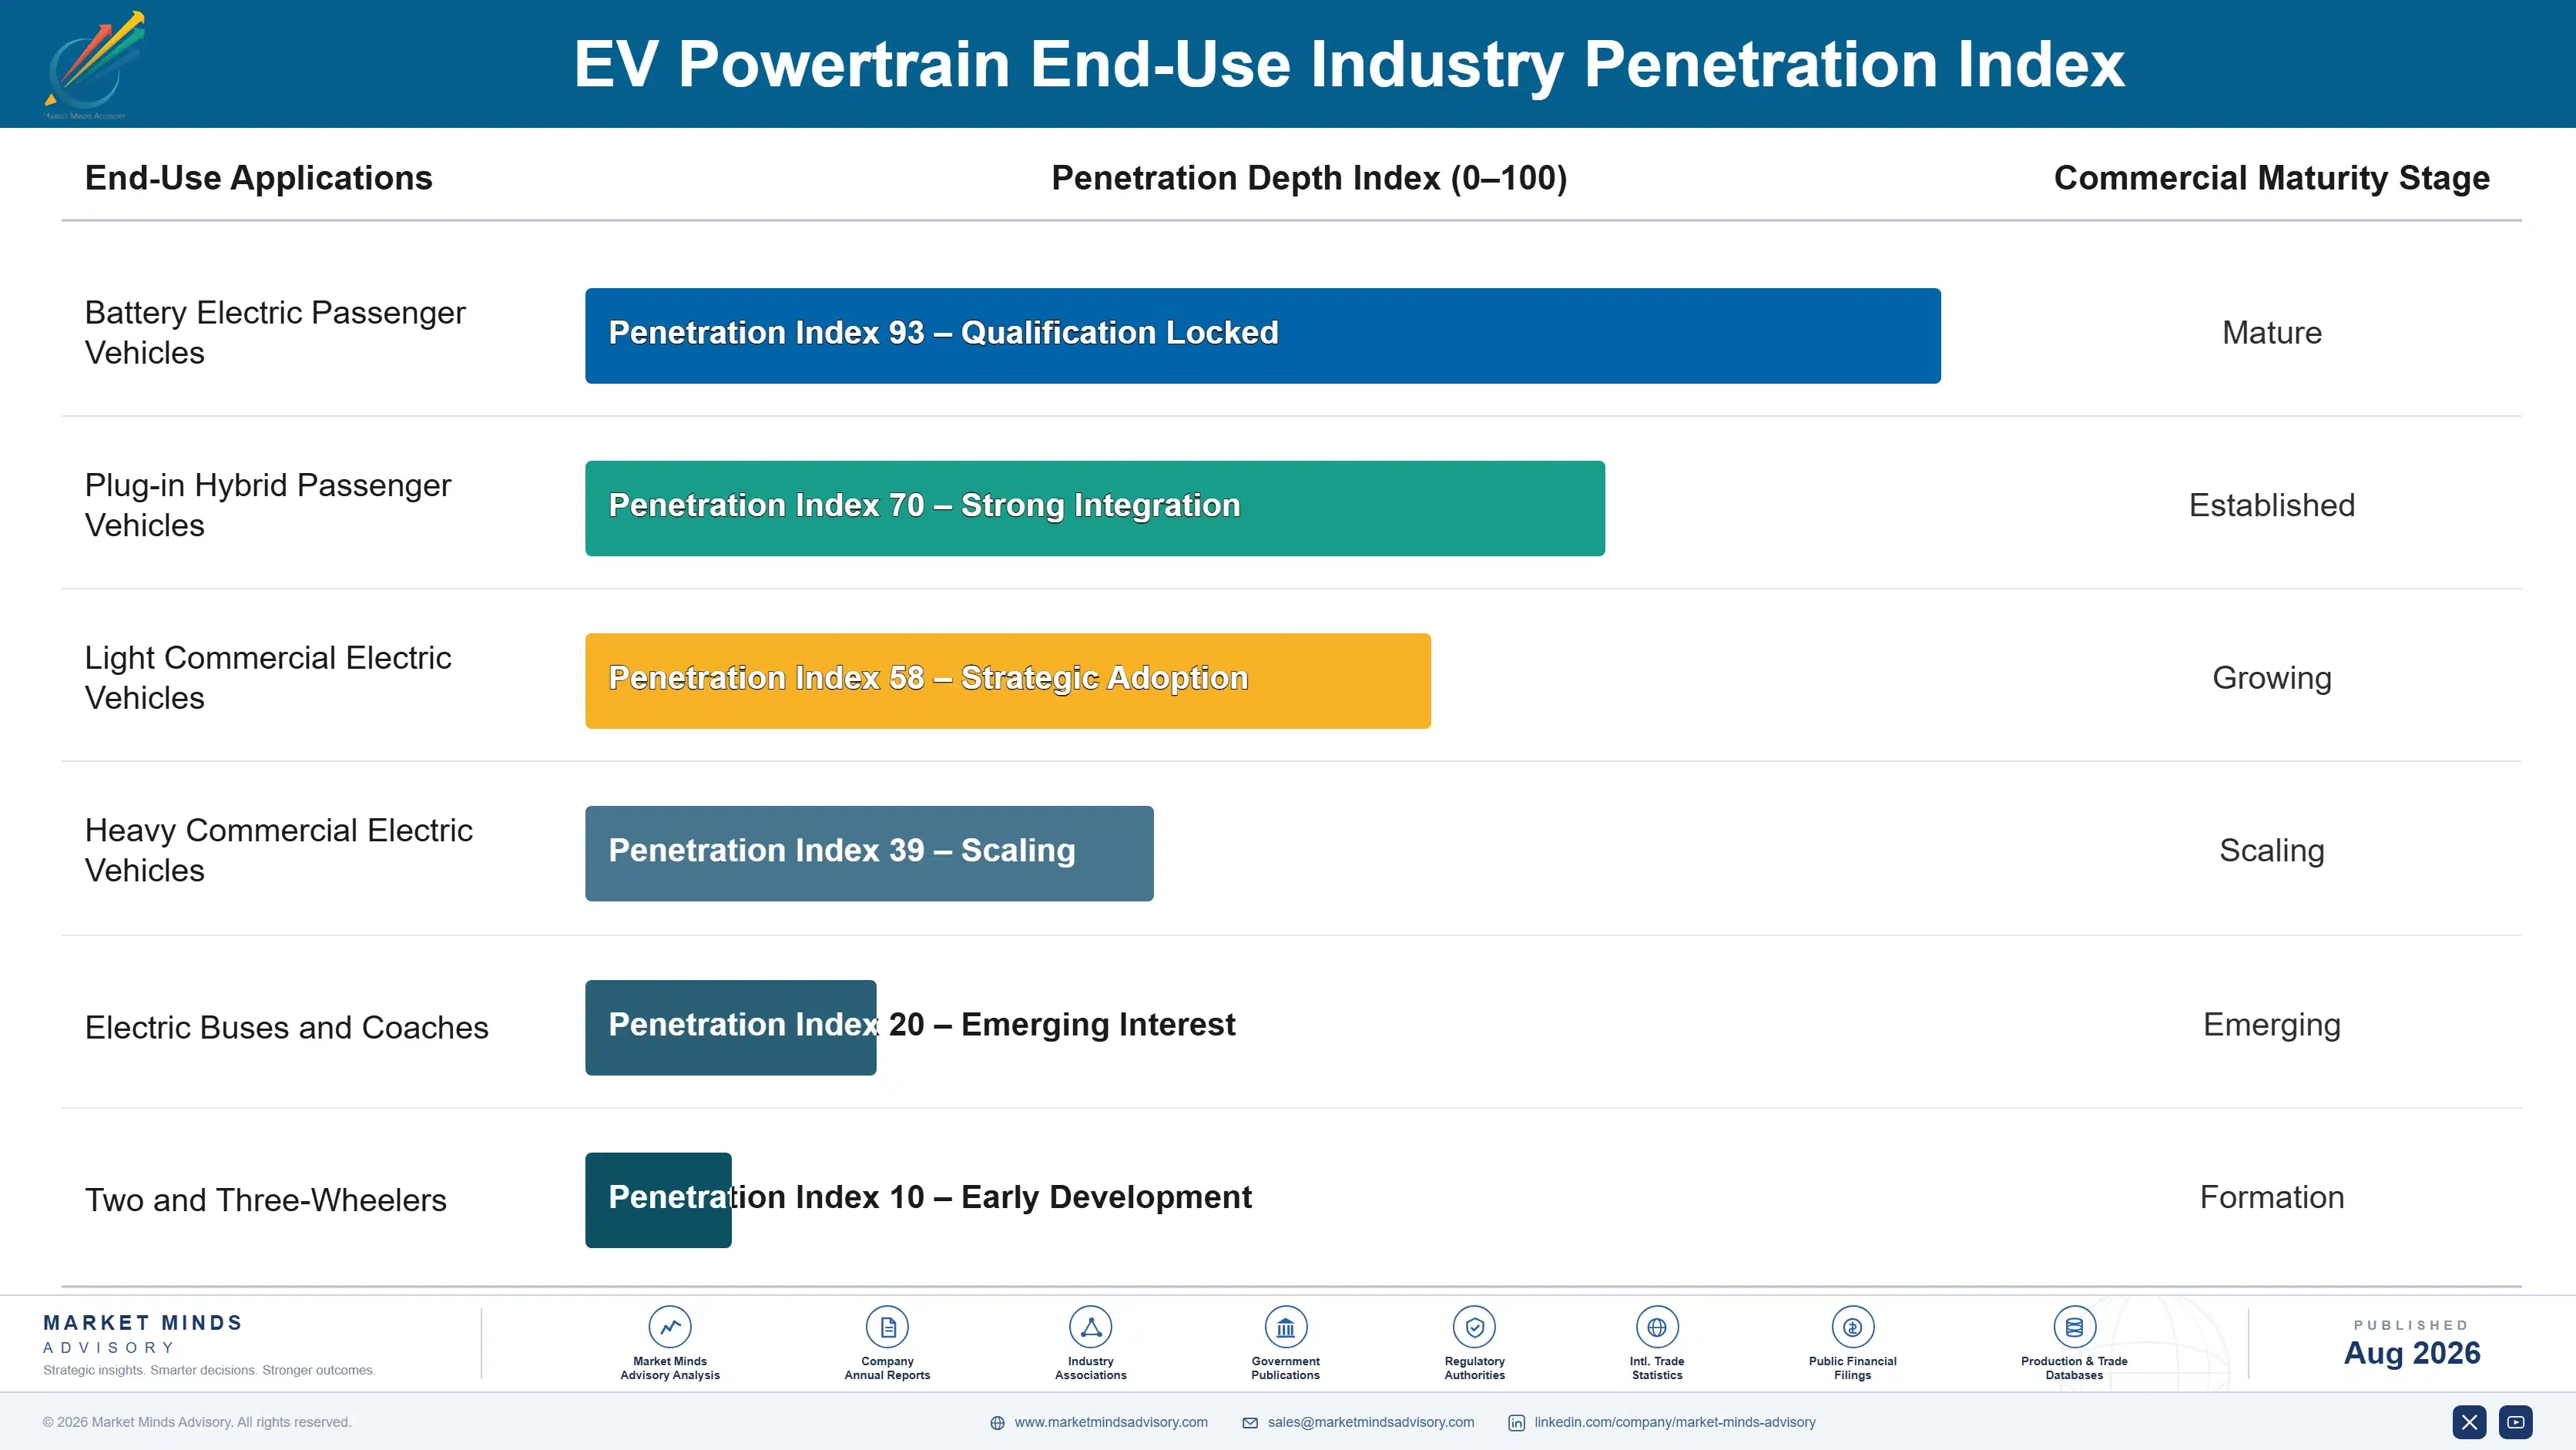
How Drive Unit Demand Repeats

The repeat business is the vehicle platform rather than any individual order. A drive unit qualified onto a platform ships for six to eight years of production against release schedules that arrive regardless of anything else, and the architecture is rarely revisited mid-programme because requalifying motor calibration and thermal behaviour is expensive and slow. Winning the original architecture decision therefore carries far more value than the development contract itself suggests it does.
Stickiness varies considerably by customer type. Manufacturers without internal capability are the stickiest, because the integration knowledge sits with the supplier and rebuilding it internally takes years they do not have. Manufacturers running partial internal programmes are considerably less sticky, since every supplied unit is implicitly a decision they could reverse. Chinese domestic platforms are the least sticky, switching on delivered cost with a domestic supply base deep enough to make that practical.

The buyer profile has shifted decisively. Powertrain specification once sat with engine engineers evaluating torque curves and fuel maps. Today it sits with electrified platform teams weighing efficiency across the drive cycle, thermal behaviour, software interfaces and charging architecture together, which favours suppliers arriving with systems engineers rather than only with hardware samples.
ev-powertrain-market-trends-growth-end-use-penetration-index-1787316987365

Where To Compete And Why

These are among the four positions where our research anticipates prominent divergence between winners and laggards over the coming forecast period. Each is grounded in the demand model, the regulatory perimeter, and the announced capacity pipeline.
01 / INTEGRATION BREADTH OWNERSHIP

Sell what customers cannot build themselves

A multi-in-one drive unit demands mechanical, power electronics, thermal and control software engineering in one organisation, and manufacturers building internally generally hold two of those four disciplines convincingly rather than all four of them. Suppliers offering genuine multi-in-one capability realise roughly 2.4 times three-in-one value, and they win programmes at customers who would otherwise have built in house. That breadth takes years to assemble properly, and it remains the only genuinely defensible position available against a customer determined to integrate.
02 / WIDE BANDGAP CAPABILITY

Silicon carbide decides who quotes at all

Eight hundred volt architectures make wide bandgap switching effectively mandatory, and devices switching that fast create electromagnetic interference and thermal problems that punish inexperienced teams badly. Suppliers holding proven silicon carbide inverter design realise 22% to 30% higher prices than silicon equivalents while adding roughly 6% vehicle range on an unchanged battery. Device pricing has fallen far enough that the constraint is now engineering capability rather than component economics, and that capability takes several full programme cycles to build from nothing.
03 / MAGNET TOPOLOGY HEDGING

Qualify motors that need no rare earths

Permanent magnet traction motors depend directly on neodymium and dysprosium, and Chinese export controls tightened through 2024 and 2025, exposing roughly 14% of drive unit cost to pricing nobody outside China influences at all. Suppliers qualifying externally excited synchronous and induction architectures alongside their magnet designs cut that exposure sharply, and they quote whichever topology the programme favours. The trade involved is efficiency and package size, and on many volume platforms that trade proves comfortably acceptable to the customer buying.
04 / CAPACITY COMMITMENT TERMS

Never fund capacity against an announcement

Suppliers who built dedicated capacity against manufacturer electrification announcements now carry roughly 35% underutilisation on those assets, and several of them have already written that investment down entirely. Contracts carrying minimum volume commitments or capacity reservation fees shift that risk squarely onto whoever actually controls the production decision itself. Manufacturers resist these terms strongly, which is precisely why the negotiation matters so much, and the suppliers who did secure such terms are the ones still earning acceptable returns on electrified programmes today.

Engagement Snapshot From the Field

A live engagement with an industry participant carrying material or product regulatory and market exposure ahead of a defining policy shift, showing how our research translates into a defensible multi-year portfolio strategy.
MARKET MINDS ADVISORY · CLIENT ENGAGEMENT SUMMARY
EV Powertrain Producer Strategic Portfolio Review and Transition Roadmap 2026·Investment Scenario on EV Powertrain Exposure Evaluation 2025-26
CLIENT PROFILE
A European manufacturer of electric drive components with annual revenue near $1.1 billion (client-reported, unverified by MMA), roughly 68% of it from motors and gearboxes supplied as discrete components into programmes integrated by others. The business held strong mechanical engineering and long manufacturer relationships but limited power electronics capability, and it had committed substantial capacity against electrification volumes that subsequently slipped by three years.
STRATEGIC CHALLENGE
Discrete component margins had fallen into the low teens while the dedicated capacity built for a major programme ran at under half utilisation. Management needed to decide whether to acquire power electronics capability and move toward integrated drive units, reposition toward Chinese and Indian customers where volume was actually growing, or consolidate capacity and manage the existing business for cash.
MMA APPROACH
MMA modelled drive unit demand across 58 global vehicle platforms through 2038, separated addressable volume from volume already committed to in-house manufacturing by customer, and assessed acquisition, repositioning and consolidation economics for each route. Twenty-seven expert interviews with platform engineers, powertrain directors and procurement leads tested where architecture decisions were genuinely being made and when.
KEY FINDINGS
  1. Roughly 38% of forecast platform volume was already committed to in-house manufacturing, which meant the addressable market grew considerably more slowly than the headline electrification numbers implied.
  2. Manufacturers without internal capability consistently ranked integration breadth above unit price when awarding drive unit programmes, which favoured capability investment over cost reduction decisively.
  3. The client's dedicated capacity could be converted to flexible production covering three architectures for roughly a third of the cost of writing it down and rebuilding elsewhere.
  4. Chinese and Indian customers offered genuine volume growth but at realised pricing 35% below European levels, making the repositioning a volume play rather than any kind of margin improvement.
CLIENT PROFILE
A European manufacturer of electric drive components with annual revenue near $1.1 billion (client-reported, unverified by MMA), roughly 68% of it from motors and gearboxes supplied as discrete components into programmes integrated by others. The business held strong mechanical engineering and long manufacturer relationships but limited power electronics capability, and it had committed substantial capacity against electrification volumes that subsequently slipped by three years.
STRATEGIC CHALLENGE
Discrete component margins had fallen into the low teens while the dedicated capacity built for a major programme ran at under half utilisation. Management needed to decide whether to acquire power electronics capability and move toward integrated drive units, reposition toward Chinese and Indian customers where volume was actually growing, or consolidate capacity and manage the existing business for cash.
MMA APPROACH
MMA modelled drive unit demand across 58 global vehicle platforms through 2038, separated addressable volume from volume already committed to in-house manufacturing by customer, and assessed acquisition, repositioning and consolidation economics for each route. Twenty-seven expert interviews with platform engineers, powertrain directors and procurement leads tested where architecture decisions were genuinely being made and when.
KEY FINDINGS
  1. Roughly 38% of forecast platform volume was already committed to in-house manufacturing, which meant the addressable market grew considerably more slowly than the headline electrification numbers implied.
  2. Manufacturers without internal capability consistently ranked integration breadth above unit price when awarding drive unit programmes, which favoured capability investment over cost reduction decisively.
  3. The client's dedicated capacity could be converted to flexible production covering three architectures for roughly a third of the cost of writing it down and rebuilding elsewhere.
  4. Chinese and Indian customers offered genuine volume growth but at realised pricing 35% below European levels, making the repositioning a volume play rather than any kind of margin improvement.
RECOMMENDED STRATEGY
Phase 1: Phase one: convert the underutilised dedicated capacity to flexible production covering multiple drive architectures, relieving the utilisation problem before any acquisition spending. Phase 2: Phase two: acquire power electronics and inverter capability, targeting integration breadth rather than cost, since that is what non-integrating manufacturers actually pay a premium for. Phase 3: Phase three: pursue Indian volume selectively where local content incentives improve the economics, rather than competing on price across the whole region.
OUTCOME
The client converted both dedicated lines within ten months and lifted utilisation from 46% to 78% (client-reported, unverified by MMA). The power electronics acquisition completed the following year, two integrated drive unit programmes have since been won from manufacturers that had been evaluating internal development, and blended gross margin improved by roughly seven points.

Frequently Asked Questions

Foundational context covering the market sizes, CAGR, scope, country, region and competition that inform every finding below. This section is provided to cover basics and most often pre-purchase conversations, answered from the MMA Primary Research Dataset.

What is the current size of the EV Powertrain Market?

The global electric vehicle powertrain market was valued at $88.00 billion in 2025, reaching an estimated $98.03 billion in 2026. That covers traction motors, inverters, gearboxes, chargers, converters and integrated drive units.

How large will the EV Powertrain Market be by 2036?

MMA forecasts the market reaching $288.53 billion by 2036, an increase of $190.50 billion over the 2026 base. That represents an expansion multiple of 2.94 times across the forecast period.

What is the CAGR for the EV Powertrain Market 2026 to 2036?

The base case compound annual growth rate is 11.4%, with a bull case of 12.6% and a bear case of 10.2%. Historical growth between 2020 and 2025 ran at 10.0% annually.

Which segment is growing fastest?

Multi-in-one integrated drive units grow at 17.1%, a full 1.50 times the market rate, as drive units absorb chargers and converters. Three-in-one electric drive units follow at 14.0% annually.

Who are the major companies in the EV Powertrain Market?

BYD FinDreams Powertrain, Nidec, BorgWarner, Schaeffler and ZF Friedrichshafen lead on drive unit shipment volume. Together they account for roughly 31% of global volume, which is unusually fragmented.

Which country is growing fastest?

India grows fastest at 14.2% annually, driven by two and three-wheeler electrification plus production linked incentives pulling component manufacturing behind assembly. Vietnam and Thailand follow closely.

Report Segmentation Architecture

The full report scope spans multiple orthogonal segmentation dimensions, with cross-tabulated demand data provided for each dimension pair. Coverage extends further to regional breakdowns, trend trajectories, and the competitive detail needed to support segment-level decision-making.

By Powertrain Integration Level

  • Multi-in-One Integrated Drive Unit
  • Three-in-One Electric Drive Unit
  • Integrated Power Electronics Module
  • Two-in-One Motor and Gearbox Assembly
  • Discrete Component Supply

By End-Use Industry

  • Battery Electric Passenger Vehicles
  • Plug-in Hybrid Passenger Vehicles
  • Light Commercial Electric Vehicles
  • Heavy Commercial Electric Vehicles
  • Electric Buses and Coaches
  • Two and Three-Wheelers

By Commercial Dimension

  • Vehicle Manufacturer Direct Supply
  • Tier One System Integrator Supply
  • Technology Licensing Arrangements
  • Joint Venture Manufacturing Supply
  • Contract Assembly and Build-to-Print Supply

By Region

  • North America
  • Western Europe
  • East Asia
  • South Asia and Pacific
  • Latin America
  • Middle East and Africa
  • Eastern Europe

Scope, Methodology, and Coverage

Every figure in this report is reproducible from documented input assumptions. The scope below maps the historical period, the forecast horizon, the segmentation dimensions, and the countries covered, alongside the underlying primary and qualitative methodology.
Historical Period
2020 to 2025
Forecast Period
2026 to 2036
Base Year
2025 (USD billions; MMA Primary Research Dataset, August 2026)
Market Definition
This report covers electric traction powertrain systems and components for on-highway vehicles, spanning traction motors, inverters, reduction gearboxes, onboard chargers, direct current converters, power distribution units and integrated drive units combining several of those functions, across battery electric, plug-in hybrid and hybrid platforms including passenger cars, commercial vehicles, buses and two and three-wheelers. Battery cells, modules and packs, battery management systems, charging infrastructure, hydrogen fuel cell stacks, internal combustion engines and conventional transmissions are excluded.
Quantitative Units
USD billions at manufacturer realised value; drive unit shipments in millions; average realised price in USD per unit.
Segmentation Dimensions
By powertrain integration level; by end-use industry; by commercial dimension; by region.
Regions Covered
North America, Western Europe, East Asia, South Asia and Pacific, Latin America, Middle East and Africa, Eastern Europe
Countries Covered
China, Japan, South Korea, United States, Canada, Mexico, Germany, France, United Kingdom, Italy, Spain, Sweden, India, Thailand, Vietnam, Indonesia, Brazil, South Africa, Poland, Hungary.
Key Companies Profiled
BYD FinDreams Powertrain, Nidec, BorgWarner, Schaeffler, ZF Friedrichshafen, Robert Bosch, Denso, Hitachi Astemo, Valeo, Magna International, Inovance Technology, Hyundai Mobis, LG Magna e-Powertrain, Jing-Jin Electric and others.
Quantitative Methodology
Primary survey, n=3,800 respondents, Q4 2025, six countries; demand-side model with trade association cross-validation
Qualitative Methodology
47 expert interviews, Q4 2025; applied to validate demand model assumptions, identify emerging dynamics, and assess competitive positioning
Report Format
PDF and XLSX data workbook (Word format preview document)
Publisher
Market Minds Advisory
Report Code
MMA-2026-AUT-956
Published
August 2026
Contact
sales@marketmindsadvisory.com | www.marketmindsadvisory.com

Purchase the full EV Powertrain Market Report (2026 to 2036).

The full report sizes the electric vehicle powertrain market across five integration levels, six end-use industries and seven regions, with unit shipment and realised pricing detail behind every value estimate. It profiles twenty global suppliers on integration breadth, silicon carbide capability and motor topology position. Regional chapters cover vehicle production outlook, vertical integration by manufacturer and local content policy by market. Addressable market analysis separates volume committed to in-house manufacturing from volume genuinely open to independent suppliers. Cost analysis tracks semiconductor and rare earth magnet exposure across motor architectures.
Drive unit shipment and pricing by integration level
Vertical integration mapping by vehicle manufacturer
Silicon carbide adoption forecasts through 2036
Rare earth exposure across traction motor topologies
Competitive position assessments across twenty global suppliers
Addressable versus in-house volume split by platform

Built For The People Who Decide

From boardroom strategy to bench-side execution, this report is read cover-to-cover by leaders shaping the next decade of their industry, turning demand scenarios, market dynamics and valuation benchmarks into decisions.
CXOs/ Presidents/ VPs/ Managers
M&A and Corporate Development
Strategy Teams and R&D Heads
Procurement and Product Directors
Regulatory and Compliance Leaders
Investor Relations and Equity Analysts