Market Minds Advisory
Europe Silica Sand for Glass Making Market

Europe Silica Sand for Glass Making Market: Europe Silica Sand For Glass: A Cheap Mineral With Expensive Freight

A commercial reading of European glass sand, where the mineral itself costs almost nothing, the haulage costs more than the material, and a permit refusal can close a supply position permanently.

Lead Analyst

Bilal Shaikh

Published

August 2026

Make Smarter Decisions with Customized Research Insights

Request a free sample report and evaluate market opportunities, growth trends, and competitive dynamics relevant to your business needs.

2025 MARKET VALUE$1.9BMarket Size 2025
2036 FORECAST VALUE$3.0BBase Case , 2026 to 2036
CAGR 2026 TO 20364.4 %Bull 5.5% / Bear 3.2%
INCREMENTAL OPPORTUNITY$1.1BNet 10- year value creation
EXPANSION MULTIPLE1.54x2036 value over 2026 base
Strategic Levers
M&A Pipeline
Regional Outlook
Country Rankings
Competitive Intelligence
Segmental Deep-dive
Call-Us : 91 93563 13602

Executive Snapshot and Market Trajectory.

Silica sand is one of the cheapest industrial minerals in Europe and one of the most expensive to move. Haulage frequently exceeds the value of the sand inside the truck, so every quarry serves a radius rather than a market, and a permit refusal removes a position nobody can replace.
The market stands at USD 1.9 billion in 2025 and reaches USD 3.05 billion by 2036 at a 4.4% CAGR. Ultra-low iron solar glass sand grows fastest at 9.8%, about 2.23 times the overall rate, as European photovoltaic glass capacity is built to reduce dependence on Chinese supply. Western Europe holds 66% of value, while Poland posts the quickest national growth at 5.4%. Reserves alone decide very little.
Concentration is severe, with the top five holding roughly 64% of European glass sand revenue because reserves, permits, and processing plants are all fixed assets nobody replicates quickly. Two forces pull against each other. Container glass and solar glass demand both grow while flat glass tracks a construction market that has not recovered, and permitting for new extraction has become slower and more contested in almost every member state. Consent is the scarce thing.
Market Definition
The Europe silica sand for glass making market covers processed silica sand supplied to glass manufacturers across Europe, spanning container glass sand, flat and float glass sand, ultra-low iron solar glass sand, fibreglass and technical glass sand, and tableware and specialty glass sand. Silica sand for foundry casting, hydraulic fracturing, filtration, sports surfaces, construction aggregate, or chemical silicon production is excluded, as are cullet and recycled glass, soda ash, limestone and other batch materials, and glass manufacturing itself.
Base Year Value
$1.9B in 2025 (MMA Primary Research Dataset, August 2026)
Forecast Period
2026 to 2036, eleven discrete annual values
CAGR
4.4% base case. Bull 5.5%. Bear 3.2%.
Fastest Growth Segment
Ultra-Low Iron Solar Glass Sand: 9.8% CAGR
Fastest Growth Country
Poland: 5.4% CAGR
Fastest Growth Region
South Asia and Pacific: 6.2% CAGR
Largest Region
Western Europe: 66% of 2025 global value
Market Leaders
Sibelco, Quarzwerke Group, Strobel Quarzsand, Kremer Group, Sablieres de Nemours. Source: MMA Analysis based on company annual reports.
Primary Survey
n=3,800 procurement and R&D decision-makers, Q4 2025, six countries
Methodology
Demand-side build-up, cross-validated against public data, 47 expert interviews

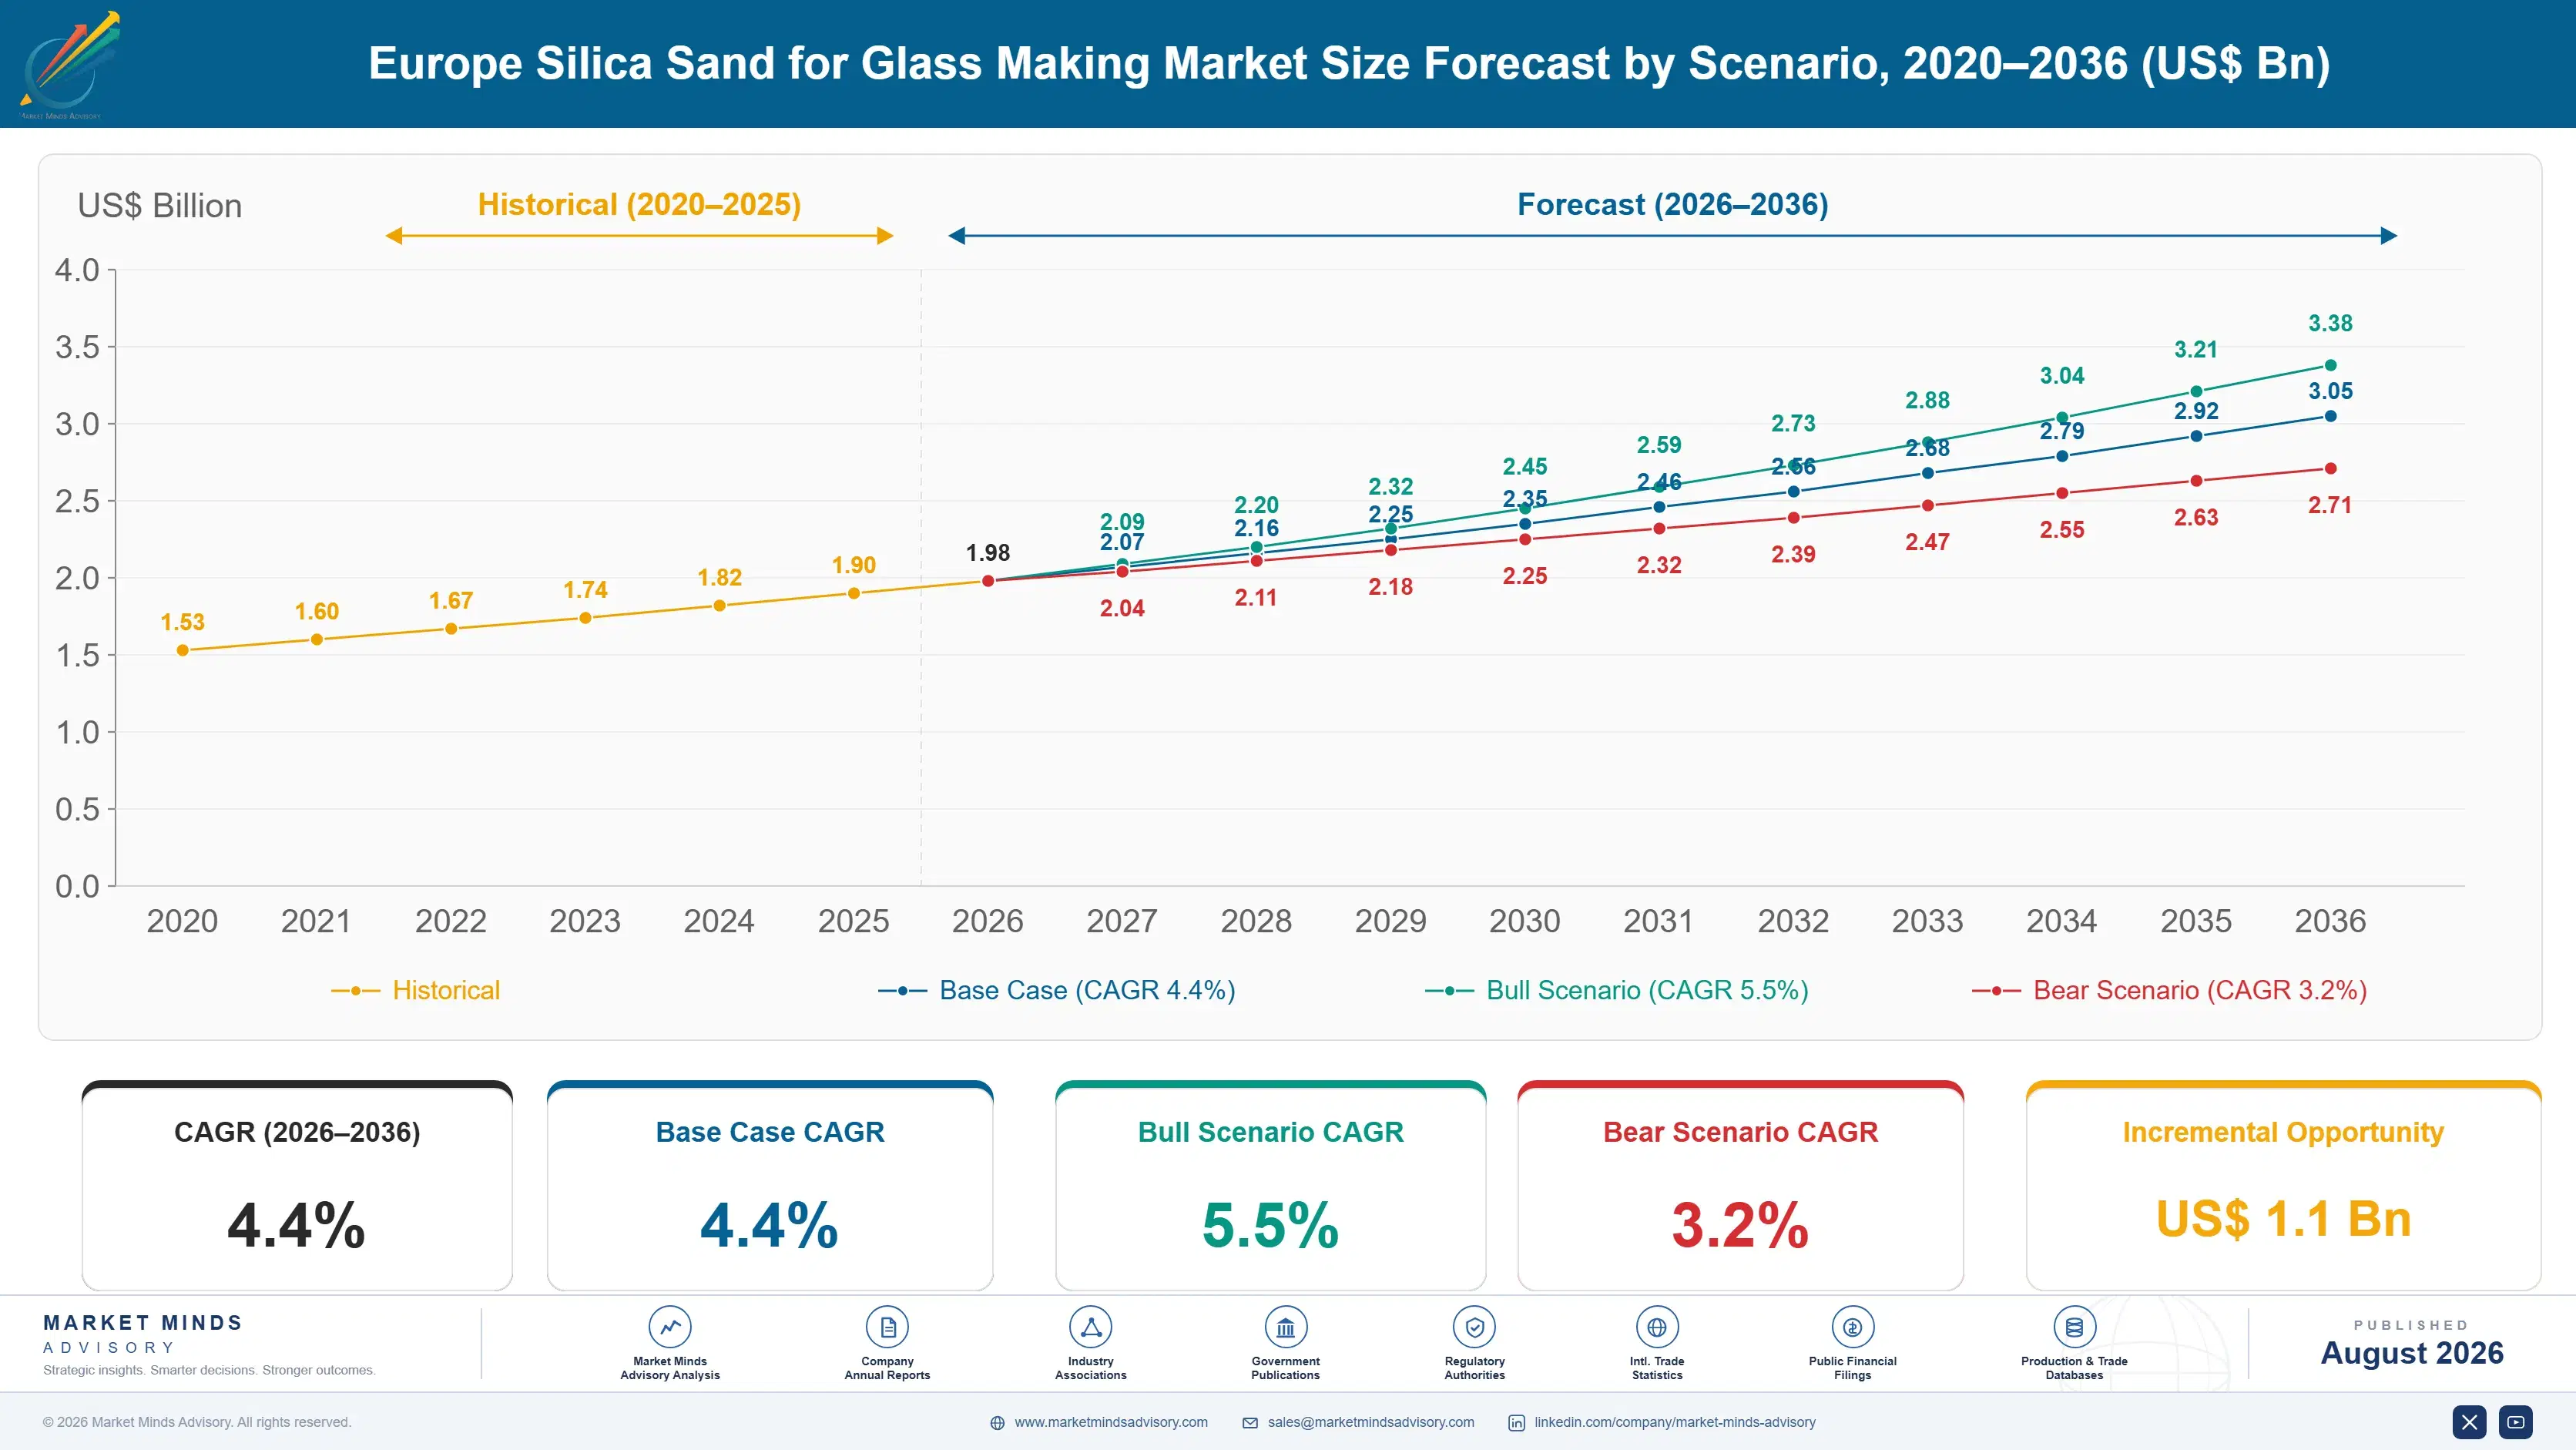
Europe Silica Sand for Glass Making Market Forecast Scenarios

europe-silica-sand-for-glass-making-market-size-forecast-scenario-1787332519326
Growth from 2020 to 2025 compounded near 3.4%, and energy rather than mineral demand shaped the period. European glass furnaces cut output through 2022 as gas prices rose to levels that made some production uneconomic, and sand volumes fell with them. Container glass recovered first because food and beverage packaging does not stop. Flat glass never fully recovered because European construction did not either.
Three mechanisms carry the base case to 4.4%. First, container glass volume, which follows food, beverage, and pharmaceutical packaging and grows steadily regardless of construction cycles. Second, solar glass capacity, where European photovoltaic manufacturing investment creates demand for ultra-low iron sand that very few European deposits can actually meet. Third, cullet limits, since recycled glass displaces some sand but furnace chemistry and colour requirements cap how far substitution can go.
The bull case at 5.5% assumes European solar glass capacity is built on announced timetables and construction recovers enough to lift flat glass. The bear case at 3.2% assumes energy costs keep European furnaces uncompetitive against imports, flat glass demand stays depressed, cullet rates rise faster than expected, and permitting delays prevent producers serving demand even where it exists within haulage distance.

A Radius Business, Not A Market

Demand rests on three foundations. Glass furnace output provides the volume, since sand consumption tracks tonnes melted almost exactly and nothing substitutes beyond what cullet already displaces. Purity provides the value, because iron content decides whether a deposit can serve solar or optical applications or only container glass. And geography provides the whole commercial structure, since freight is roughly 54% of delivered cost and beyond 300 kilometres the economics stop working.
MARKET CONCENTRATIONCR5: 64%Concentrated because reserves and permits are fixed unreplicable assets
ECONOMIC HAULAGE RADIUS150 to 300 kilometresDistance beyond which freight exceeds the value carried
FREIGHT COST SHAREAbout 54%Transport as a portion of delivered sand cost
IRON OXIDE LIMITUnder 0.012 percentMaximum content permitted in ultra-low iron solar glass
PERMIT TIMELINE5 to 12 yearsPeriod from application to extraction consent across member states
CULLET SUBSTITUTION RATEAbout 52%Recycled glass in a typical European container furnace batch
Commercially this is not one market but several dozen overlapping radii. A quarry serves the furnaces it can reach economically and competes with nobody beyond that, which is why concentration looks high nationally and irrelevant locally. Permits rather than reserves are the binding constraint, since Europe has abundant sand and consent to extract it takes five to 12 years where it is granted at all.
The next decade turns on two questions. Whether European solar glass capacity is actually built, because ultra-low iron sand below 0.012 percent iron oxide is available from very few European deposits and those producers hold a genuinely scarce position. And whether flat glass demand returns, since construction has not recovered and float furnaces consume sand at a scale container glass cannot replace.
"People describe silica sand as a commodity, which is true of the mineral and false of the business. You cannot buy cheap sand two countries away, and the producer forty kilometres from a float line has a position no balance sheet can attack."
Director, Industrial Minerals and Glass Raw Materials Practice · MMA Chemicals a

Market Trends

Solar Glass Capacity Needs Sand Europe Barely Has

European photovoltaic manufacturing investment aimed at reducing Chinese dependence requires ultra-low iron glass, and iron oxide below 0.012 percent is available from a small number of European deposits rather than from the general sand base. That turns a handful of quarries into strategically relevant assets and grows the segment at 9.8% against a market at 4.4%. Producers holding those reserves can price accordingly for the first time in decades. Whether the solar glass capacity is actually built on announced timetables remains genuinely uncertain. Announced capacity is not the same as built capacity.
Market Impact: Cullet displaces about 52% already
Permitting Has Become The Binding Supply Constraint

Europe has abundant silica sand and consent to extract it takes five to 12 years where it is granted at all, with water table protection, habitat designation, and local opposition each capable of stopping an application outright. The root of the problem is that the deposits closest to glass furnaces are also closest to the populations objecting. Commercially this means reserves on a balance sheet mean little without permits attached. Producers with consented reserves near active furnaces hold something competitors cannot buy. Local opposition and habitat designation both stop applications outright.
Market Impact: Freight is 54% of delivered cost

Market Opportunities and Growth Drivers

Container Glass Volume Ignores The Construction Cycle

Food, beverage, and pharmaceutical packaging consumption continues regardless of what construction does, which makes container glass the steady half of European sand demand and the reason the market grew at all through the energy crisis. Glass has also held share against plastic in wine, spirits, and premium food where the material carries a positioning argument. Lightweighting reduces sand per container modestly while unit volumes rise. This is the demand that does not disappear when furnaces elsewhere in the portfolio go cold. Packaging consumption does not track the construction cycle at all.
Market Impact: Gas reached 5 times prior levels

Freight Economics Protect Every Incumbent Position

Transport is roughly 54% of delivered sand cost and the economic haulage radius runs 150 to 300 kilometres, beyond which no producer can compete regardless of extraction cost or quarry efficiency. That converts a low-value mineral into dozens of protected local positions rather than one competitive market. A furnace has realistically two or three viable suppliers rather than twenty. Nobody enters a radius without either a consented deposit inside it or a cost advantage large enough to survive the freight. Nobody competes into a radius that they simply cannot reach profitably.
Market Impact: Cullet already supplies 52% of batc

Market Restraints and Challenges

European Furnace Economics Undermine The Whole Demand Base

Glass melting is energy intensive and European gas costs since 2022 have left some furnaces uncompetitive against imported glass, particularly in flat and container products where transport of the finished article is feasible. The root cause is an energy cost gap that sand producers do not influence and cannot offset. Commercially this puts demand at risk regardless of any mineral consideration. Producers mitigate by concentrating on furnaces with durable cost advantages, supporting customer decarbonisation projects, and diversifying into technical glass grades where cost matters less. Sand producers absorb a problem they did not create.
Market Impact: Iron must stay below 0.012 percent

Rising Cullet Rates Displace Primary Sand Demand

Recycled glass already supplies roughly 52% of a typical European container furnace batch and collection improvements keep pushing that higher, and every additional point of cullet removes primary sand from the mix. The root cause is that recycling policy and furnace energy economics both favour cullet, since melting recycled glass consumes less energy than melting raw batch. Commercially this caps volume growth in the largest segment. Producers mitigate by focusing on flat, solar, and technical grades where colour and purity requirements limit how much cullet can be used. Policy and furnace economics both favour it.
Market Impact: Permits take 5 to 12 years
4 additional market trends, 3 additional growth drivers, and 2 additional restraints and challenges are covered in the full report. Contact sales@marketmindsadvisory.com to access the complete intelligence.

Segment CAGR and Growth Architecture

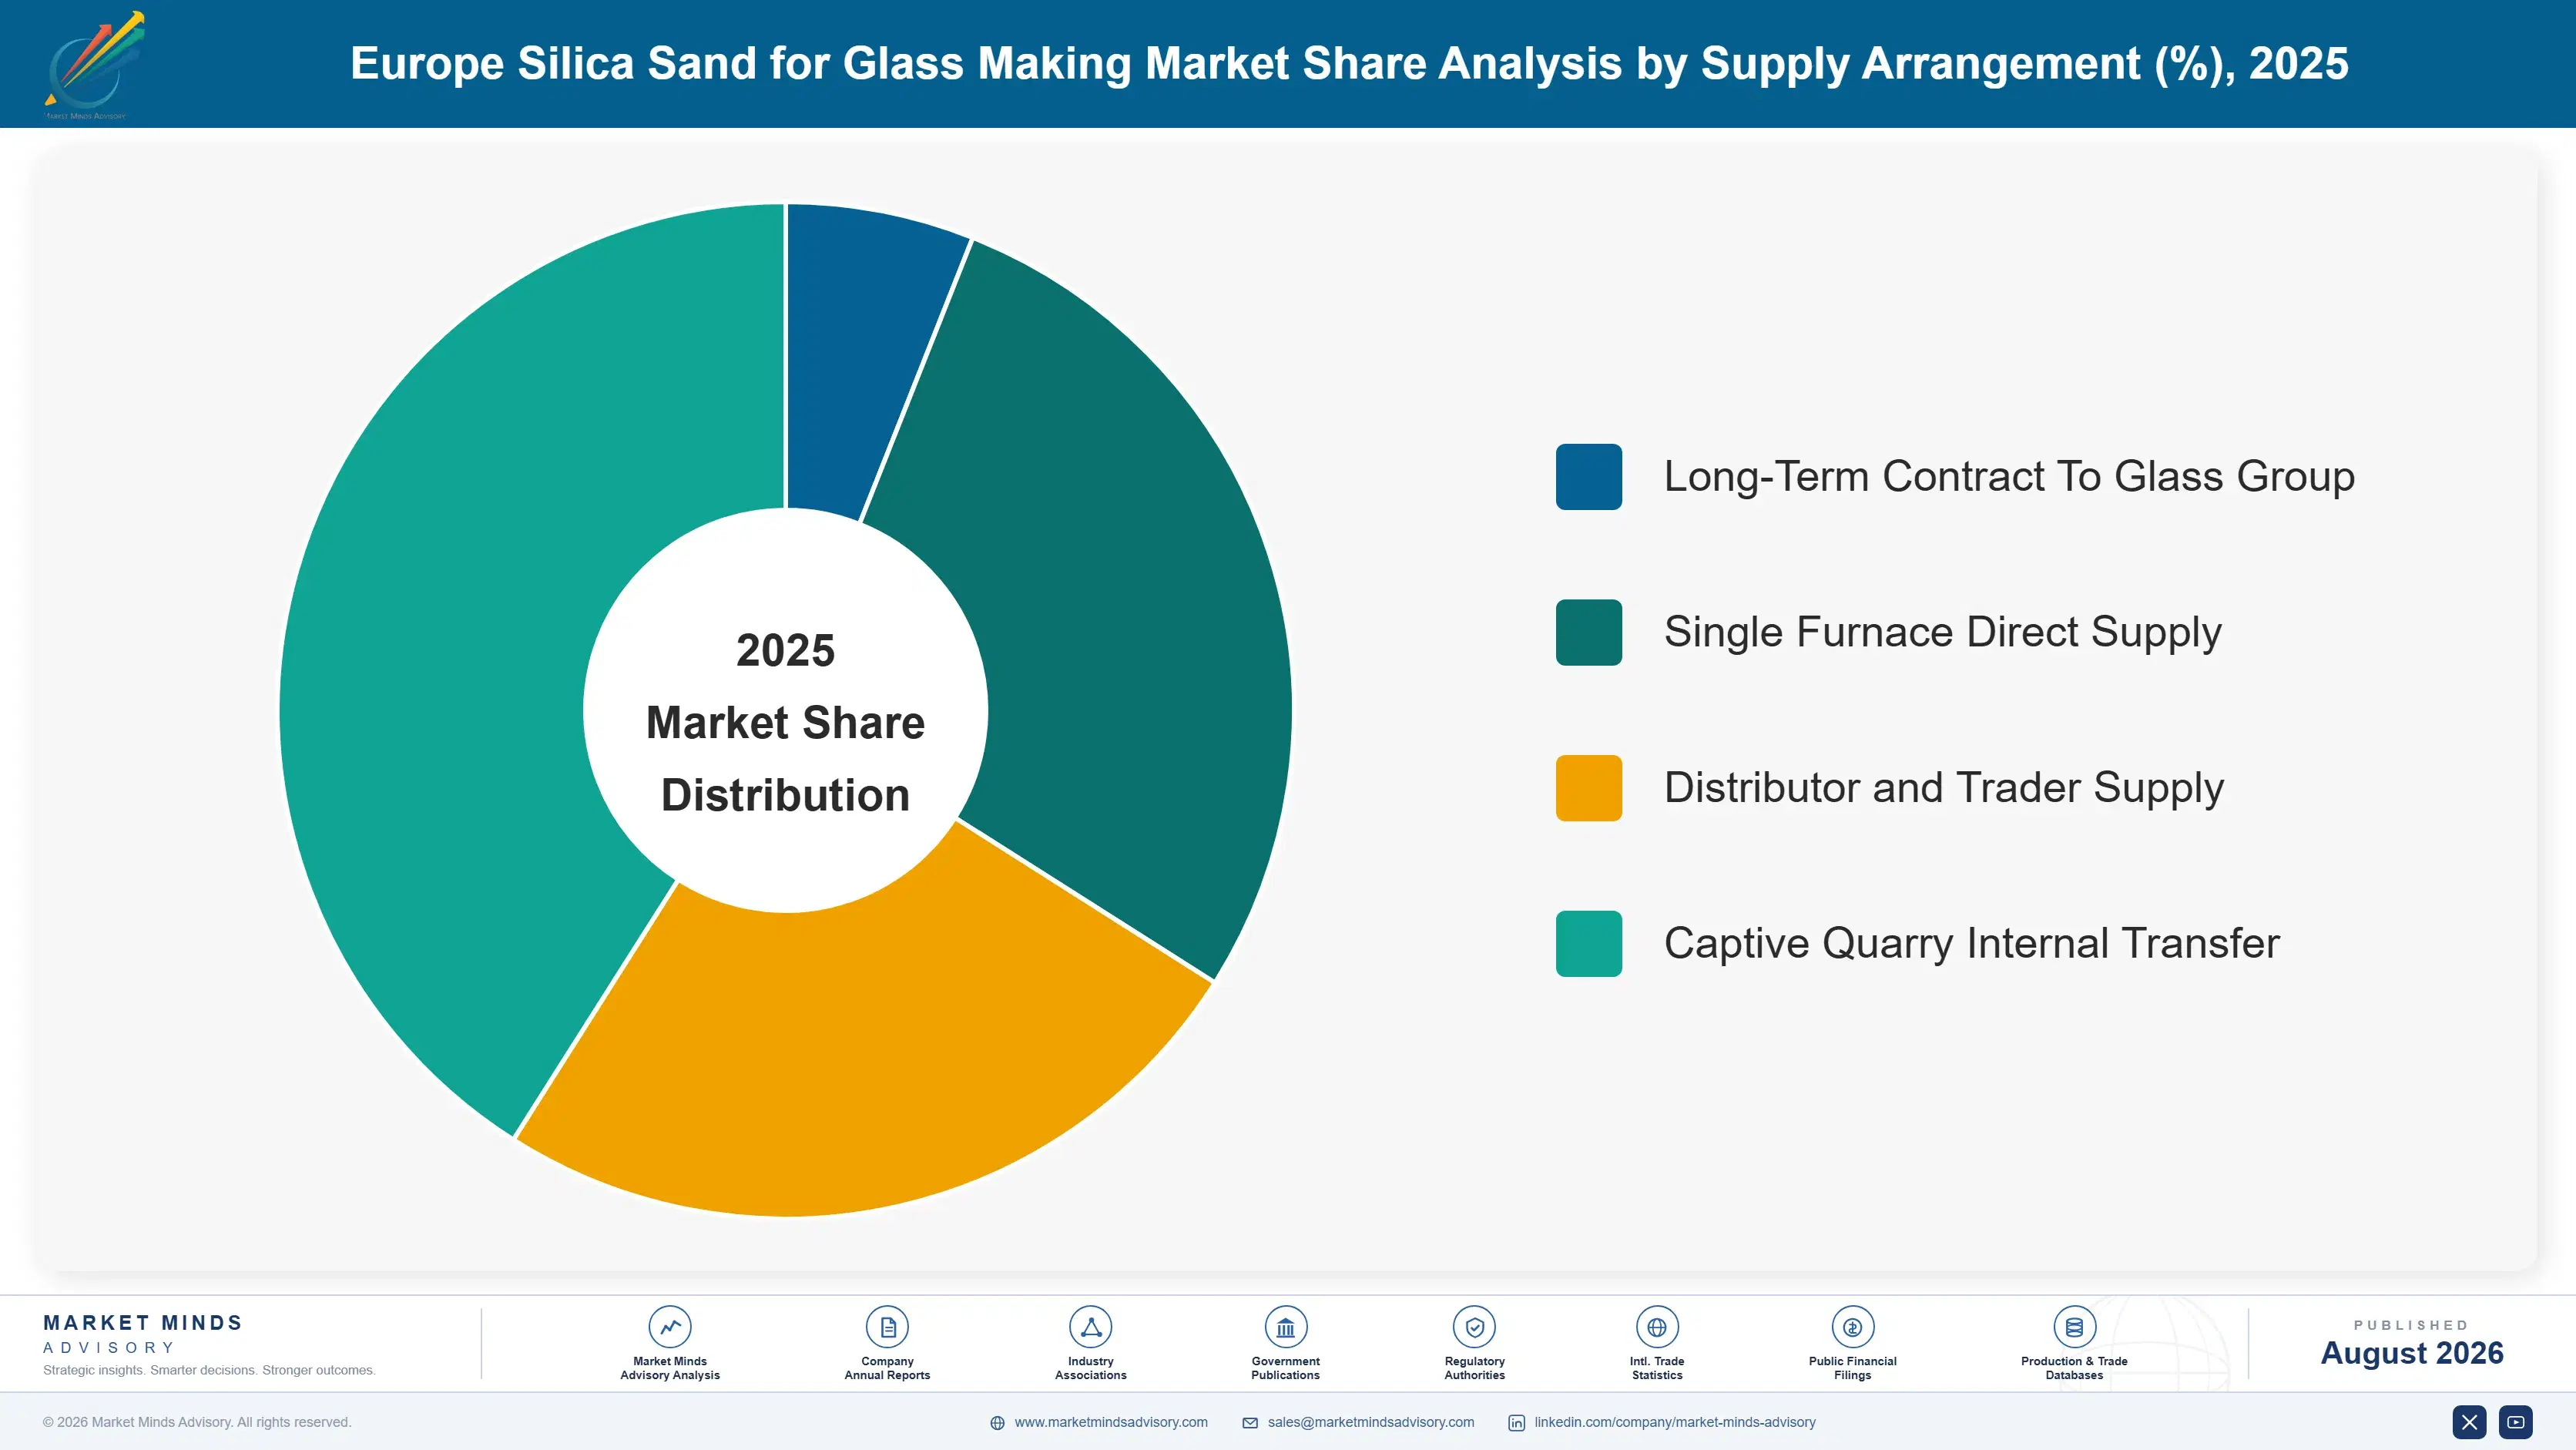
Segmentation follows glass end product, a single classification describing the type of glass the sand is processed and specified for. Each product carries its own purity requirement, particle specification, and price position, so economics track the glass being made rather than the quarry supplying it. Customer type and supply arrangement appear separately within the framework as their own distinct dimensions.
europe-silica-sand-for-glass-making-market-market-share-analysis-1787332519856

Ultra-Low Iron Solar Glass Sand

Ultra-low iron solar glass sand grows fastest at 9.8%, about 2.23 times the overall 4.4% rate, and European photovoltaic manufacturing investment rather than any mineral development explains it. Iron oxide below 0.012 percent is what makes glass transmissive enough for solar use, and only a small number of European deposits reach that without processing costs that destroy the economics. Producers holding those reserves have genuine scarcity value for the first time in decades. The whole segment depends on European solar glass capacity actually being built rather than announced, which remains an open question with real timing risk attached. Holding the reserve costs little and being the only qualified supplier is worth a great deal.
CAGR 9.8%

Fibreglass and Technical Glass Sand

Fibreglass and technical glass sand grow at 6.2%, the second-fastest end product, on wind blade manufacture, building insulation, and composite reinforcement demand that construction weakness has not fully suppressed. Purity and particle size distribution requirements sit above container glass and below solar, which widens the qualified deposit list without opening it to everybody. Cullet substitution is minimal here because the glass chemistry and fibre process both require consistent raw batch. That protects primary sand demand in a way container glass no longer offers, which makes the segment worth more than its volume alone suggests. Wind blade and building insulation demand both continue regardless of what commercial construction happens to do.
CAGR 6.2%
Full segment breakdown across 5 segments available in the complete report.

Regional Architecture and Country Demand Map

This report is scoped to Europe, so the regional split reflects where European glass sand is extracted and consumed rather than any global distribution. Western Europe holds the furnace base and the deposits, while Eastern Europe grows quickest on container and solar glass investment. Consent decides supply.

North America

North America holds 3% of value, which sits far below the Part 2.3 band because this report is scoped to Europe and the share reflects only specialist high-purity sand imported into European furnaces from North American deposits where no European equivalent exists. Those volumes are small, expensive, and confined to optical and technical glass where purity requirements exceed anything European reserves reliably deliver. Freight economics make routine transatlantic supply impossible for ordinary glass sand. Growth of 3.6% tracks specialty glass demand rather than any broader trade development between the two regions. Nothing about that share reflects a commercial relationship that European producers or their customers need to manage actively at all.
Share: 3% | CAGR: 3.6% (2026 to 2036)

Western Europe

Western Europe holds 66% of value, far above the Part 2.3 band because this report is scoped to Europe and the region contains most of the continent's glass furnaces and consented sand deposits together. German, French, Belgian, and Dutch container and float capacity anchors demand, with Sibelco and Quarzwerke holding positions built on reserves near those furnaces. Energy costs since 2022 have made some furnaces uncompetitive and closures have removed sand demand permanently in a few catchments. Permitting is slowest here and public opposition strongest. Growth of 4.0% reflects container resilience against flat glass weakness. Consented ground near an active furnace is the scarcest asset anybody in this business holds.
Share: 66% | CAGR: 3.2% (2026 to 2036)
Regional intelligence for 5 additional markets available in the complete report: East Asia, South Asia and Pacific, Latin America, Middle East and Africa, Eastern Europe. Contact sales@marketmindsadvisory.com.
europe-silica-sand-for-glass-making-market-country-cagr-analysis-1787332520370

Where Glass Sand Producers Hold Ground

A mineral worth almost nothing per tonne with freight at over half of delivered cost is not a pricing business. The four moves below reach what actually decides returns: consented reserves inside a furnace radius, low-iron reserve position, processing that upgrades ordinary deposits, and contract structures that survive a furnace closure. None of them is a pricing move.

Secure Consented Reserves Inside An Active Furnace Radius

Freight is roughly 54% of delivered cost and the economic haulage radius runs 150 to 300 kilometres, so a consented deposit inside that circle is a position competitors cannot attack with capital or with efficiency. Permits take 5 to 12 years where they are granted, which means reserves without consent are an accounting entry rather than a commercial asset. Acquiring consented ground near active furnaces beats developing greenfield deposits almost every time, and there is very little of it available. Greenfield development effectively starts a full decade behind any consented acquisition.
Market Impact: The haulage radius runs 300 kilomet

Hold Low-Iron Reserves Before Solar Capacity Commits

Ultra-low iron sand below 0.012 percent iron oxide is available from a small number of European deposits and required by every solar glass line, which makes those reserves scarce in a way ordinary glass sand never is. The segment grows at 9.8% against a market at 4.4% and pricing reflects genuine scarcity rather than a cost-plus calculation. European photovoltaic glass investment may or may not arrive on announced timetables. Holding the reserve costs little and being the only qualified supplier when it does arrive is worth a great deal. Timing risk is the only real question.
Market Impact: Iron oxide must stay below 0.012 pe

Upgrade Ordinary Deposits Through Processing Investment

Attrition scrubbing, magnetic separation, and flotation can move a middling deposit into flat and technical glass specification, which changes what a quarry can sell rather than how much it produces. That matters enormously when the alternative is competing for container glass volume against every other quarry inside the same radius. Processing capital is substantial and the plant is fixed to the deposit permanently. It also converts a low-value position into one serving customers who cannot easily switch away. Container sand competes against every other quarry sitting within 300 kilometres of it.
Market Impact: Processing can lift grade past 3 se

Write Contracts That Survive A Furnace Going Cold

European glass furnaces have closed on energy economics that no sand producer influences, and a quarry built around one customer discovers the entire radius argument working against it when that customer stops melting. Multi-furnace contracts, take-or-pay structures, and deliberate customer spread across container, flat, and technical glass all reduce that exposure. Producers who optimised logistics around a single large furnace made a rational decision that has become an expensive one in several European catchments already. A quarry serving just 1 furnace has no second customer anywhere inside its radius at all.
Market Impact: One closure can remove 100% of a ra

Who Controls the Margin Pool

Concentration is severe on paper: the top five hold roughly 64% of European glass sand revenue, though that figure overstates competition because each quarry serves a haulage radius rather than a continent. The gap between leaders and challengers is consented reserve position near active furnaces rather than extraction capability, which is straightforward. All participants here are assessed on one basis, revenue from processed silica sand supplied to European glass manufacturers, excluding found
Competition runs along four lines. First, consented reserves inside a furnace radius, since freight forbids competing from outside it. Second, iron content, which decides whether a deposit can serve solar and technical glass or only containers. Third, processing capability that upgrades an ordinary deposit into a better specification. Fourth, contract structure, because a single furnace closure removes an entire local position.

Pressure is building from two directions. European furnace closures on energy economics remove sand demand permanently in affected catchments, and no producer can influence that. Meanwhile rising cullet rates displace primary sand in the largest segment year after year. Rankings should favour producers with low-iron reserves and diversified furnace exposure over those optimised around a single large container or float customer.
europe-silica-sand-for-glass-making-market-company-positioning-matrix-1787332520884

Competitive Moat and Risk Dimensions

SIBELCO

Moat: Reserve breadth across European catchments

Sibelco holds consented silica reserves across a wide spread of European catchments, which converts what is locally a radius business into something approaching genuine coverage. That spread means a furnace closure in one area does not remove a disproportionate share of its volume. Processing capability across multiple grades lets individual sites serve container, flat, and technical specifications rather than one.
SIBELCO

Risk: Permitting exposure and furnace closures

Reserve breadth does not protect against a permitting refusal at a specific site where the alternative supply lies outside haulage distance for those customers. European furnace closures on energy economics have removed demand permanently in several catchments and will remove more. Cullet substitution also erodes the container glass volume that underpins the widest part of the reserve base.
QUARZWERKE GROUP

Moat: High-purity grades and processing depth

Quarzwerke holds deposits and processing capability aimed at higher purity grades, which reaches solar, technical, and optical glass customers that ordinary container sand producers simply cannot serve. Processing depth also upgrades middling material into specifications that command real pricing. German industrial customer relationships are long-standing and built around consistency rather than delivered price alone.
QUARZWERKE GROUP

Risk: German cost base exposure

German energy and labour costs sit above eastern European alternatives on a product where freight already dominates delivered price. Demand concentrates in German and neighbouring furnaces where flat glass weakness has been most pronounced and closures most visible. Solar glass demand depends on European photovoltaic capacity being built rather than announced, which remains genuinely uncertain.

Players Tracked

Prominent Players

Sibelco
Quarzwerke Group
Strobel Quarzsand
Kremer Group
Sablieres de Nemours

Other Key Players

Sibelco Nordic
Euroquarz
Schlingmeier Quarzsand
Amberger Kaolinwerke
Provencale SA
Fulchiron
Minerali Industriali
Cemex Silica
Kaltun Madencilik
Sitindustrie
LB Minerals
Kopalnia Piasku Szklarskiego Osiecznica
Sklopisek Strelec
Holcim Aggregates
Aurubis Mineral

Recent Developments

MARCH 2025

European solar glass investment raises low-iron sand qualification activity

Announced European photovoltaic glass projects prompted qualification work on ultra-low iron sand deposits capable of meeting transmission requirements, of which very few exist across the continent. These were qualification and supply discussions rather than transactions, and they established which producers hold genuinely scarce reserves rather than ordinary glass sand.
Signal: Very few European deposits qualify at all,
SEPTEMBER 2024

Further European glass furnace closures remove regional sand demand

Additional container and flat glass furnaces closed across Western Europe on energy economics, removing sand demand permanently in catchments where no alternative customer sits inside haulage distance. These were customer capacity decisions rather than corporate events, and the affected quarries have no realistic route to replace that volume.
Signal: A closure inside the radius removes demand
MAY 2024

Extraction permitting refusals continue across several member states

Silica sand extraction applications were refused or delayed across several European member states on water table, habitat, and local opposition grounds, extending consent timelines that already ran to many years. These were planning decisions rather than commercial events, and they confirmed permits rather than reserves as the binding supply constraint.
Signal: Reserves without consent are an accounting

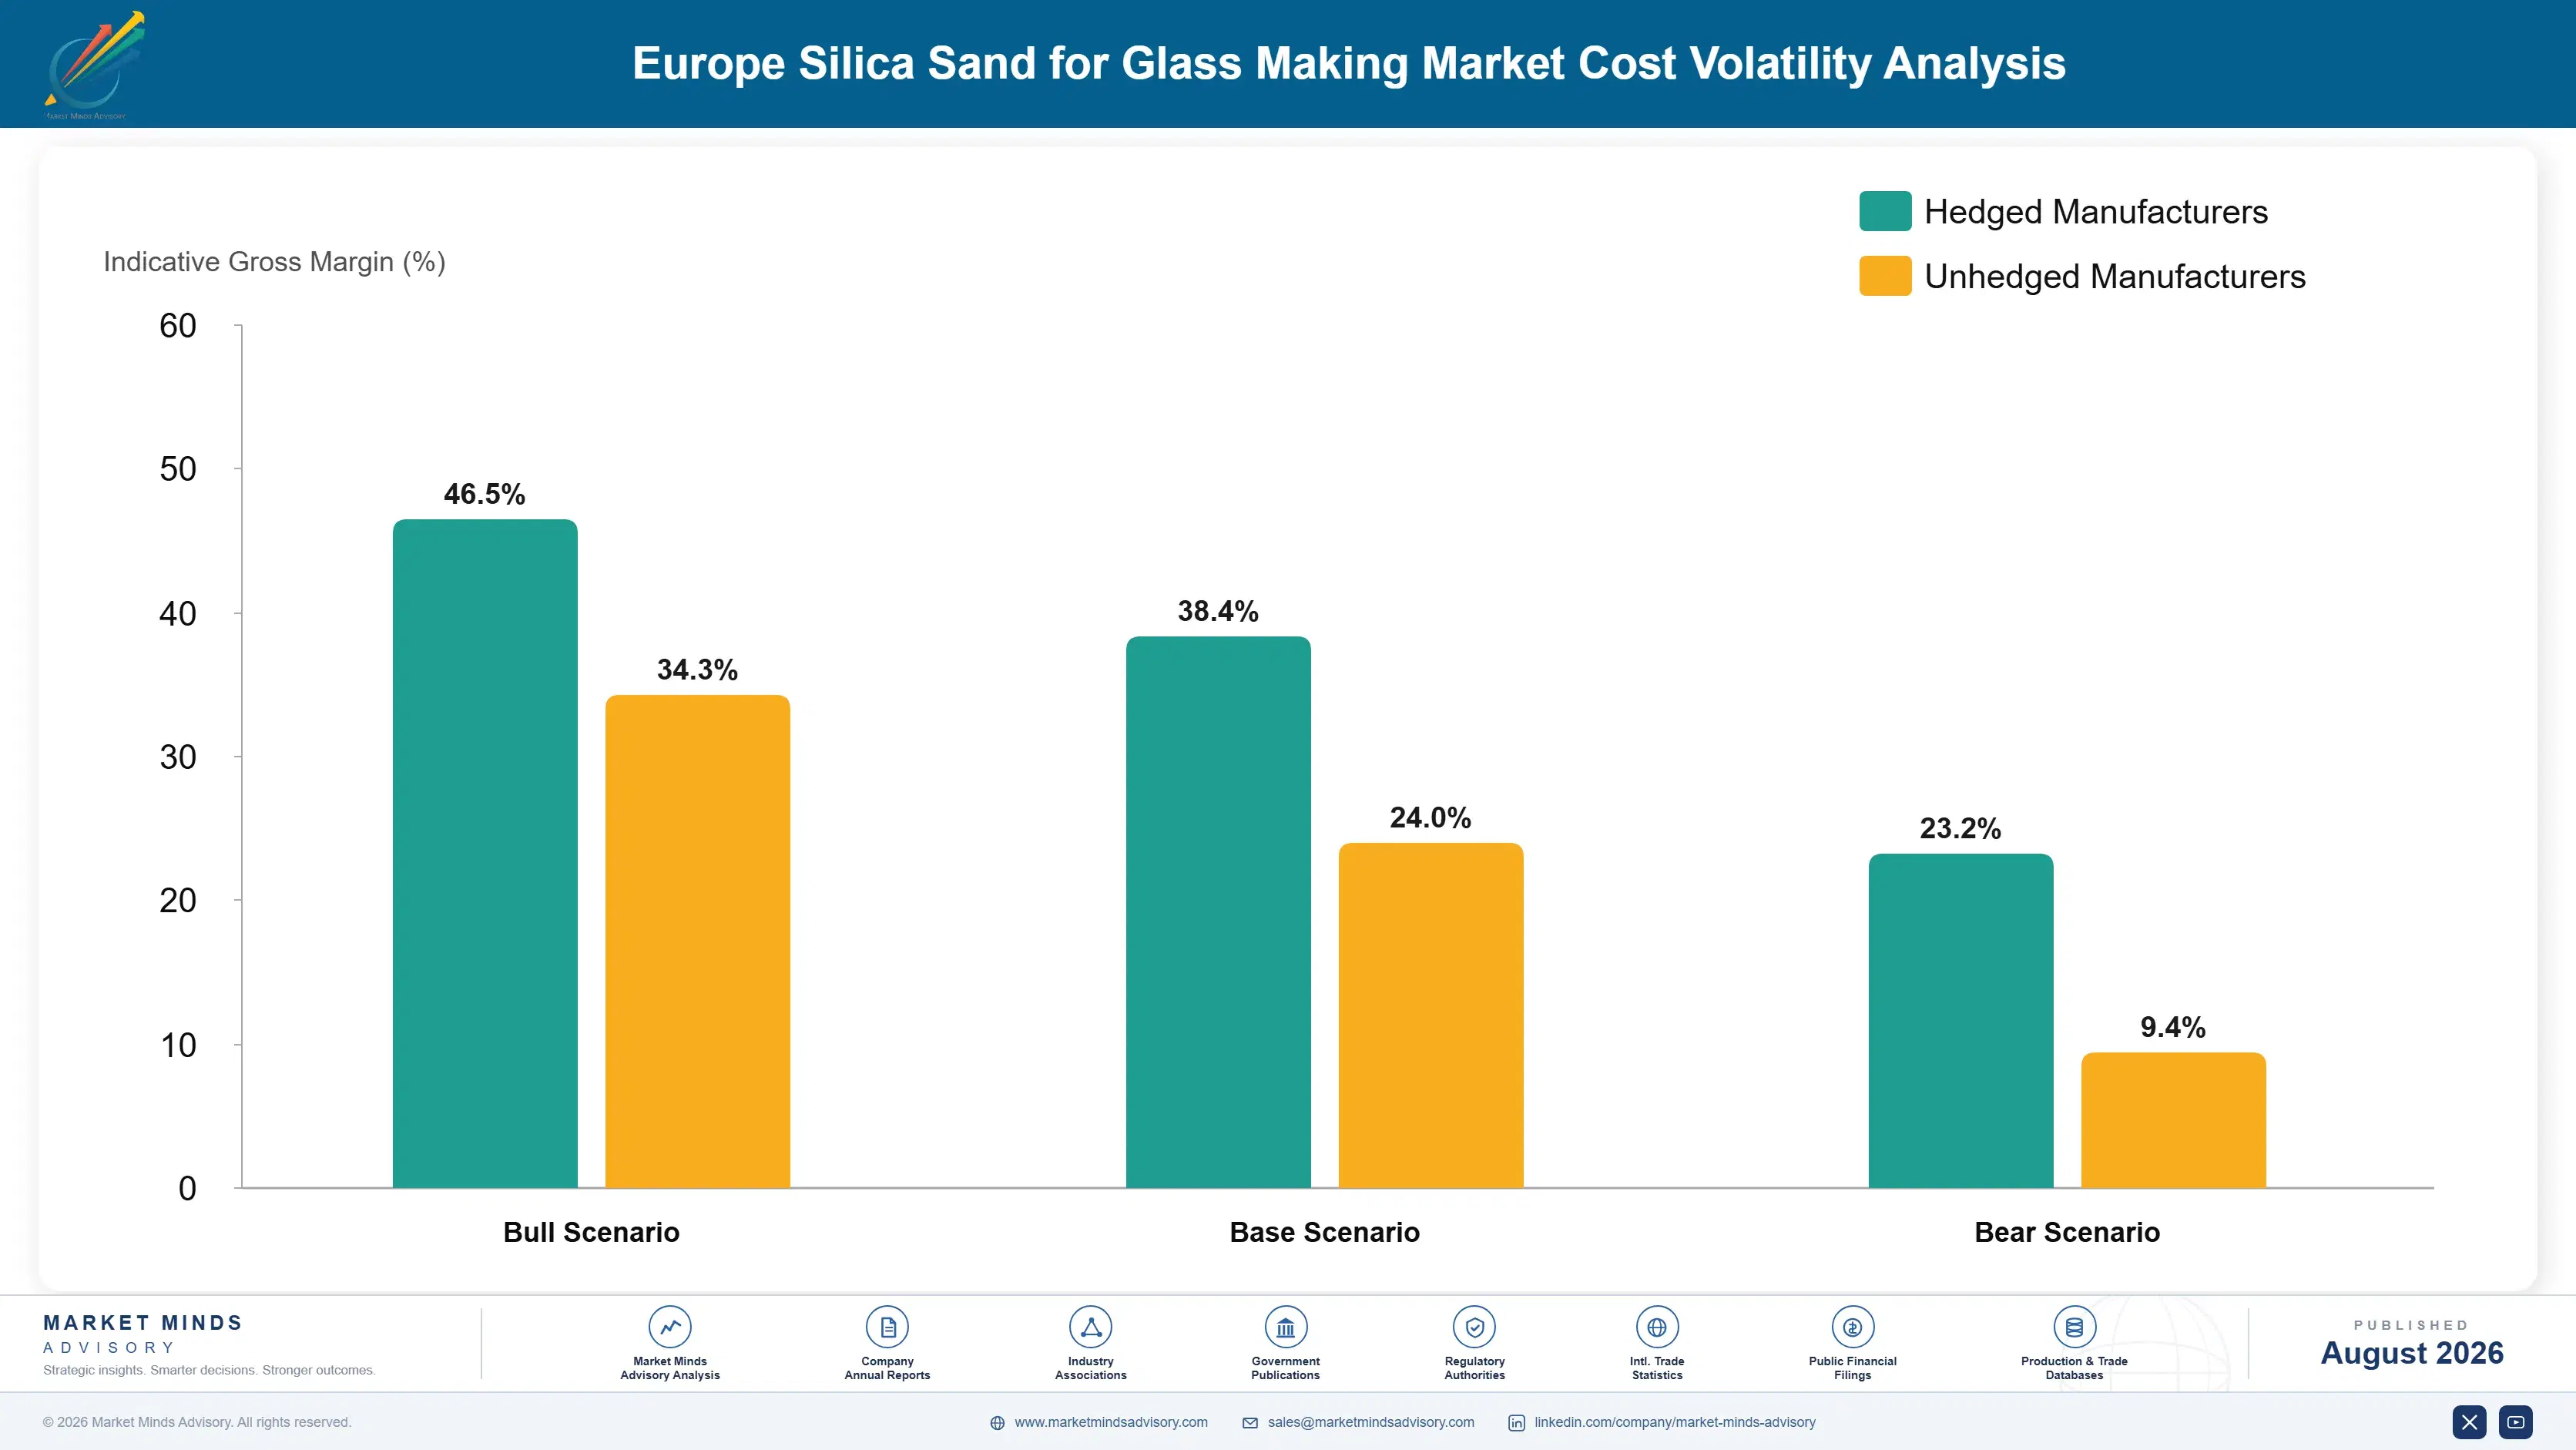
Diesel Haulage, Drying Energy, Extraction, Royalties

Transport dominates this cost sheet in a way that surprises anybody who assumes a mineral business is about mining. Road and rail haulage runs roughly 54% of delivered cost. Drying and thermal processing add 12% to 18% because wet sand cannot be shipped or batched. Extraction, washing, and classification contribute 14% to 20%, and royalties, restoration provisions, and permitting compliance a further 6% to 12%.
Diesel and energy costs both rose steeply through 2022, and because freight is more than half of delivered cost the effect reached customers immediately rather than gradually. Sibelco disclosed energy and logistics cost pressure across that reporting period, and IEA analysis recorded European industrial gas at several times prior-year levels, which hit thermal drying directly. Glass customers facing their own energy crisis resisted pass-through firmly.

Exposure separates by haulage mode and drying dependence rather than by quarry size. A producer with rail loading or water access moves sand at a fraction of road cost and reaches customers a road-only competitor cannot serve profitably. Drying dependence matters similarly, since a deposit requiring heavy thermal drying carries gas exposure that a naturally drier one avoids entirely. Neither can be changed once the site is developed.
europe-silica-sand-for-glass-making-market-cost-volatility-analysis-1787332521080

Invest in rail loading and water access where geography allows

Road haulage is over half of delivered cost and rail or barge moves identical tonnage for a fraction, which extends the economic radius rather than reducing expense. That converts a local position into a regional one and reaches furnaces road-only competitors cannot quote. The capital is substantial and the option exists only where geography and infrastructure permit it.

Reduce thermal drying load through mechanical dewatering

Drying is 12% to 18% of cost and runs on gas that European producers buy at a genuine disadvantage. Mechanical dewatering, improved classification, and covered stockpiling all reduce the moisture reaching the dryer, which cuts fuel directly. The equipment is unglamorous and the payback is steady rather than dramatic, which is why several producers deferred it through cheaper energy years.

Bank consented reserves well before they are needed

Consent takes five to 12 years where it is granted at all, so a producer beginning the process when reserves run short has already lost. Applying early, holding consented ground unworked, and acquiring permitted deposits are the only three routes to a usable reserve position. Carrying cost on unworked consented ground is small against holding it when a competitor cannot.

Portfolio Architecture for Margin Defence

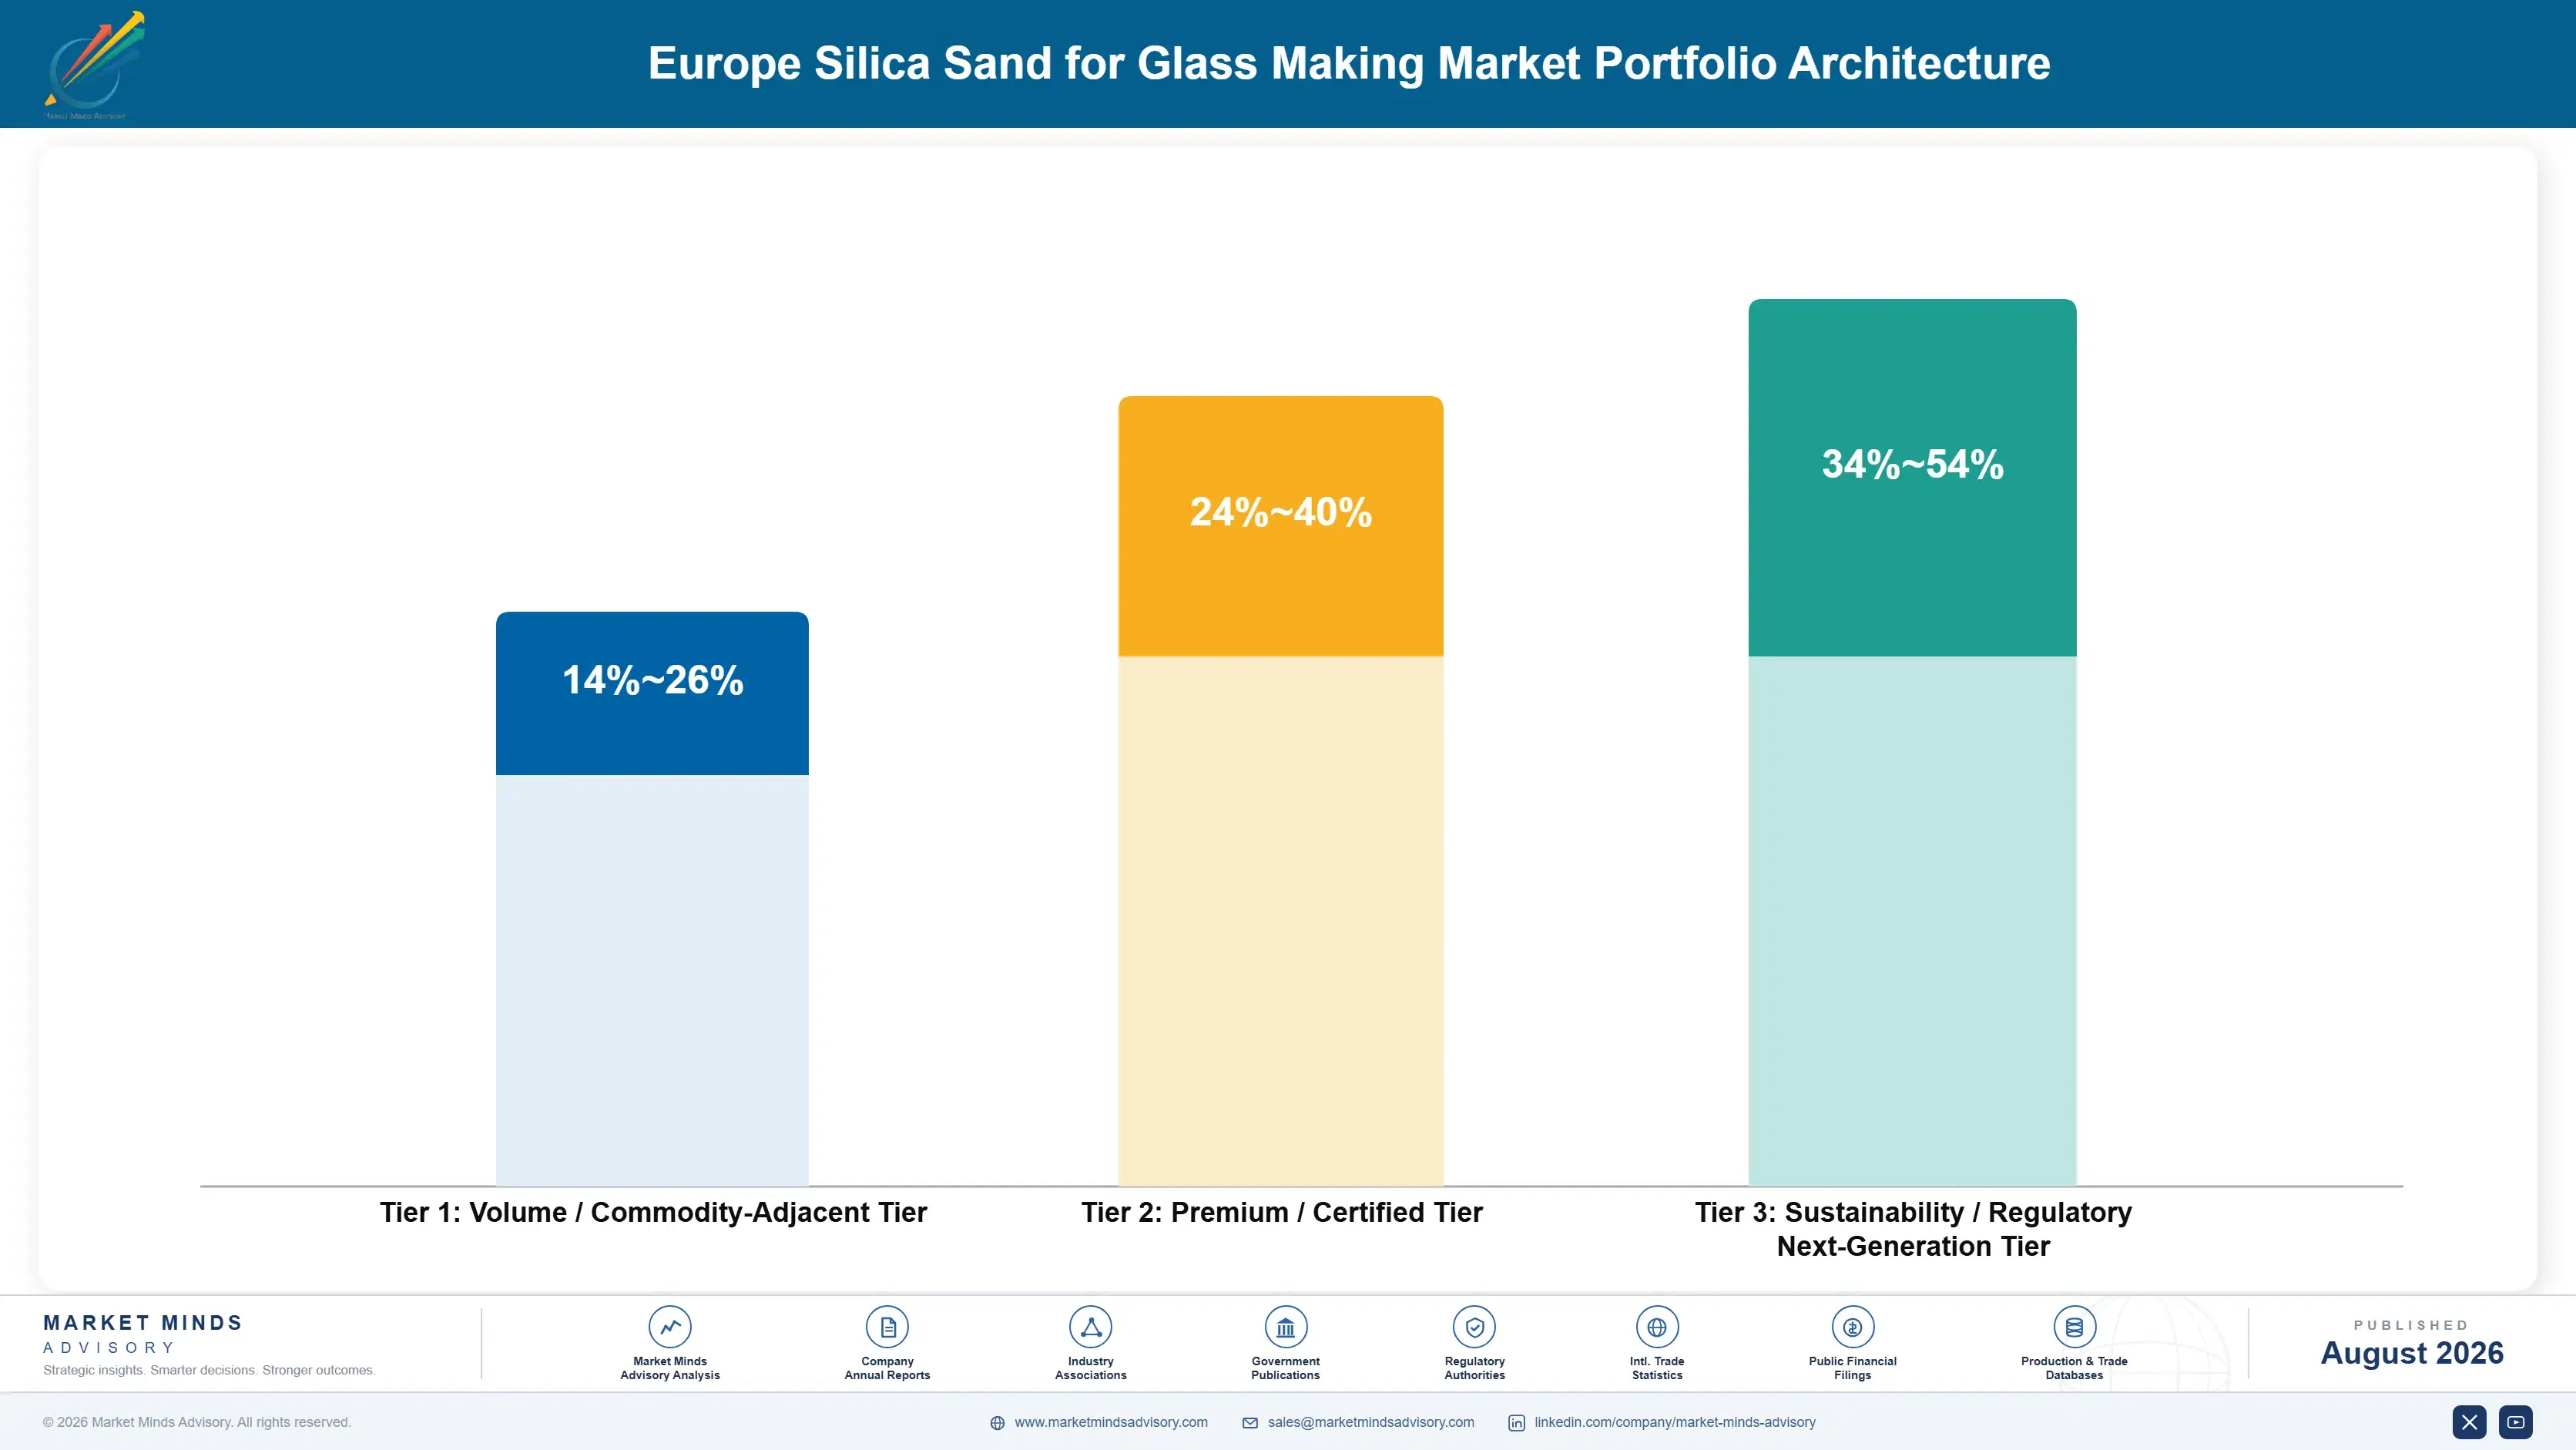
The portfolio splits into three tiers with different economics. Container glass sand forms the volume tier, where the specification is undemanding, every quarry inside the radius can meet it, and delivered price decides awards. Flat and fibreglass grades earn more because purity and consistency requirements narrow the qualified list considerably. Ultra-low iron solar and optical sand price against genuine reserve scarcity rather than a competing quotation.
The tension runs between container volume filling the plant and higher grades earning the return. Container sand keeps washing and classification loaded, covers fixed cost on a plant tied permanently to one deposit, and holds the relationships through which better grades sell. Yet it faces rising cullet substitution and competes on price with everybody inside the radius. Producers handling this well run container volume while investing in higher-specification processing.

High-value pools concentrate where reserve chemistry or processing limits competition: ultra-low iron sand for solar glass, high-purity grades for optical and technical use, fibreglass sand where cullet cannot substitute, and any deposit with rail or water access. All four escape the delivered price comparison. Container sand sits at the other end, where cullet takes a growing share of the batch and the furnace negotiates annually.

Volume / Commodity-Adjacent Tier

Container glass sand supplied on delivered price to furnaces inside the haulage radius. The range is wide because transport mode and drying energy dependence separate producers enormously at identical quarry gate costs.
Gross Margin: 14-26%

Premium / Certified Tier

Flat and float glass sand and fibreglass grades carrying tighter purity and particle size consistency requirements. The range is wide because processing investment varies and cullet substitution pressure differs sharply between these applications.
Gross Margin: 24-40%

Sustainability / Regulatory / Next-Generation Tier

Ultra-low iron solar glass sand, optical and technical high-purity grades, and deposits with rail or water logistics. The range is wide because reserve scarcity supports pricing while solar demand timing remains genuinely uncertain.
Gross Margin: 34-54%
europe-silica-sand-for-glass-making-market-portfolio-architecture-1787332521571

High-value Sub-segments and Strategic Watch-out

Ultra-Low Iron Solar Glass Sand

High value and high growth at 9.8%, the fastest end product, because iron oxide below 0.012 percent is available from very few European deposits. The whole segment depends on European solar glass capacity being built rather than merely announced, which carries real timing risk. Very few deposits qualify.
Gross Margin: 34-54%

Fibreglass and Technical Glass Sand

High value with strong growth at 6.2% on wind blade, insulation, and composite demand. Cullet substitution is minimal because the glass chemistry and fibre process both require consistent raw batch, which protects primary sand demand in a way container glass no longer does. Consistency requirements protect it.
Gross Margin: 28-44%

Container Glass Sand

The volume core by a wide margin, growing at 3.4% with food and beverage packaging and squeezed by cullet rates already near 52% of batch. Volume is dependable and every additional point of recycled glass removes primary sand permanently from the mix. Every point of cullet removes sand.
Gross Margin: 14-26%

Flat and Float Glass Sand

The strategic watch-out, growing at 3.0% and tied to a European construction market that has not recovered. Float furnaces consume sand at enormous scale, which makes each closure a disproportionate loss to whichever quarry served that particular catchment. Construction recovery is the only real lever available here.
Gross Margin: 20-34%

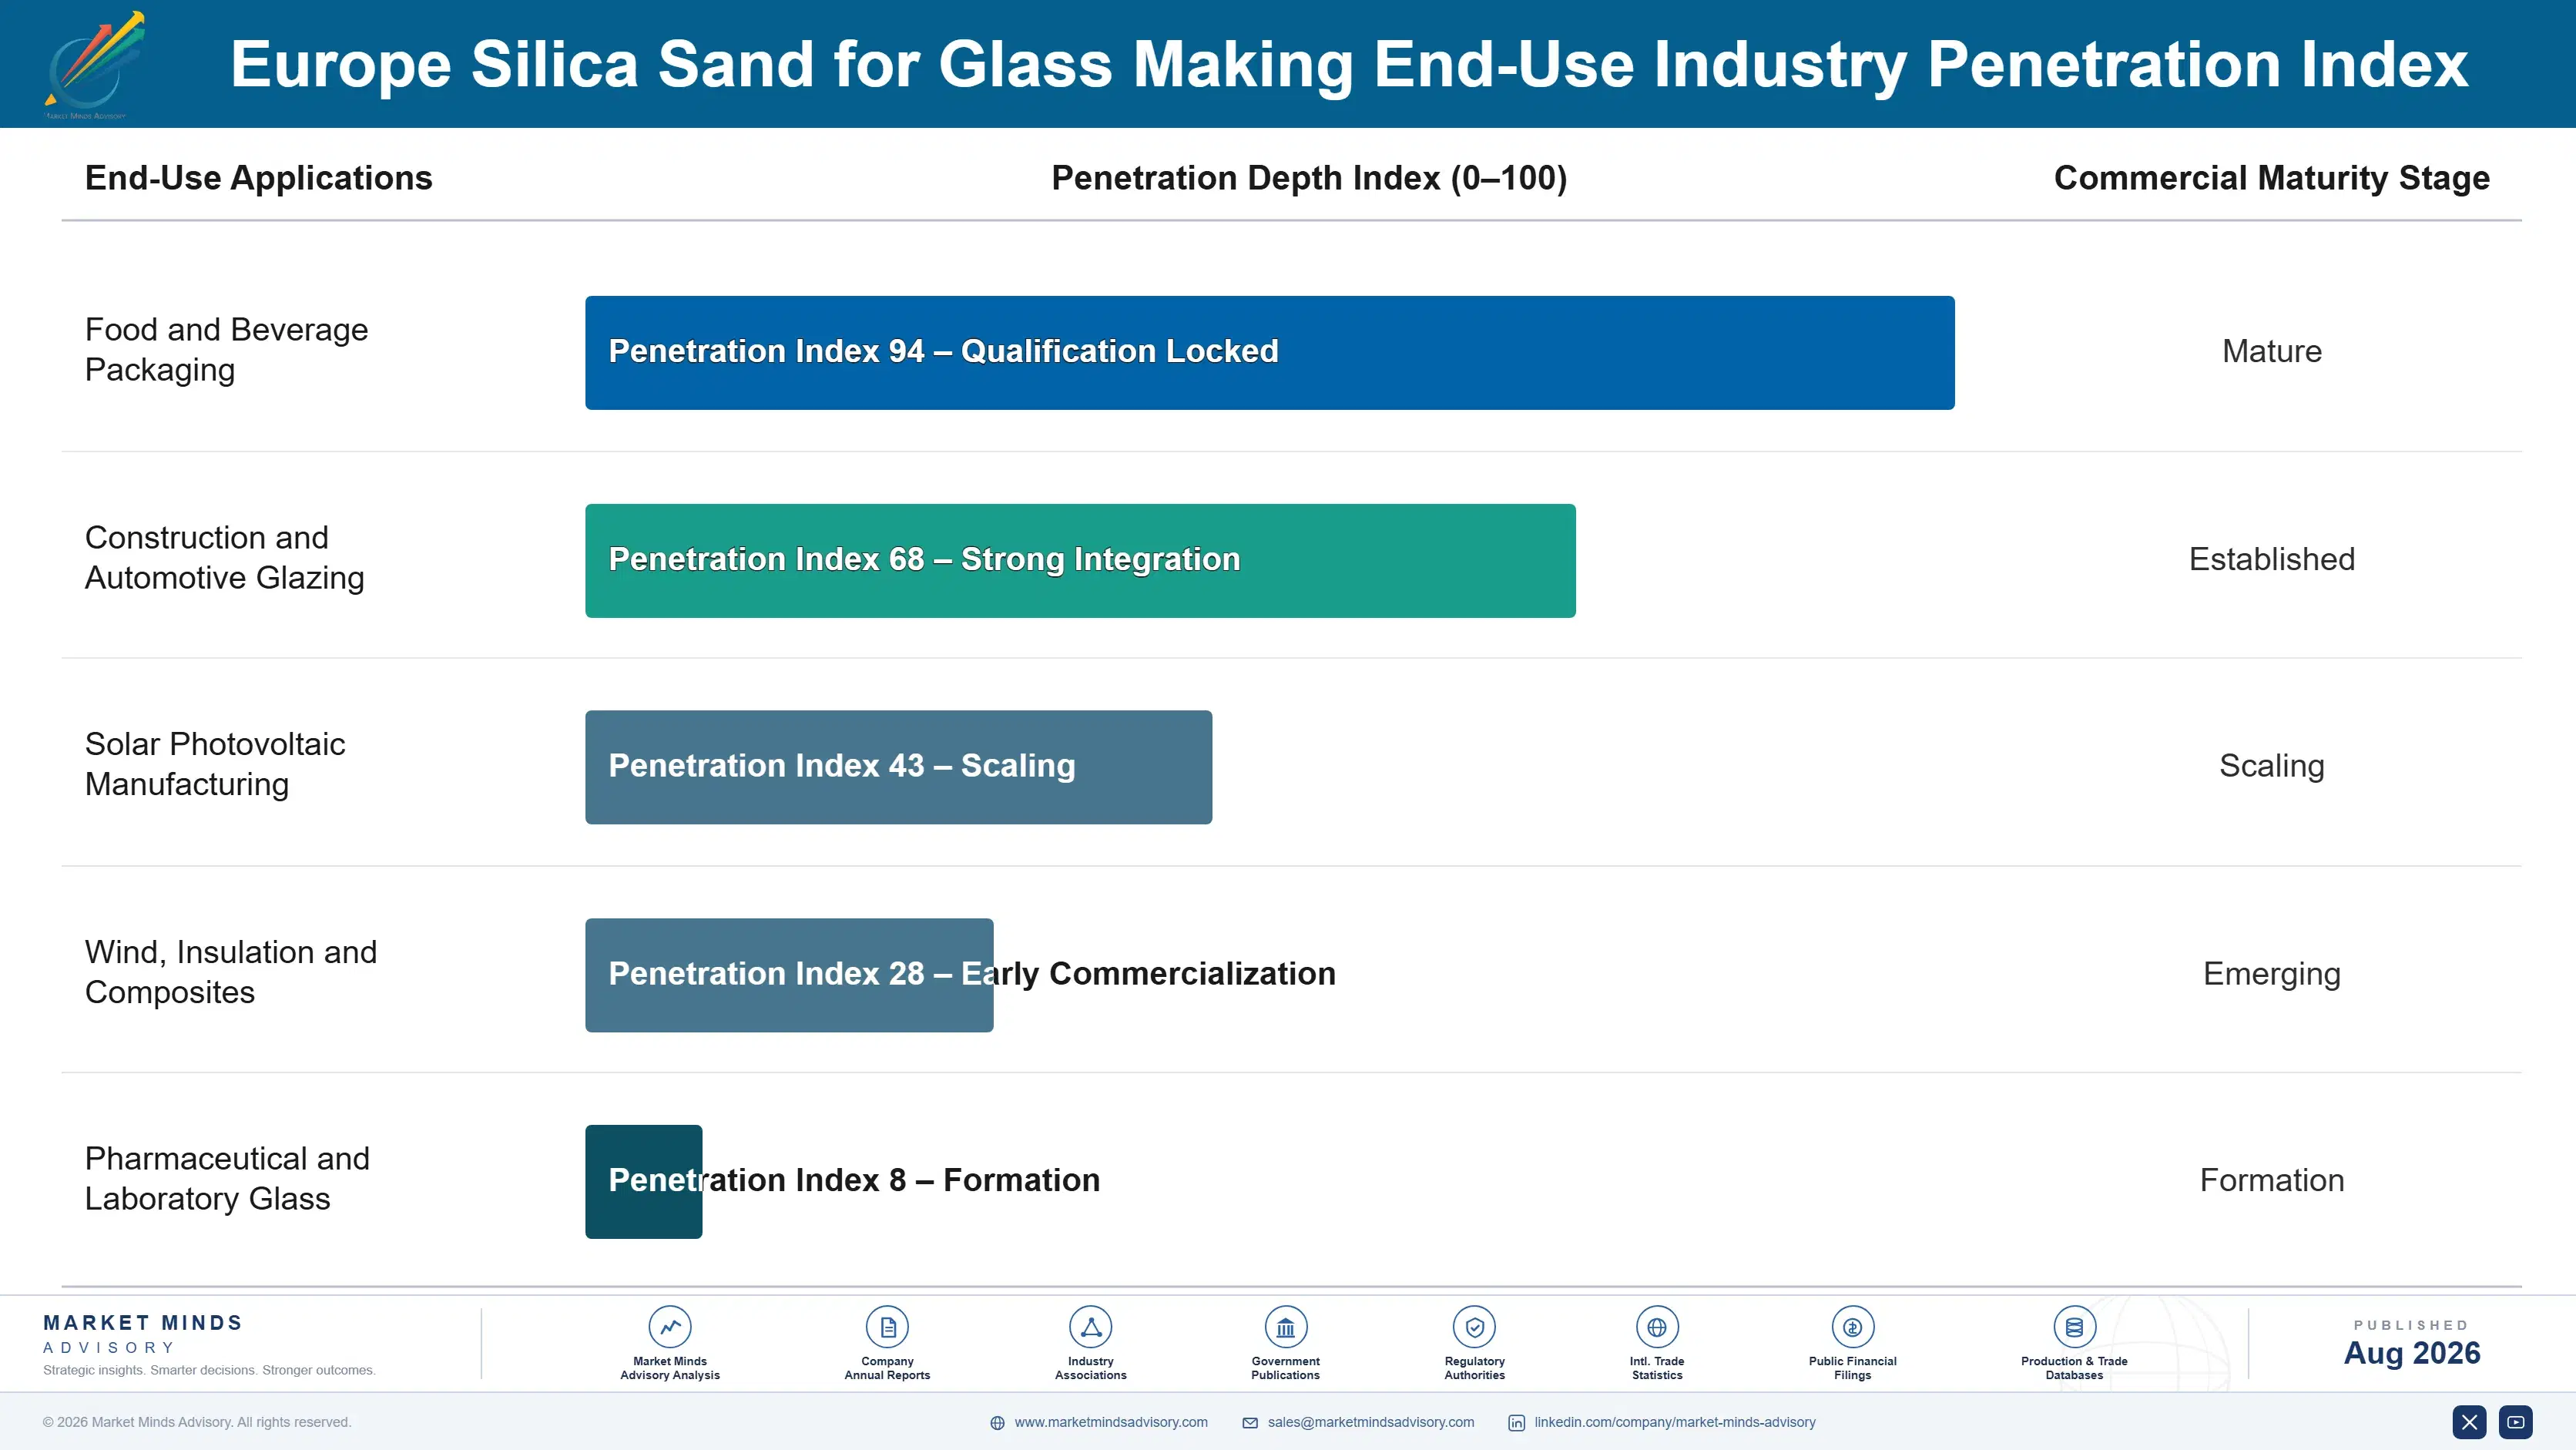
How Sand Supply Positions Actually Hold

Demand commits at furnace qualification and repeats as deliveries for as long as the furnace runs. A sand approved into a batch has passed chemical analysis, particle size verification, and often a melting trial, and a furnace does not change supply casually because batch consistency affects glass quality. That protects incumbents strongly. The genuine competitive moments are a furnace rebuild, a new line, and any permitting event removing a competitor.
Stickiness varies by specification tightness and alternative availability. Solar and optical grades stick hardest, since qualified alternatives inside haulage distance often do not exist. Fibreglass and technical grades stick through consistency a new supplier must prove over months. Flat glass sticks through batch chemistry. Container sand sticks least, moving on price at annual negotiation because several quarries inside the radius meet the same specification.

Buyer profiles have moved from furnace purchasing comparing delivered price toward batch chemists, sustainability functions, and corporate procurement running multi-plant contracts. Decarbonisation programmes made raw material consistency part of an energy conversation rather than a quality one. That change rewards producers bringing chemistry data, logistics reliability, and consented reserve depth, and penalises those still quoting a tonne price into a conversation that moved elsewhere.
europe-silica-sand-for-glass-making-market-end-use-penetration-index-1787332522062

Our Call On European Glass Sand

These are among the four positions where our research anticipates prominent divergence between winners and laggards over the coming forecast period. Each is grounded in the demand model, the regulatory perimeter, and the announced capacity pipeline.
01 / CONSENTED RESERVE POSITION

Permits rather than reserves are the real asset

Freight is roughly 54% of delivered cost and the economic haulage radius runs 150 to 300 kilometres, so a consented deposit inside that circle is a position no competitor can attack with capital or operating efficiency. Consent takes five to 12 years across European member states where it is granted at all, and refusals on water table and habitat grounds have become routine. Reserves carried on a balance sheet without permits attached are an accounting entry rather than a commercial asset.
02 / LOW IRON RESERVE SCARCITY

Very few European deposits can serve solar glass

Ultra-low iron sand below 0.012 percent iron oxide is required by every solar glass line and available from a small handful of European deposits, which creates genuine scarcity in a mineral that is otherwise abundant everywhere. The segment grows at 9.8% against a market at 4.4% and pricing reflects that scarcity rather than any cost calculation. European photovoltaic glass capacity may arrive later than announced, and holding the reserve costs very little while being the only qualified supplier is worth a great deal.
03 / CUSTOMER CONCENTRATION RISK

One furnace closure can end a whole position

European glass furnaces have closed on energy economics that no sand producer influences or can offset, and a quarry optimised around one large customer finds the entire haulage radius argument working directly against it the moment that furnace goes cold. There is no alternative buyer inside the circle and no route to customers outside it. Multi-furnace contracts and deliberate spread across container, flat, and technical glass are the only defences, and several European producers have already learned this expensively indeed.
04 / LOGISTICS MODE INVESTMENT

Rail and water quietly redraw the competitive radius

Road haulage is over half of delivered cost while rail or barge moves identical tonnage at a fraction of it, which extends the economic radius rather than simply reducing the expense line. A producer with rail loading reaches furnaces that a road-only competitor cannot quote profitably at all, which converts a local position into a regional one. The capital is substantial and the option exists only where geography and existing infrastructure permit it, which is precisely what makes it defensible.

Engagement Snapshot From the Field

A live engagement with an industry participant carrying material or product regulatory and market exposure ahead of a defining policy shift, showing how our research translates into a defensible multi-year portfolio strategy.
MARKET MINDS ADVISORY · CLIENT ENGAGEMENT SUMMARY
Europe Silica Sand for Glass Making Producer Strategic Portfolio Review and Transition Roadmap 2026·Investment Scenario on Europe Silica Sand for Glass Making Exposure Evaluation 2025-26
CLIENT PROFILE
A European container glass group operating nine furnaces engaged MMA after a sand supplier lost a permit renewal at the quarry serving two of its plants. The client reported single sourcing at six of nine furnaces, no mapped alternative deposits inside haulage distance, and delivered sand cost varying by roughly 40% across its network (client-reported, unverified by MMA).
STRATEGIC CHALLENGE
Replacing the affected supply meant either hauling sand from outside the economic radius or requalifying a deposit nobody had assessed, and neither could be arranged before existing stock ran down. Procurement had negotiated the network on price without mapping supply security at all. The board needed the exposure quantified across all nine furnaces before the next contract round.
MMA APPROACH
MMA mapped every consented deposit inside haulage distance of each furnace rather than accepting the incumbent supplier list, which nobody had compiled. We assessed permit status and remaining consented reserve life at each, since three years of consent is a different proposition from twenty. We then modelled delivered cost by transport mode rather than by quarry gate price, because transport mode changed the answer completely.
KEY FINDINGS
  1. Four of nine furnaces had no qualified alternative deposit inside haulage distance at all, which made them genuinely single sourced rather than merely concentrated (client-reported, unverified by MMA).
  2. Two incumbent suppliers held under six years of consented reserve remaining, which nobody in procurement had checked before awarding multi-year contracts or since.
  3. Rail-connected deposits extended the viable radius enough to give three furnaces a second source that road haulage economics had hidden entirely until now.
  4. Delivered cost variation across the network reflected transport mode far more than quarry pricing, so the cheapest quarry gate price frequently delivered the most expensive sand.
CLIENT PROFILE
A European container glass group operating nine furnaces engaged MMA after a sand supplier lost a permit renewal at the quarry serving two of its plants. The client reported single sourcing at six of nine furnaces, no mapped alternative deposits inside haulage distance, and delivered sand cost varying by roughly 40% across its network (client-reported, unverified by MMA).
STRATEGIC CHALLENGE
Replacing the affected supply meant either hauling sand from outside the economic radius or requalifying a deposit nobody had assessed, and neither could be arranged before existing stock ran down. Procurement had negotiated the network on price without mapping supply security at all. The board needed the exposure quantified across all nine furnaces before the next contract round.
MMA APPROACH
MMA mapped every consented deposit inside haulage distance of each furnace rather than accepting the incumbent supplier list, which nobody had compiled. We assessed permit status and remaining consented reserve life at each, since three years of consent is a different proposition from twenty. We then modelled delivered cost by transport mode rather than by quarry gate price, because transport mode changed the answer completely.
KEY FINDINGS
  1. Four of nine furnaces had no qualified alternative deposit inside haulage distance at all, which made them genuinely single sourced rather than merely concentrated (client-reported, unverified by MMA).
  2. Two incumbent suppliers held under six years of consented reserve remaining, which nobody in procurement had checked before awarding multi-year contracts or since.
  3. Rail-connected deposits extended the viable radius enough to give three furnaces a second source that road haulage economics had hidden entirely until now.
  4. Delivered cost variation across the network reflected transport mode far more than quarry pricing, so the cheapest quarry gate price frequently delivered the most expensive sand.
RECOMMENDED STRATEGY
Phase 1: Phase 1 (0 to 6 months): Qualify the rail-served alternatives that extend the radius at the three furnaces where they exist. Phase 2: Phase 2 (6 to 18 months): Make consented reserve life a contract award criterion rather than assessing delivered price alone at every site. Phase 3: Phase 3 (18 to 30 months): Fund a batch trial at the four genuinely single-sourced furnaces to establish any workable alternative.
OUTCOME
The client established second sources at three furnaces through rail-served deposits nobody had assessed, and made reserve life a standing award criterion. Total delivered sand cost fell by roughly 7% because transport mode rather than quarry pricing turned out to be the lever, and the four single-sourced sites now have documented contingency plans (client-reported, unverified by MMA).

Frequently Asked Questions

Foundational context covering the market sizes, CAGR, scope, country, region and competition that inform every finding below. This section is provided to cover basics and most often pre-purchase conversations, answered from the MMA Primary Research Dataset.

What is the current size of the Europe Silica Sand for Glass Making Market?

The European market is valued at USD 1.9 billion in 2025, covering processed silica sand supplied to container, flat, solar, fibreglass, and specialty glass makers. Foundry, filtration, and construction sand are excluded.

How large will the Europe Silica Sand for Glass Making Market be by 2036?

The market is forecast to reach USD 3.05 billion by 2036 in the base case, about 1.54 times the 2026 level. That represents incremental value of roughly USD 1.07 billion across the decade.

What is the CAGR for the Europe Silica Sand for Glass Making Market 2026 to 2036?

The market grows at a 4.4% CAGR in the base case, with bull and bear scenarios at 5.5% and 3.2%. The spread turns mainly on solar glass investment and European furnace competitiveness.

Which segment is growing fastest?

Ultra-low iron solar glass sand grows fastest at 9.8%, about 2.23 times the overall rate, as European photovoltaic glass capacity is built. Fibreglass and technical glass sand follow at 6.2%.

Who are the major companies in the Europe Silica Sand for Glass Making Market?

Leading producers include Sibelco, Quarzwerke Group, Strobel Quarzsand, Kremer Group, and Sablieres de Nemours. Concentration is severe on paper, with the top five holding roughly 64% of revenue.

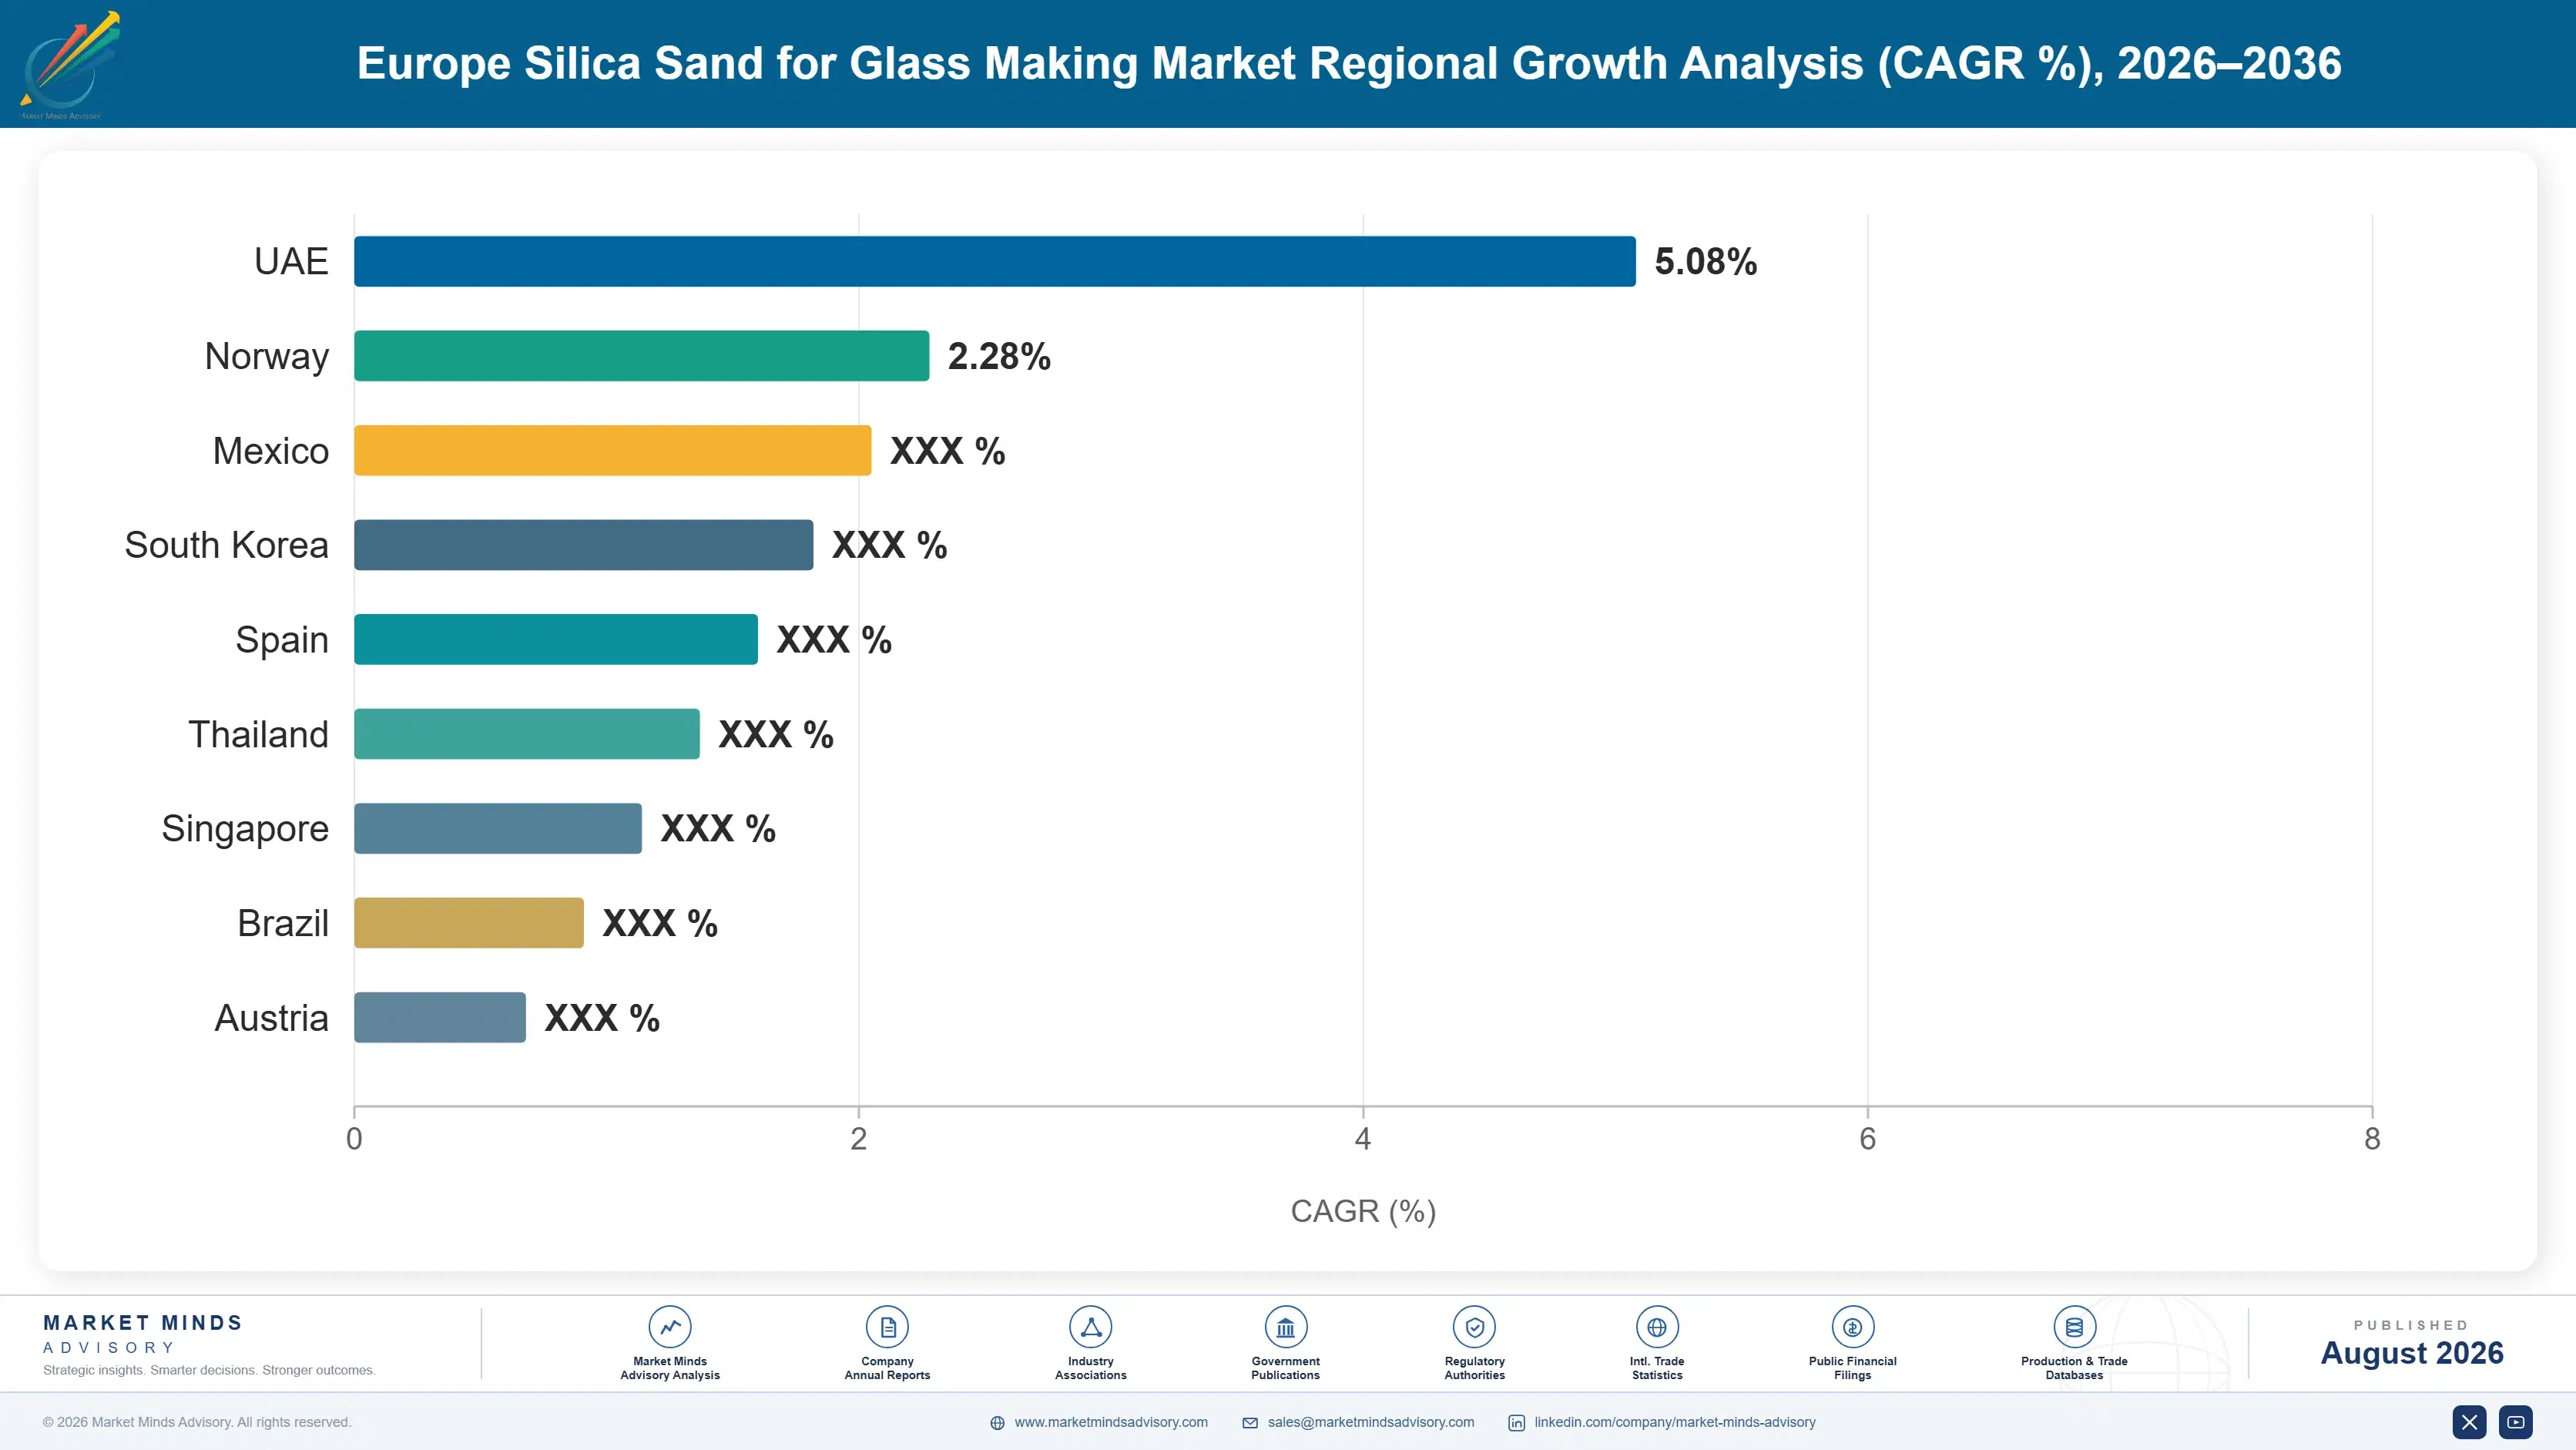
Which country is growing fastest?

Poland grows fastest at a 5.4% CAGR, on container glass investment and announced solar glass projects. Czechia and Hungary follow as glass manufacturing continues moving eastward.

Report Segmentation Architecture

The full report scope spans multiple orthogonal segmentation dimensions, with cross-tabulated demand data provided for each dimension pair. Coverage extends further to regional breakdowns, trend trajectories, and the competitive detail needed to support segment-level decision-making.

By Glass End Product

  • Container Glass Sand
  • Flat and Float Glass Sand
  • Ultra-Low Iron Solar Glass Sand
  • Fibreglass and Technical Glass Sand
  • Tableware and Specialty Glass Sand

By End-Use Industry

  • Food and Beverage Packaging
  • Construction and Automotive Glazing
  • Solar Photovoltaic Manufacturing
  • Wind, Insulation and Composites
  • Pharmaceutical and Laboratory Glass

By Supply Arrangement

  • Long-Term Contract To Glass Group
  • Single Furnace Direct Supply
  • Distributor and Trader Supply
  • Captive Quarry Internal Transfer

By Region

  • North America
  • Western Europe
  • East Asia
  • South Asia and Pacific
  • Latin America
  • Middle East and Africa
  • Eastern Europe

Scope, Methodology, and Coverage

Every figure in this report is reproducible from documented input assumptions. The scope below maps the historical period, the forecast horizon, the segmentation dimensions, and the countries covered, alongside the underlying primary and qualitative methodology.
Historical Period
2020 to 2025
Forecast Period
2026 to 2036
Base Year
2025 (USD billions; MMA Primary Research Dataset, August 2026)
Market Definition
The Europe silica sand for glass making market comprises the extraction, processing, and sale of silica sand specified for glass manufacture across European markets, valued at producer selling prices delivered to glass manufacturers and their distributors. It spans container glass sand, flat and float glass sand, ultra-low iron sand for solar photovoltaic glass, fibreglass and technical glass sand, and tableware and specialty glass sand, together with the washing, classification, drying, and chemical analysis supplied with them. Silica sand supplied for foundry casting, hydraulic fracturing proppant, water filtration, sports and equestrian surfaces, construction aggregate, cement, or metallurgical and chemical silicon production is excluded, as are cullet and recycled glass, soda ash, limestone, dolomite and other glass batch materials, high-purity quartz for semiconductor crucibles, and glass manufacturing itself.
Quantitative Units
USD billions (current prices); volume in million tonnes of processed sand
Segmentation Dimensions
By Glass End Product; By End-Use Industry; By Supply Arrangement; By Region
Regions Covered
North America, Western Europe, East Asia, South Asia and Pacific, Latin America, Middle East and Africa, Eastern Europe
Countries Covered
Germany, France, Italy, Spain, Poland, Czech Republic, Netherlands, Belgium, UK, Portugal, Austria, Hungary, Romania, Bulgaria, Slovakia, Sweden, Finland, Denmark, Norway, Ireland, Greece, Croatia, Slovenia, Serbia, Turkey, Switzerland, Lithuania, Latvia, Estonia, Ukraine, and additional markets relevant to this sector
Key Companies Profiled
Sibelco, Quarzwerke Group, Strobel Quarzsand, Kremer Group, Sablieres de Nemours, Sibelco Nordic, Euroquarz, Schlingmeier Quarzsand, Amberger Kaolinwerke, Provencale SA, Fulchiron, Minerali Industriali, Cemex Silica, Kaltun Madencilik, Sitindustrie, LB Minerals, Kopalnia Piasku Szklarskiego Osiecznica, Sklopisek Strelec, Holcim Aggregates, Aurubis Mineral
Quantitative Methodology
Primary survey, n=3,800 respondents, Q4 2025, six countries; demand-side model with trade association cross-validation
Qualitative Methodology
47 expert interviews, Q4 2025; applied to validate demand model assumptions, identify emerging dynamics, and assess competitive positioning
Report Format
PDF and XLSX data workbook (Word format preview document)
Publisher
Market Minds Advisory
Report Code
MMA-2026-CHM-400
Published
August 2026
Contact
sales@marketmindsadvisory.com | www.marketmindsadvisory.com

Purchase the full Europe Silica Sand for Glass Making Market Report (2026 to 2036).

The full MMA Europe Silica Sand for Glass Making report sizes the market across five glass end products, five end-use industries, four supply arrangements, and seven regions through 2036. It profiles 20 producers on a consistent basis of processed glass sand revenue, scoring each on consented reserve position, iron content capability, processing depth, and logistics mode. Scenario models quantify how furnace closures, solar glass investment, and cullet substitution move both volume and achievable margin by end product. The report also includes haulage radius mapping against active furnace locations, consented reserve life estimates by producer, iron content capability screening across European deposits, and delivered cost decomposition by transport mode.
Five-product and four-arrangement market sizing to 2036
Twenty-producer benchmark on processed glass sand revenue
Haulage radius mapping against active European furnace locations
Consented reserve life estimates by producer and deposit
Iron content capability screening across European silica deposits
Delivered cost decomposition by road, rail, and water transport

Built For The People Who Decide

From boardroom strategy to bench-side execution, this report is read cover-to-cover by leaders shaping the next decade of their industry, turning demand scenarios, market dynamics and valuation benchmarks into decisions.
CXOs/ Presidents/ VPs/ Managers
M&A and Corporate Development
Strategy Teams and R&D Heads
Procurement and Product Directors
Regulatory and Compliance Leaders
Investor Relations and Equity Analysts