Market Minds Advisory
Environmental Monitoring Services Market

Environmental Monitoring Services Market: Selling Legal Defensibility, Not Data

Anybody can measure a contaminant. Very few organisations can produce a result that survives an enforcement hearing three years later, and that gap is the entire commercial basis of this industry.

Lead Analyst

David Horsley

Published

August 2026

Make Smarter Decisions with Customized Research Insights

Request a free sample report and evaluate market opportunities, growth trends, and competitive dynamics relevant to your business needs.

2025 MARKET VALUE$14.5BMarket Size 2025
2036 FORECAST VALUE$31.8BBase Case , 2026 to 2036
CAGR 2026 TO 20367.4 %Bull 8.6% / Bear 6.2%
INCREMENTAL OPPORTUNITY$16.2BNet 10- year value creation
EXPANSION MULTIPLE2.04x2036 value over 2026 base
Strategic Levers
M&A Pipeline
Regional Outlook
Country Rankings
Competitive Intelligence
Segmental Deep-dive
Call-Us : 91 93563 13602

Executive Snapshot and Market Trajectory

The deliverable in this industry is not a measurement. It is a result that survives cross-examination in an enforcement action or a transaction three years after the sample was taken, and that requires accreditation, chain of custody, and a laboratory near enough to meet a 48 hour holding time.
Growth runs at 7.4% and continuous monitoring leads it. Emissions and ambient air monitoring grows at 11.1%, exactly 1.50 times the market rate, as permit conditions shift from periodic sampling toward instruments that report without interruption. East Asia holds 30% on Chinese national monitoring networks and third-party operator mandates, with North America close behind on long-established regulatory demand. Emerging contaminant scope is arriving at sites already under contract.
Concentration is very low at 22% across the top five measured on environmental services revenue, and sample holding times explain most of that. A laboratory must be within driving distance of the sample, so roughly 9,400 accredited laboratories serve jurisdictions that no consolidated network can cover from a central site. Frameworks retain at roughly 91% because switching provider breaks a dataset regulators later read. Incumbency is worth considerably more than any pricing advantage here.
Market Definition
This market covers environmental monitoring and compliance services delivered to regulated sites, spanning continuous emissions and ambient air monitoring, water and wastewater compliance testing, contaminated land and groundwater assessment, laboratory analytical services, and noise, vibration and occupational monitoring. Monitoring instruments and analysers sold as equipment, environmental engineering design and remediation construction, waste collection and disposal, environmental insurance and financial services, and general management system certification fall outside scope.
Base Year Value
$14.5B in 2025 (MMA Primary Research Dataset, August 2026)
Forecast Period
2026 to 2036, eleven discrete annual values
CAGR
7.4% base case. Bull 8.6%. Bear 6.2%.
Fastest Growth Segment
Continuous Emissions and Ambient Air Monitoring: 11.1% CAGR
Fastest Growth Country
India: 10.2% CAGR
Fastest Growth Region
South Asia and Pacific: 9.6% CAGR
Largest Region
East Asia: 30% of 2025 global value
Market Leaders
SGS, Bureau Veritas, Eurofins Scientific, Intertek, ALS Limited. Source: MMA Analysis based on company annual reports.
Primary Survey
n=3,800 procurement and R&D decision-makers, Q4 2025, six countries
Methodology
Demand-side build-up, cross-validated against public data, 47 expert interviews

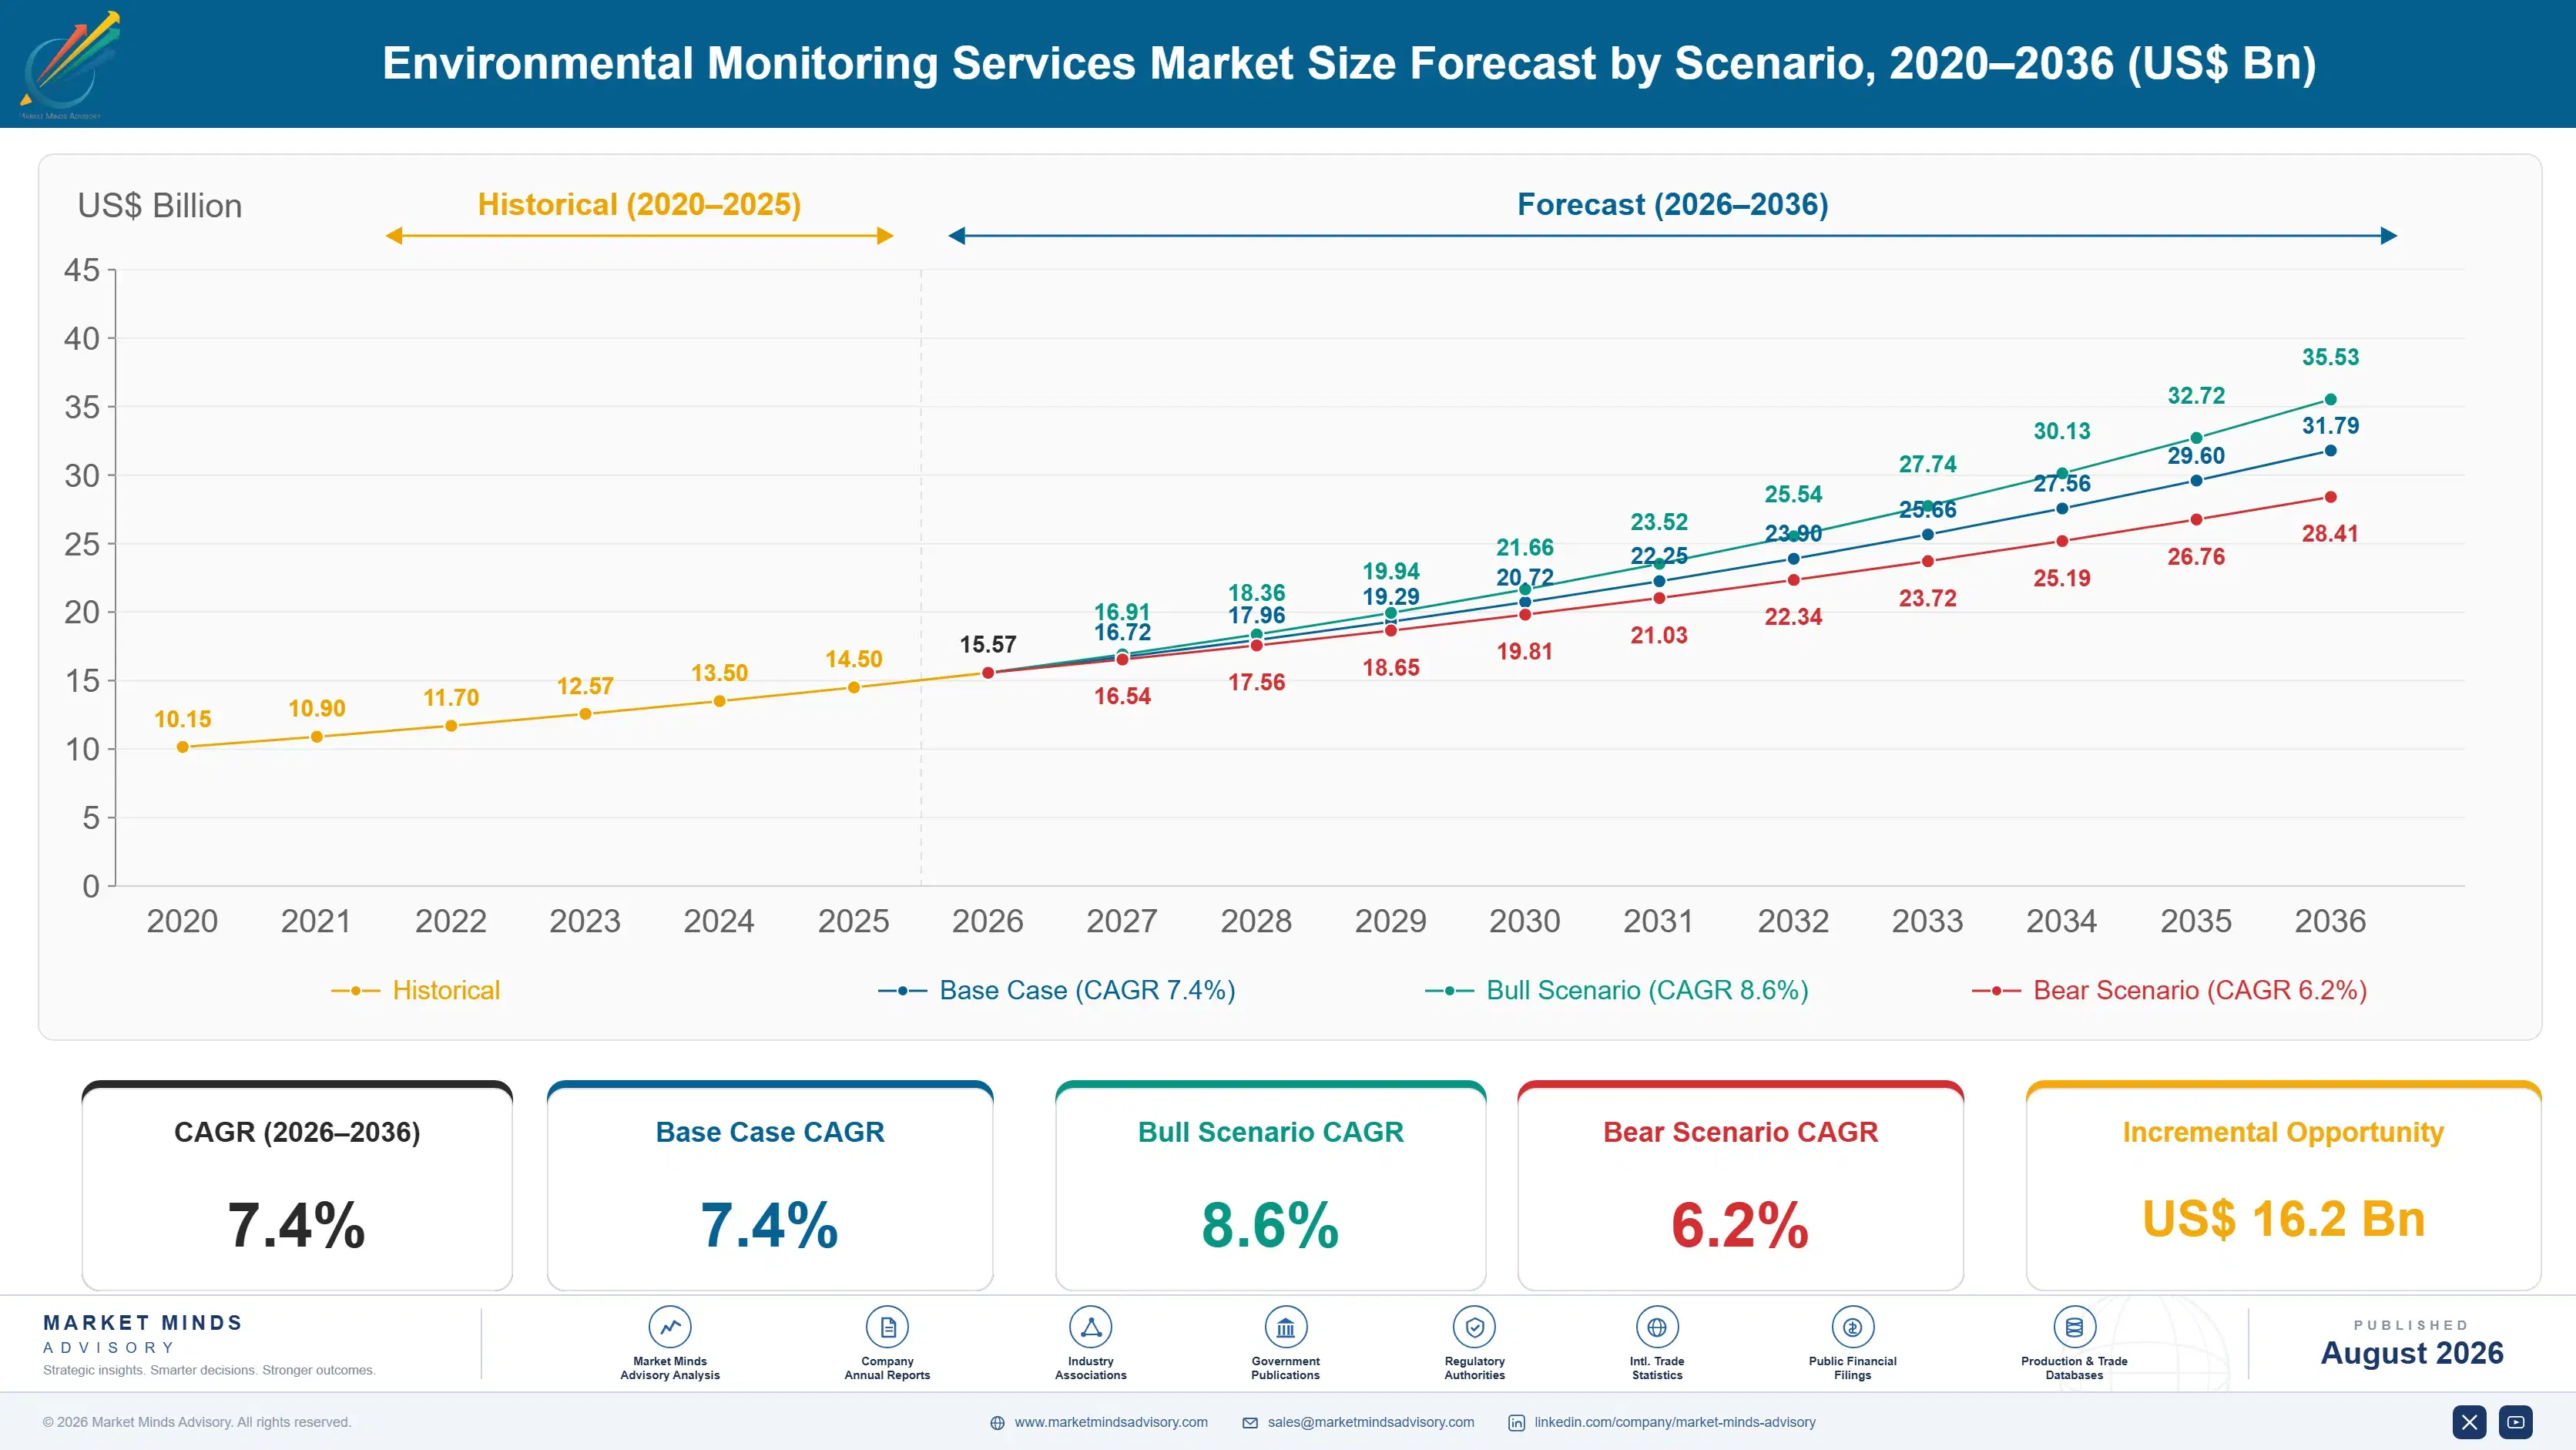
Environmental Monitoring Services Market Forecast Scenarios

environmental-monitoring-services-market-size-forecast-scenario-1787302694904
The 2020 to 2025 period ran at 6.2% and the composition changed considerably across it. Field sampling work paused through 2020 and 2021 as site access closed, while continuous monitoring revenue continued uninterrupted because the instruments were already installed. That contrast reset how clients thought about monitoring architecture, and continuous installations grew faster from 2022 than any periodic sampling line did.
Three mechanisms carry the 7.4% base case. Continuous emissions monitoring mandates are the largest, since permit conditions across most regulated jurisdictions are moving from periodic sampling toward instruments reporting without interruption. Per- and polyfluoroalkyl substance testing is the second, adding analytical scope at sites that were already monitored. And contaminated land assessment is the third, driven by industrial site redevelopment rather than by any regulatory change. None of the three depends on industrial output rising at all.
The 8.6% bull case rests on emerging contaminant regulation broadening faster than currently legislated, which would add analytical scope across a client base already under contract. The 6.2% bear case is industrial production weakness reducing permitted activity across several regions at once, since monitoring obligations scale with operating sites rather than with any environmental outcome.

Results That Survive Cross-Examination

What clients buy here is defensibility. A result that cannot be traced through documented chain of custody, produced under recognised accreditation, and defended by a named analyst years later is worth nothing in an enforcement hearing, a permit variation, or a contaminated land transaction. Measurement is the easy part of this business and it is not what anybody is paying for.
TOP FIVE CONCENTRATION22%Very fragmented, with accredited laboratories serving every separate jurisdiction
SAMPLE HOLDING TIME48 hoursFor the shortest analytes before a result loses legal standing
ACCREDITED LABORATORY COUNT9,400Holding recognised testing accreditation across the jurisdictions covered here
LABOUR SHARE OF COST54%Of service delivery cost from qualified technical staff alone
CONTINUOUS MONITORING SHARE27%Of revenue from instruments operating permanently rather than periodic sampling
FRAMEWORK RETENTION RATE91%Of agreements retained at each competitive retender across clients
Physical constraints explain the market structure. Several regulated analytes have holding times as short as 48 hours between sampling and analysis, which means a laboratory must sit within driving distance of the site. Roughly 9,400 accredited laboratories exist across covered jurisdictions as a result, and concentration at 22% follows from geography rather than from any absence of consolidation attempts. Nobody wants to explain a methodology change to a regulator either.
The revenue mix is shifting toward instruments. Continuous monitoring now accounts for around 27% of revenue and grows at 11.1%, and it behaves quite differently from sampling work: installed, contracted for years, and unaffected by the site access disruptions that stopped field crews in 2020. Providers built around field sampling have found that transition harder than they expected. The commercial model differs as much as the technology does.
"Clients ask us which provider has the best analytical capability. The right question is which provider will still have the raw data, the calibration records, and the analyst's notes when a regulator asks for them in 2032."
Director, Environmental Services and Compliance Practice · MMA Testing Practice

Market Trends

Continuous Instruments Replace Periodic Sampling Programmes

Permit conditions across most regulated jurisdictions are moving from periodic stack tests and grab samples toward instruments that report without interruption, and continuous monitoring grows at 11.1% against 7.4% for the market. It now carries around 27% of revenue. The commercial model differs: installed instruments generate multi-year service and data management contracts rather than repeat sampling visits, and providers built around field crews have found that shift genuinely difficult. A reporting gap in a continuous dataset is itself a compliance failure the client must explain. Uptime obligations are onerous. Sampling programmes never carried that risk.
Market Impact: Frameworks retain at 91% rate
Emerging Contaminants Add Scope To Existing Clients

Per- and polyfluoroalkyl substances, microplastics, and an expanding list of emerging contaminants are being added to permit conditions at sites already under monitoring contracts, which adds analytical scope without any new client acquisition. The analytical methods demand instrumentation and detection limits that many regional laboratories do not hold. That has begun concentrating the analytical layer even while sampling and field work stay resolutely local. Providers without the analytical capability subcontract the work and carry the liability without the margin. Clients rarely see that arrangement. Scope then migrates away quietly. Detection limits decide participation.
Market Impact: Land assessment grows at 8.6%

Market Opportunities and Growth Drivers

Defensibility Requirements Keep Switching Costs High

Framework agreements retain at roughly 91% through competitive retender, because a client changing provider mid-programme creates a discontinuity in a dataset that regulators and buyers will later scrutinise. Historical comparability matters more than the current year's price. That dynamic protects incumbents strongly and makes the initial framework win worth considerably more than its first-year revenue suggests to anybody pricing it. A provider holding a decade of a client's monitoring history has an advantage no competitor can price against at all. Historical comparability decides retenders. Annual pricing rarely does. Incumbency is the asset.
Market Impact: Analytes expire within 48 hours

Industrial Site Redevelopment Drives Land Assessment

Contaminated land and groundwater assessment grows at 8.6%, driven by former industrial sites being redeveloped for housing, logistics, and data centres rather than by any regulatory change. Transactions cannot complete without defensible assessment, and lenders increasingly require it independently of what regulators demand. The work is project-based rather than recurring, which makes it less predictable than compliance monitoring and considerably better priced. A deal worth hundreds of millions can turn on a report costing a fraction of one percent of it. Nobody negotiates hard on that fraction. Timing matters far more than fee.
Market Impact: Labour is 54% of delivery cost

Market Restraints and Challenges

Holding Times Prevent Any Network Consolidation

Several regulated analytes must reach a laboratory within 48 hours of sampling, and the root cause is that the analyte itself degrades or transforms in the container regardless of preservation. Commercial impact is that roughly 9,400 accredited laboratories exist because no centralised network can serve jurisdictions it cannot physically reach in time. Mitigation runs through regional laboratory acquisition, field-deployable methods for the shortest-hold analytes, and courier networks built specifically around holding time windows. None of those mitigations removes the constraint, since the analyte degrades regardless of who owns the laboratory. Geography decides participation.
Market Impact: Continuous work is 27% of revenue

Qualified Technical Labour Constrains Delivery Capacity

Labour carries roughly 54% of service delivery cost and the root cause is that accredited work requires named, competent analysts and field technicians whose qualification takes years and cannot be surged. Commercial impact is that providers turn down work during demand peaks rather than subcontracting it, since subcontracted results carry the provider's accreditation and its liability. Mitigation runs through internal training pipelines, automation of routine analysis, and multi-year framework structures that smooth demand. Providers that stopped training through the last downturn spent considerably more rebuilding capability afterwards. Recruiting from competitors moves the shortage around.
Market Impact: Holding times run to 48 hours
4 additional market trends, 3 additional growth drivers, and 2 additional restraints and challenges are covered in the full report. Contact sales@marketmindsadvisory.com to access the complete intelligence.

Segment CAGR and Growth Architecture

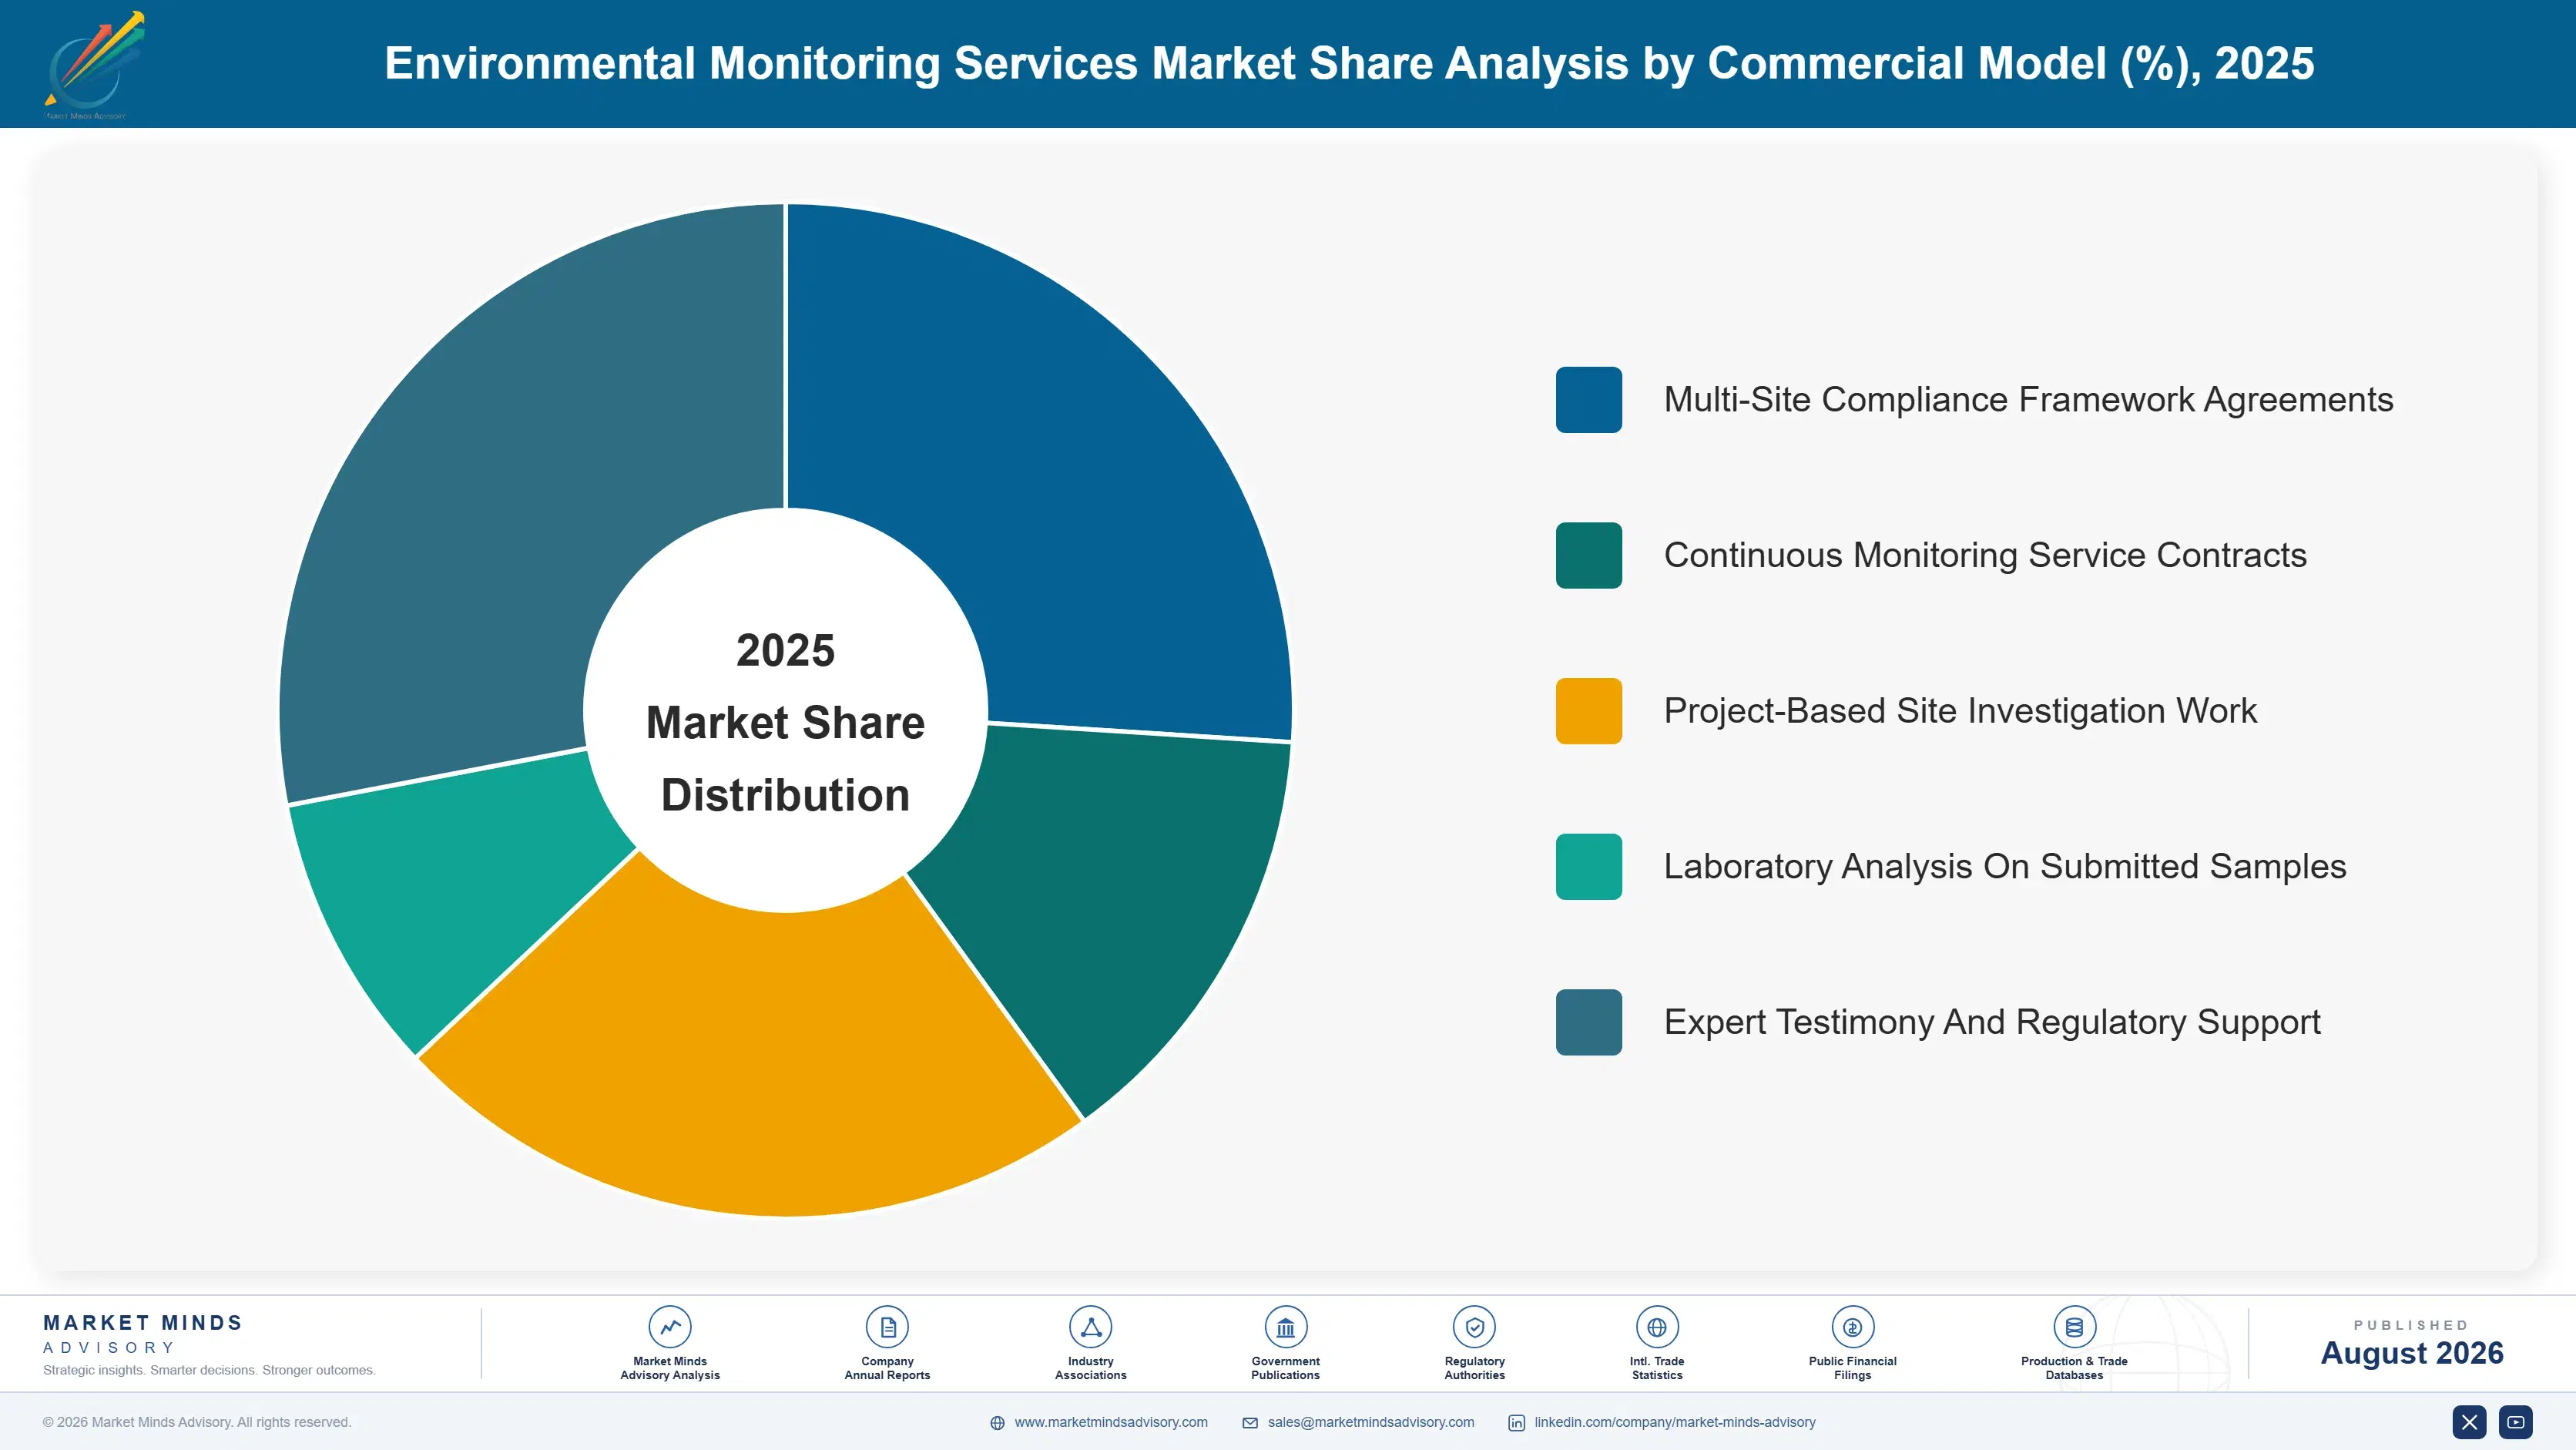
Segmentation follows the environmental medium monitored and the discipline required to do it, because that determines accreditation scope, instrumentation, competency requirement, and the regulatory regime the result must satisfy. Client industry and contract structure both cut across every discipline rather than separating them, which makes either a weaker primary dimension here. Discipline is what the accreditation actually covers.
environmental-monitoring-services-market-market-share-analysis-1787302695438

Continuous Emissions And Ambient Air Monitoring

The fastest discipline at 11.1%, exactly 1.50 times the market rate, covering installed stack analysers, ambient air networks, and the data management and reporting layers built on top of them. Around 27% of market revenue now comes from this work. The commercial model is multi-year service, calibration, and data assurance rather than repeat visits, which makes revenue considerably more predictable than sampling work. Instrument uptime obligations are onerous, since a reporting gap in a continuous dataset is itself a compliance failure that the client must explain to a regulator. Data management and reporting integration increasingly matter more to the client than the measurement itself does. That shifts who makes the buying decision.
CAGR 11.1%

Contaminated Land And Groundwater Assessment

Second fastest at 8.6%, covering site investigation, groundwater monitoring well programmes, risk assessment, and the reporting that supports redevelopment and transactions. Growth follows industrial site redevelopment for housing, logistics, and data centres rather than regulation, and lenders now require defensible assessment independently of what regulators ask. The work is project-based and less predictable than compliance monitoring, and it is priced considerably better because the client's transaction depends on it. Emerging contaminant scope has extended assessment programmes at sites everyone thought were already characterised. Timing rather than fee decides these appointments, since a delayed report holds up a transaction worth far more. Providers who can mobilise quickly win repeatedly. Price is rarely the deciding term.
CAGR 8.6%
Full segment breakdown across 5 segments available in the complete report.

Regional Architecture and Country Demand Map

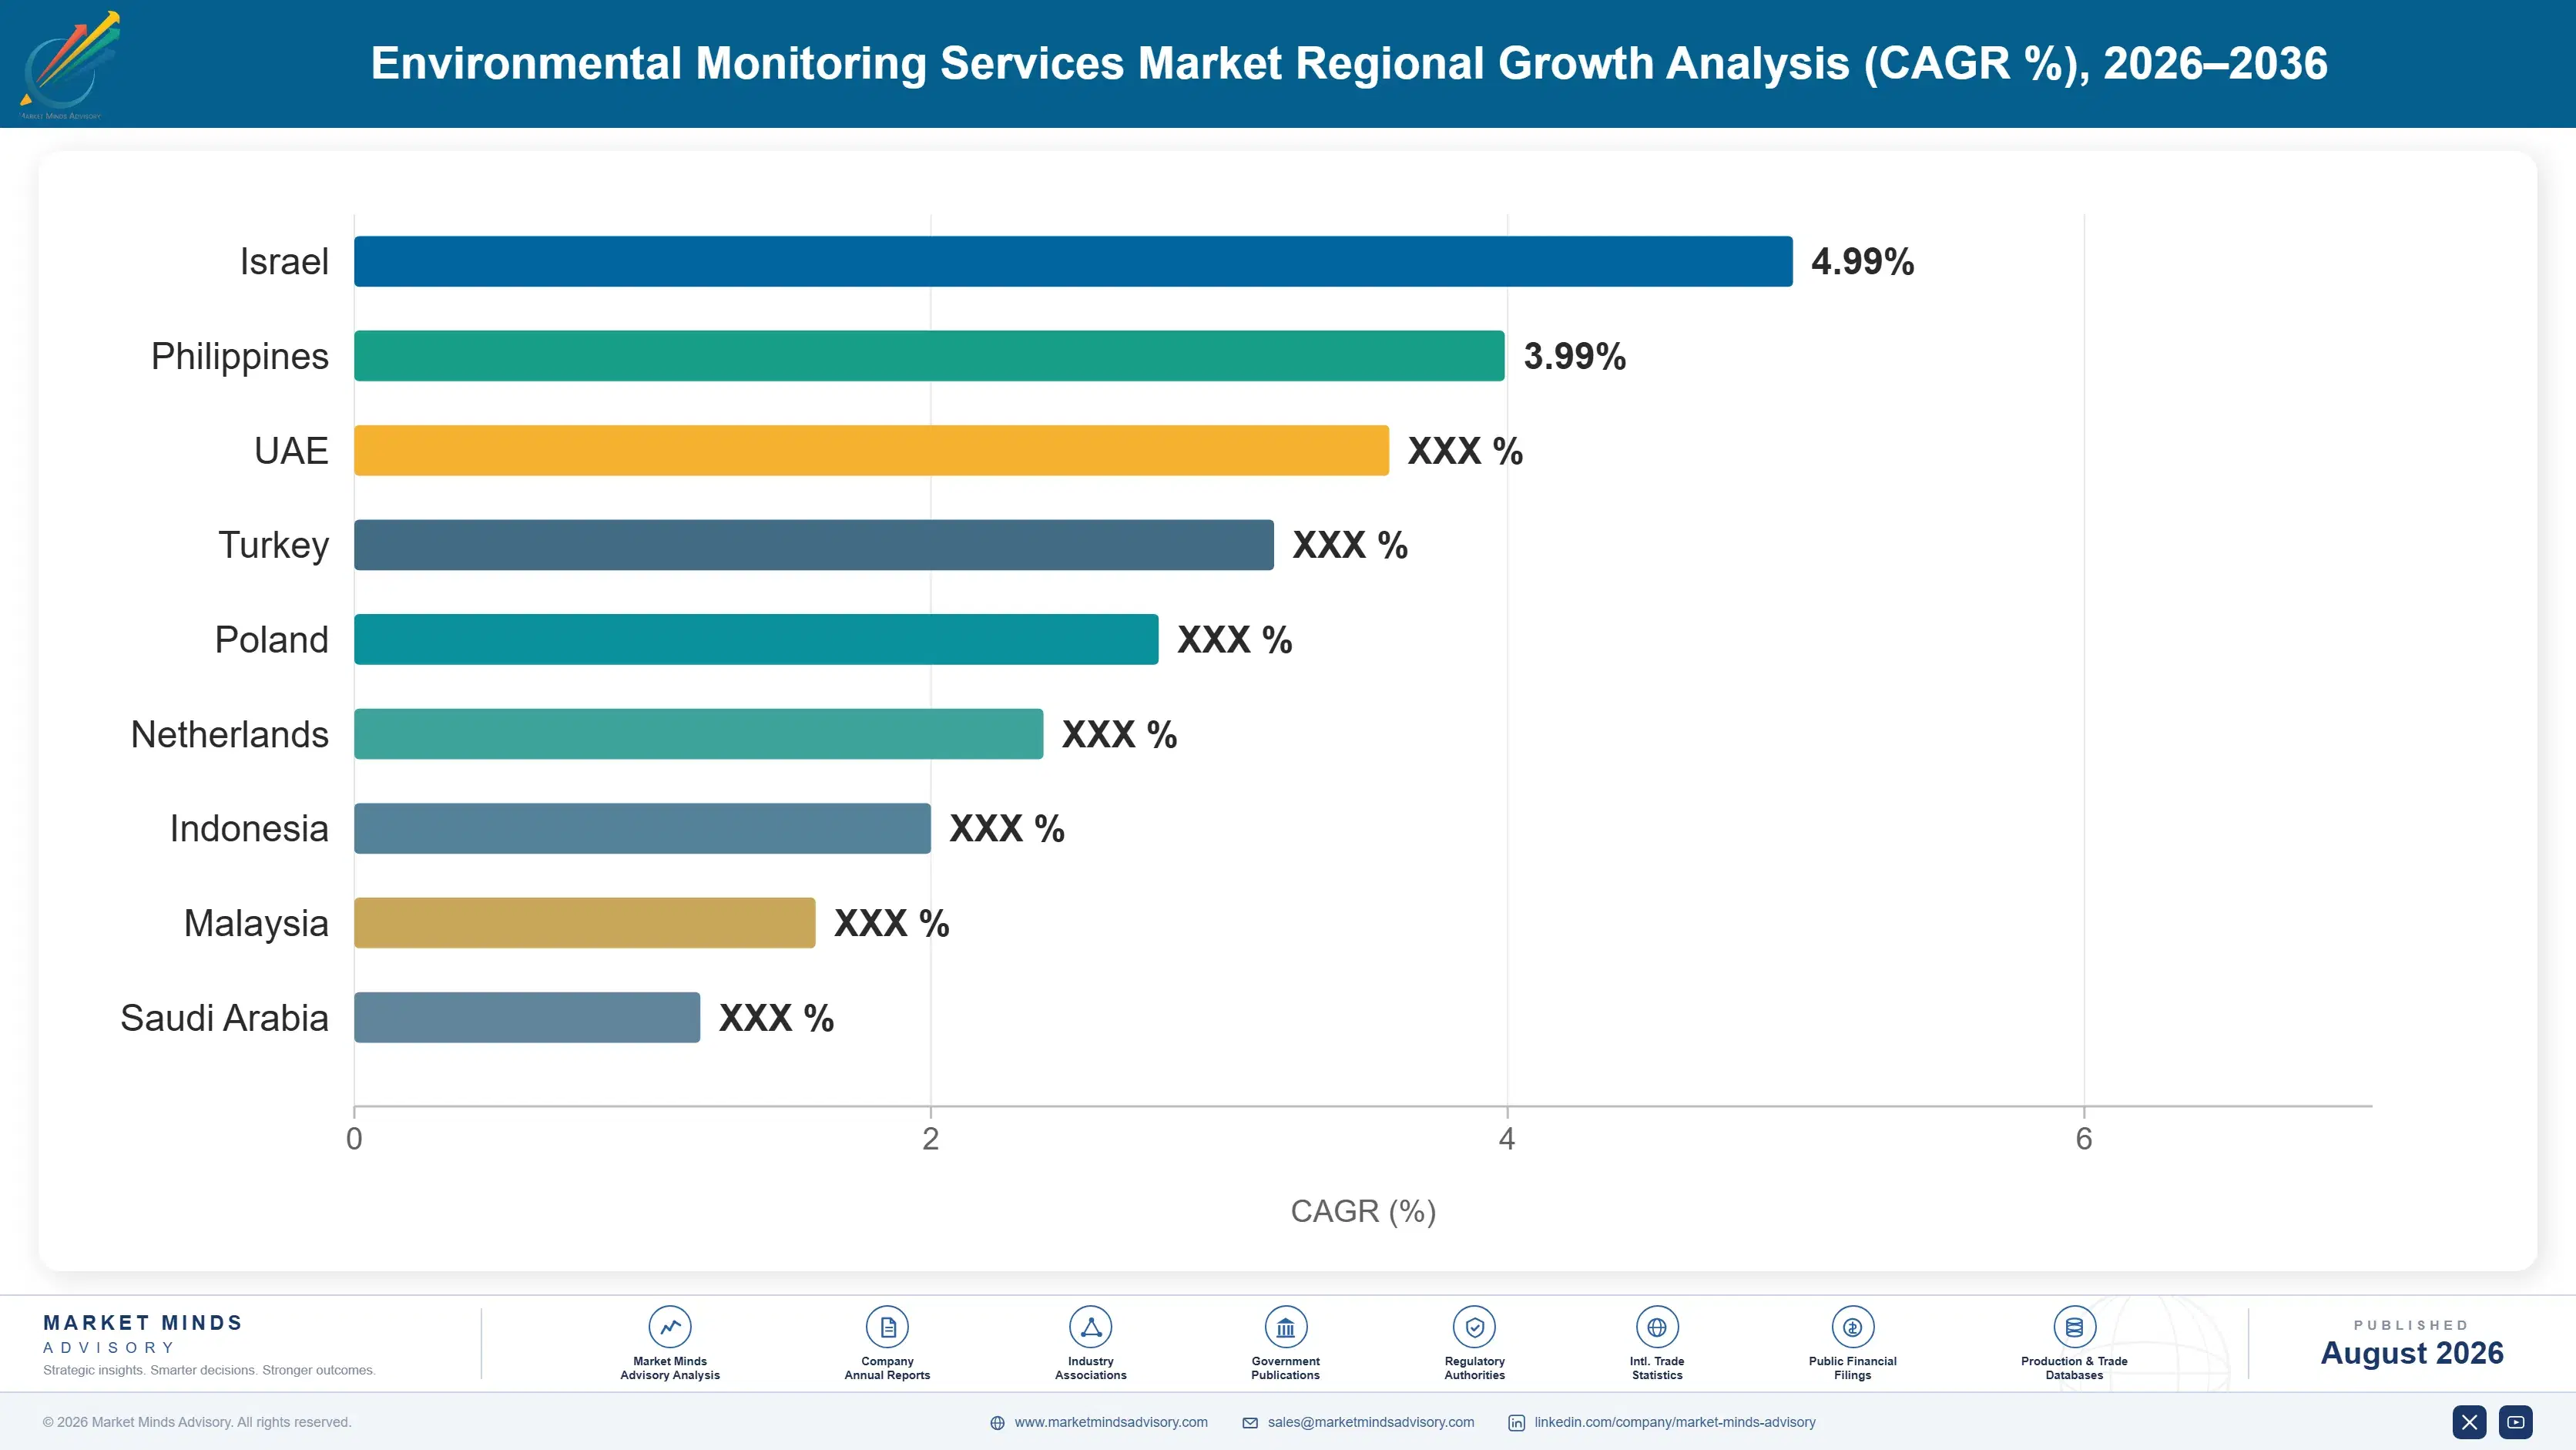
East Asia leads at 30% on Chinese national monitoring networks and third-party operator mandates, with North America close behind on long-established regulatory demand. India grows fastest as enforcement capacity builds. Every regional share sits inside its framework band here. Regulation rather than industry drives the pattern.

East Asia

Thirty percent, at the top of the framework band, and Chinese national air and water monitoring networks account for most of it. Third-party operator mandates require permitted sites to contract independent monitoring rather than self-report, which created a large service market inside a decade. Continuous instrument penetration is higher here than anywhere, because the networks were designed around continuous reporting from the start rather than migrating to it. Growth at 8.5% runs above the market rate as enforcement intensity rises and emerging contaminant scope arrives. Japanese and Korean demand is smaller, mature, and weighted toward complex analytical work rather than the network operations that dominate Chinese volume. The two behave as separate markets.
Share: 30% | CAGR: 8.5% (2026 to 2036)

North America

Twenty-six percent, and the regulatory architecture here is the oldest anywhere, which shows in how the market behaves. Framework agreements are long, defensibility expectations are high, and litigation risk shapes provider selection more than price does at any serious client. Contaminated land assessment is unusually large, driven by industrial site redevelopment and by lender requirements that operate independently of regulation. Growth at 6.8% sits below the market rate, reflecting a mature base rather than any weakening of requirements. Accredited laboratory density is high and holding time constraints are rarely binding, which lets providers compete on capability rather than on geography alone. Emerging contaminant work has expanded quickly. Litigation exposure drives much of it.
Share: 26% | CAGR: 6.8% (2026 to 2036)
Regional intelligence for 5 additional markets available in the complete report: Western Europe, South Asia and Pacific, Latin America, Middle East and Africa, Eastern Europe. Contact sales@marketmindsadvisory.com.
environmental-monitoring-services-market-country-cagr-analysis-1787302695956

Frameworks, Instruments And Accreditation Scope

Frameworks retain at 91%, holding times run to 48 hours, labour carries 54% of delivery cost, and continuous monitoring is 27% of revenue. Value comes from winning frameworks rather than jobs, from instrument-based contracts, and from analytical scope competitors cannot match. None of that is about measurement capability. Everybody can measure. Defensibility is the product.

Win Frameworks Rather Than Individual Sampling Jobs

Framework agreements retain at roughly 91% through competitive retender, because changing provider mid-programme creates a dataset discontinuity that regulators and buyers will later scrutinise closely. The first framework win is therefore worth many times its first-year revenue, and pricing it as a single-year job misprices it badly. Providers that bid frameworks on cost and jobs on margin have the logic exactly inverted, and several large ones do. Historical comparability decides retenders far more reliably than the current year's pricing does. A decade of a client's data is unpriceable by any challenger.
Market Impact: Frameworks retain at 91% of every s

Convert Sampling Clients To Installed Instrument Contracts

Continuous monitoring carries around 27% of revenue and grows at 11.1% against 7.4% for the market, generating multi-year service, calibration, and data assurance revenue instead of repeat visits. Installed instruments also proved immune to the site access disruption that stopped field crews entirely in 2020. Providers built around field sampling capacity are defending a model whose share of the market falls every year without exception. Instrument uptime obligations are onerous, since a reporting gap is itself a compliance failure the client explains. That risk is also what makes the contract sticky.
Market Impact: Continuous work is now 27% of total

Build Emerging Contaminant Analytical Scope Deliberately

Per- and polyfluoroalkyl substances and other emerging contaminants demand instrumentation and detection limits that many regional laboratories do not hold, and the scope is being added at sites already under contract. That concentrates analytical work even where sampling stays local. A provider with the analytical capability captures scope expansion at competitors' clients through subcontract, and one without it watches its own clients' scope go elsewhere. Emerging contaminant scope typically adds around 15% to the annual value of an existing site programme. It arrives without any business development at all. The capability decides who collects it.
Market Impact: Scope expansion adds around 15% at

Acquire Regional Laboratories Inside Holding Time Reach

Several regulated analytes must reach a laboratory within 48 hours, which makes physical presence a requirement rather than a convenience and explains why roughly 9,400 accredited laboratories exist. Organic expansion into a new jurisdiction means accreditation processes measured in years. Acquiring an accredited regional laboratory buys the accreditation, the client relationships, and the analysts together, and it remains the only route that moves at commercial speed. Roughly 9,400 accredited laboratories exist for exactly this reason, and no consolidated network has changed that. Geography is the market structure. Nothing else has ever changed it.
Market Impact: Around 9,400 accredited laboratorie

Who Controls the Margin Pool

Concentration is very low at 22% across the top five measured on environmental services revenue, and holding times rather than any absence of consolidation attempts explain it. Several analytes must reach a laboratory within 48 hours, so physical presence in a jurisdiction is a requirement rather than a strategy, and roughly 9,400 accredited laboratories exist as a result. The leader to challenger gap is meaningful only in complex analytical work and multi-jurisdiction frameworks.
Competitive activity runs on three fronts. Framework position is the first, since retention at 91% makes incumbency worth far more than any pricing advantage. Analytical scope is the second, where emerging contaminant capability concentrates work that sampling never will. And instrument-based contracting is the third, which is where the market's growth has moved and where field-sampling providers are weakest.

Pressure arrives from two directions. Engineering consultancies have moved into monitoring to hold client relationships they were losing at the compliance layer. And instrument manufacturers increasingly offer monitoring as a service. Rankings shift on framework wins rather than on any capability announcement. Neither pressure has moved the ranking, since both entrants face the same accreditation and holding time constraints incumbents do. Capability announcements decide nothing here.
environmental-monitoring-services-market-company-positioning-matrix-1787302696469

Competitive Moat and Risk Dimensions

SGS

Moat: Accredited network across jurisdictions

Accredited laboratory presence across a large number of jurisdictions lets a provider serve multi-site clients under one framework where holding times would otherwise force several regional appointments. Accreditation in each jurisdiction takes years to obtain independently. Multi-jurisdiction frameworks are the only contracts where global scale confers real advantage, and they retain at high rates once won.
SGS

Risk: Local providers competing on price

Roughly 9,400 accredited laboratories exist and a local provider inside holding time reach can serve single-site clients at costs a global network does not carry. Scale confers nothing on a single-jurisdiction framework. That competition is strongest in exactly the routine compliance work that fills laboratory capacity between complex projects.
BUREAU VERITAS

Moat: Framework retention and client depth

Framework agreements retain at roughly 91% through retender because dataset continuity matters more to clients than annual pricing, and long incumbency compounds that with historical data nobody else holds. A provider with a decade of a client's monitoring history has an advantage no competitor can price against. Switching creates a discontinuity that regulators later scrutinise.
BUREAU VERITAS

Risk: Field sampling model share declining

Continuous monitoring now carries around 27% of revenue and grows at 11.1%, while periodic sampling work grows considerably more slowly. A provider weighted toward field crews is weighted toward the shrinking share of its own market. Instrument-based contracting requires capability and commercial structures that field sampling organisations have found difficult to build.

Players Tracked

Prominent Players

SGS
Bureau Veritas
Eurofins Scientific
Intertek
ALS Limited

Other Key Players

Tetra Tech
AECOM
Jacobs
Stantec
Arcadis
WSP Global
Ramboll
ERM
Element Materials Technology
Pace Analytical Services
Montrose Environmental Group
TUV SUD
DEKRA
Applus
Enthalpy Analytical

Recent Developments

FEBRUARY 2025

Provider acquires regional laboratory for holding time coverage

An environmental services group acquired an accredited regional laboratory to bring several client sites inside holding time reach, having previously been unable to bid that work at all. The transaction was an acquisition rather than a partnership, joint venture, or accreditation extension of its existing laboratory network.
Signal: Accreditation and physical presence get bo
MAY 2025

Regulator mandates continuous monitoring at permitted sites

A regulator moved a category of permitted industrial sites from periodic stack testing to continuous emissions monitoring with automated reporting, converting a periodic service requirement into an installed instrument obligation. The change was a permit condition revision rather than any new legislation or enforcement action.
Signal: Permit conditions are now converting sampl
SEPTEMBER 2025

Client extends monitoring scope for emerging contaminants

A manufacturer added per- and polyfluoroalkyl substance analysis across its monitoring programme at sites already under a compliance framework, expanding analytical scope without changing provider or contract structure. The extension was a scope variation driven by permit conditions rather than any commercial or competitive process.
Signal: Emerging contaminant scope arrives at exis

Analysts, Accreditation and Fleet

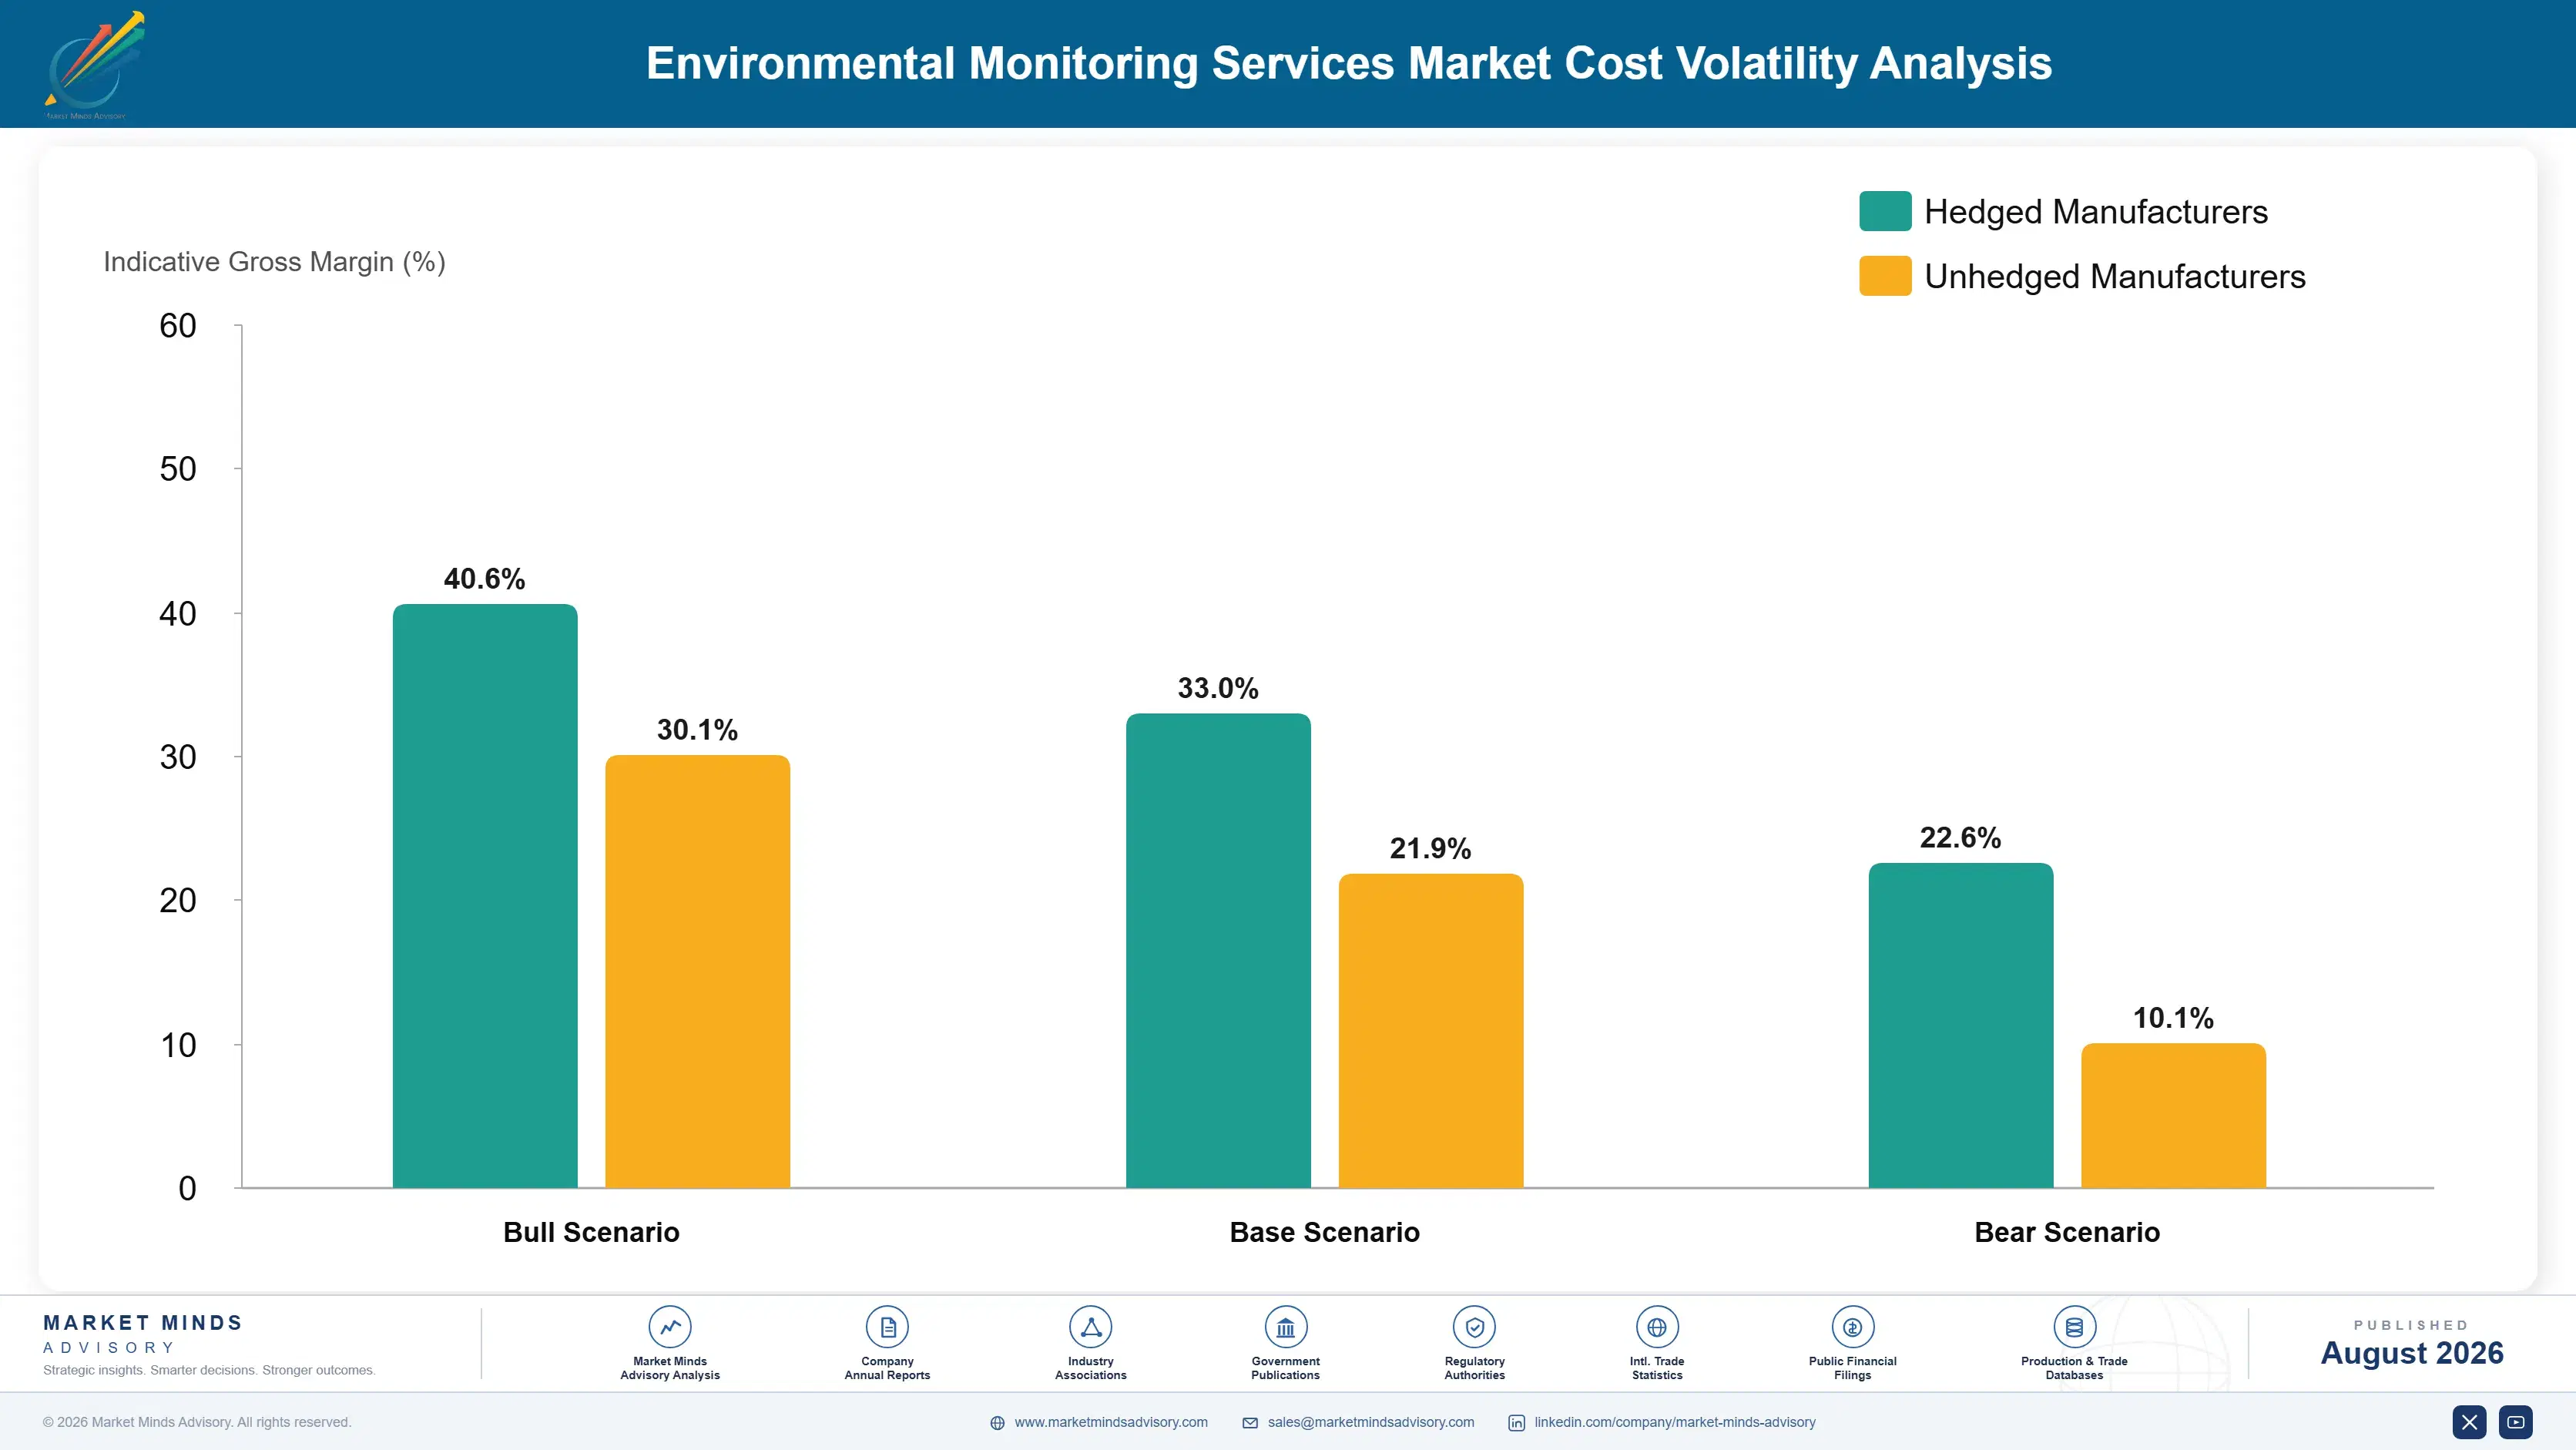
Service delivery cost divides between qualified technical labour at roughly 54%, laboratory instrumentation and consumables near 17%, field vehicles, sampling equipment, and travel around 12%, accreditation, proficiency testing, and quality systems about 9%, and data systems and overhead the balance. Labour dominates because accredited work requires named competent individuals whose qualification takes years and cannot be surged for a demand peak.
Technical labour costs rose sharply through 2022 and 2023 across most developed markets as analytical and field technician availability tightened, and several listed testing and inspection groups disclosed wage inflation and recruitment difficulty in filings covering those years. Instrumentation lead times extended over the same period. Neither could be passed through quickly, since framework agreements typically fix pricing for multi-year terms with limited indexation. Framework indexation is negotiated at renewal rather than mid-term.

The competitive disadvantage mechanism runs through accreditation scope rather than through operating efficiency. Instrumentation and consumables cost broadly the same for every provider, while a laboratory whose accreditation covers fewer analytes must subcontract work and carries the liability without the margin. Providers with narrow scope also lose scope expansion at their own clients, which is where the market's growth increasingly arrives.
environmental-monitoring-services-market-cost-volatility-analysis-1787302696675

Index framework pricing to published labour cost movement

Technical labour carries roughly 54% of delivery cost and rose sharply through 2022 and 2023 while framework agreements fixed pricing for multi-year terms. Indexation clauses referenced to published wage data shift that exposure to clients better able to absorb it. Clients resist indexation and accept it more readily at framework renewal than during a term, which is when

Build internal training pipelines rather than recruiting competitively

Accredited work requires named competent analysts and field technicians whose qualification takes years, and recruiting them from competitors simply moves the shortage around at rising cost. Internal training pipelines take longer to establish and produce capacity that competitors cannot bid away as easily. Providers that stopped training during the last downturn spent considerably more rebuilding capability afterwards.

Broaden accreditation scope ahead of client requirement

A laboratory whose accreditation covers fewer analytes subcontracts work and carries the liability without the margin, and it loses scope expansion at its own clients when emerging contaminant requirements arrive. Extending accreditation takes months of method validation and proficiency testing. Doing that ahead of permit changes that are already visible costs far less than reacting to them afterwards.

Portfolio Architecture for Margin Defence

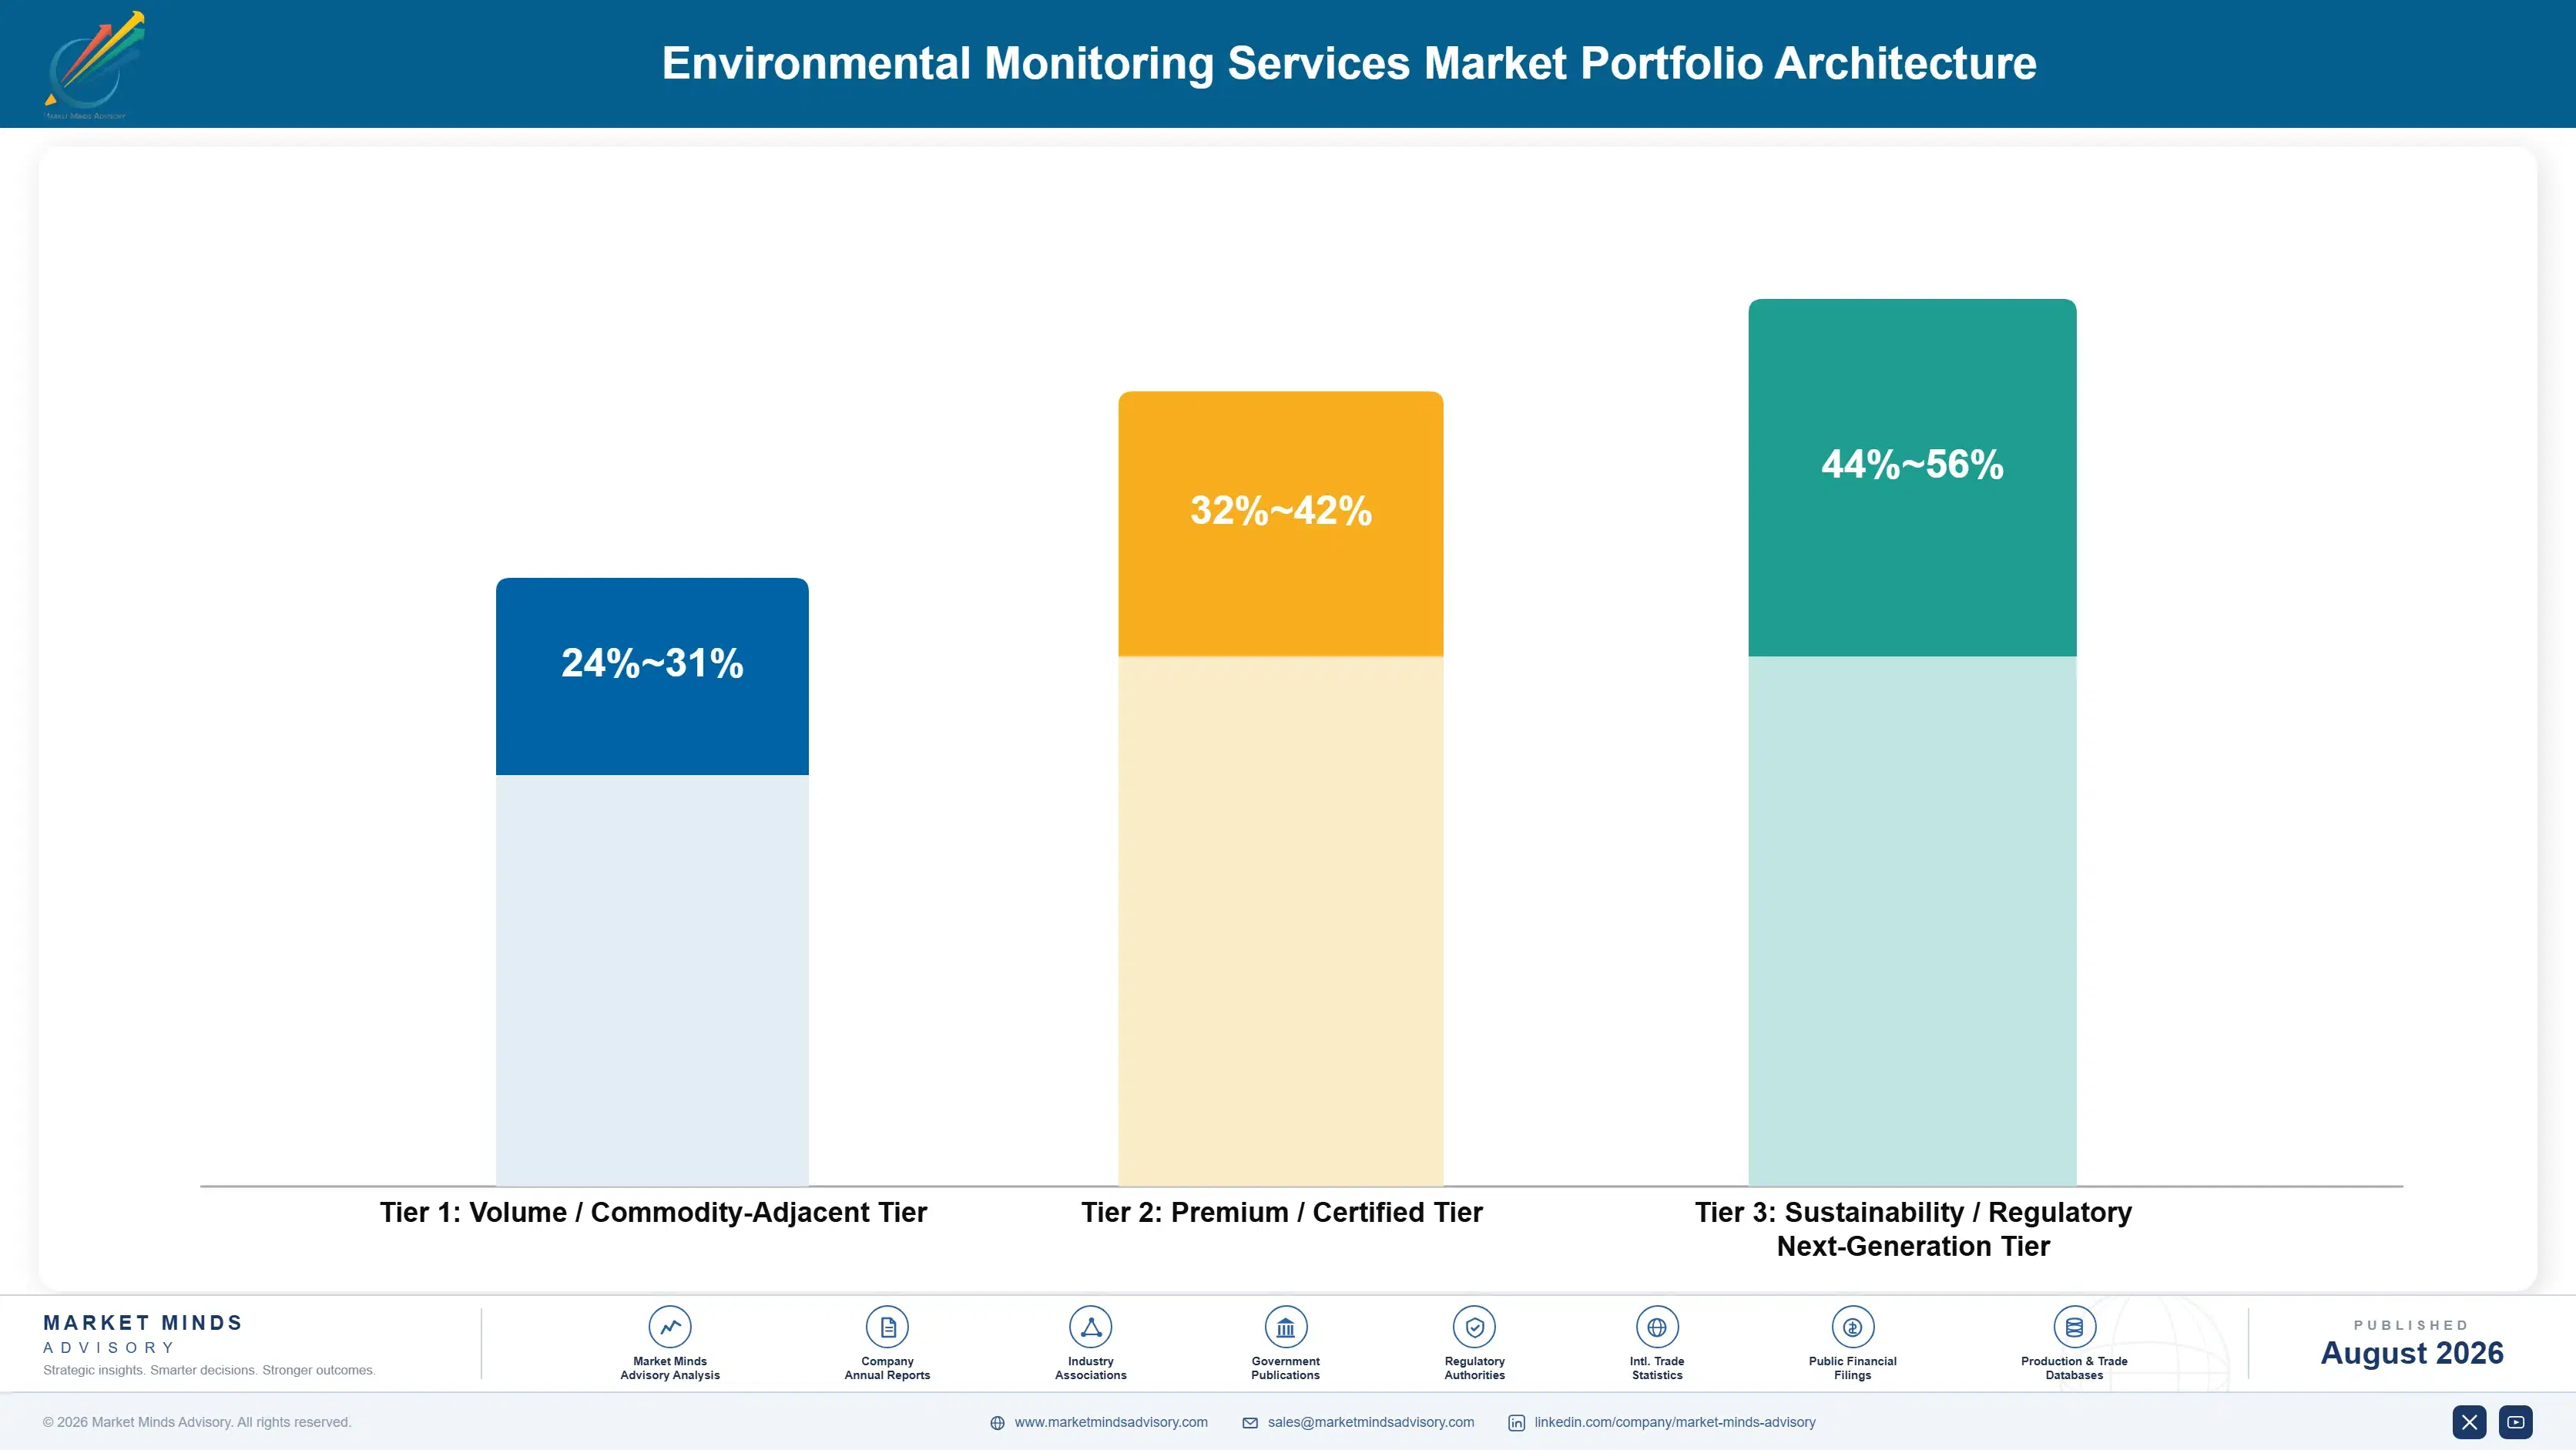
Three tiers describe this business and the spread follows defensibility requirement rather than revenue size. Routine compliance sampling and standard analysis sits at the bottom, where local providers compete on price inside holding time reach. Continuous monitoring and framework compliance programmes occupy the middle. Complex analytical work, expert testimony, and transaction-critical assessment sit at the top, where the client's legal or financial exposure is direct.
The tension is that routine sampling fills laboratory capacity and earns least while facing the most competition from local providers with lower cost bases. A provider weighted there is competing on price in the part of the market where scale confers nothing. One weighted toward complex analytical and transaction work holds margin on volumes too irregular to load a laboratory, and needs routine work

High-value pools concentrate where a client's own exposure is largest. Transaction-critical contaminated land assessment is the clearest case, since a deal worth hundreds of millions turns on a report costing a fraction of one percent of it, and nobody negotiates hard on that fraction. Expert testimony is the second such pool, where a named analyst defending a result years later is what the client is actually buying.

Volume / Commodity-Adjacent Tier

Routine compliance sampling and standard analytical work where local accredited providers compete on price inside holding time reach. Fills laboratory capacity and faces the most competition of anything in the portfolio.
Gross Margin: 24-31%

Premium / Certified Tier

Continuous monitoring contracts and multi-site compliance frameworks where retention runs high and revenue is contracted for years. Instrument uptime obligations are onerous and the revenue is correspondingly predictable. Retention here is the highest anywhere.
Gross Margin: 32-42%

Sustainability / Regulatory / Next-Generation Tier

Emerging contaminant analysis, expert testimony, and transaction-critical land assessment where the client's legal or financial exposure is direct. Best margin available and the least price sensitivity anywhere in this market.
Gross Margin: 44-56%
environmental-monitoring-services-market-portfolio-architecture-1787302697267

Permits, Frameworks and Datasets

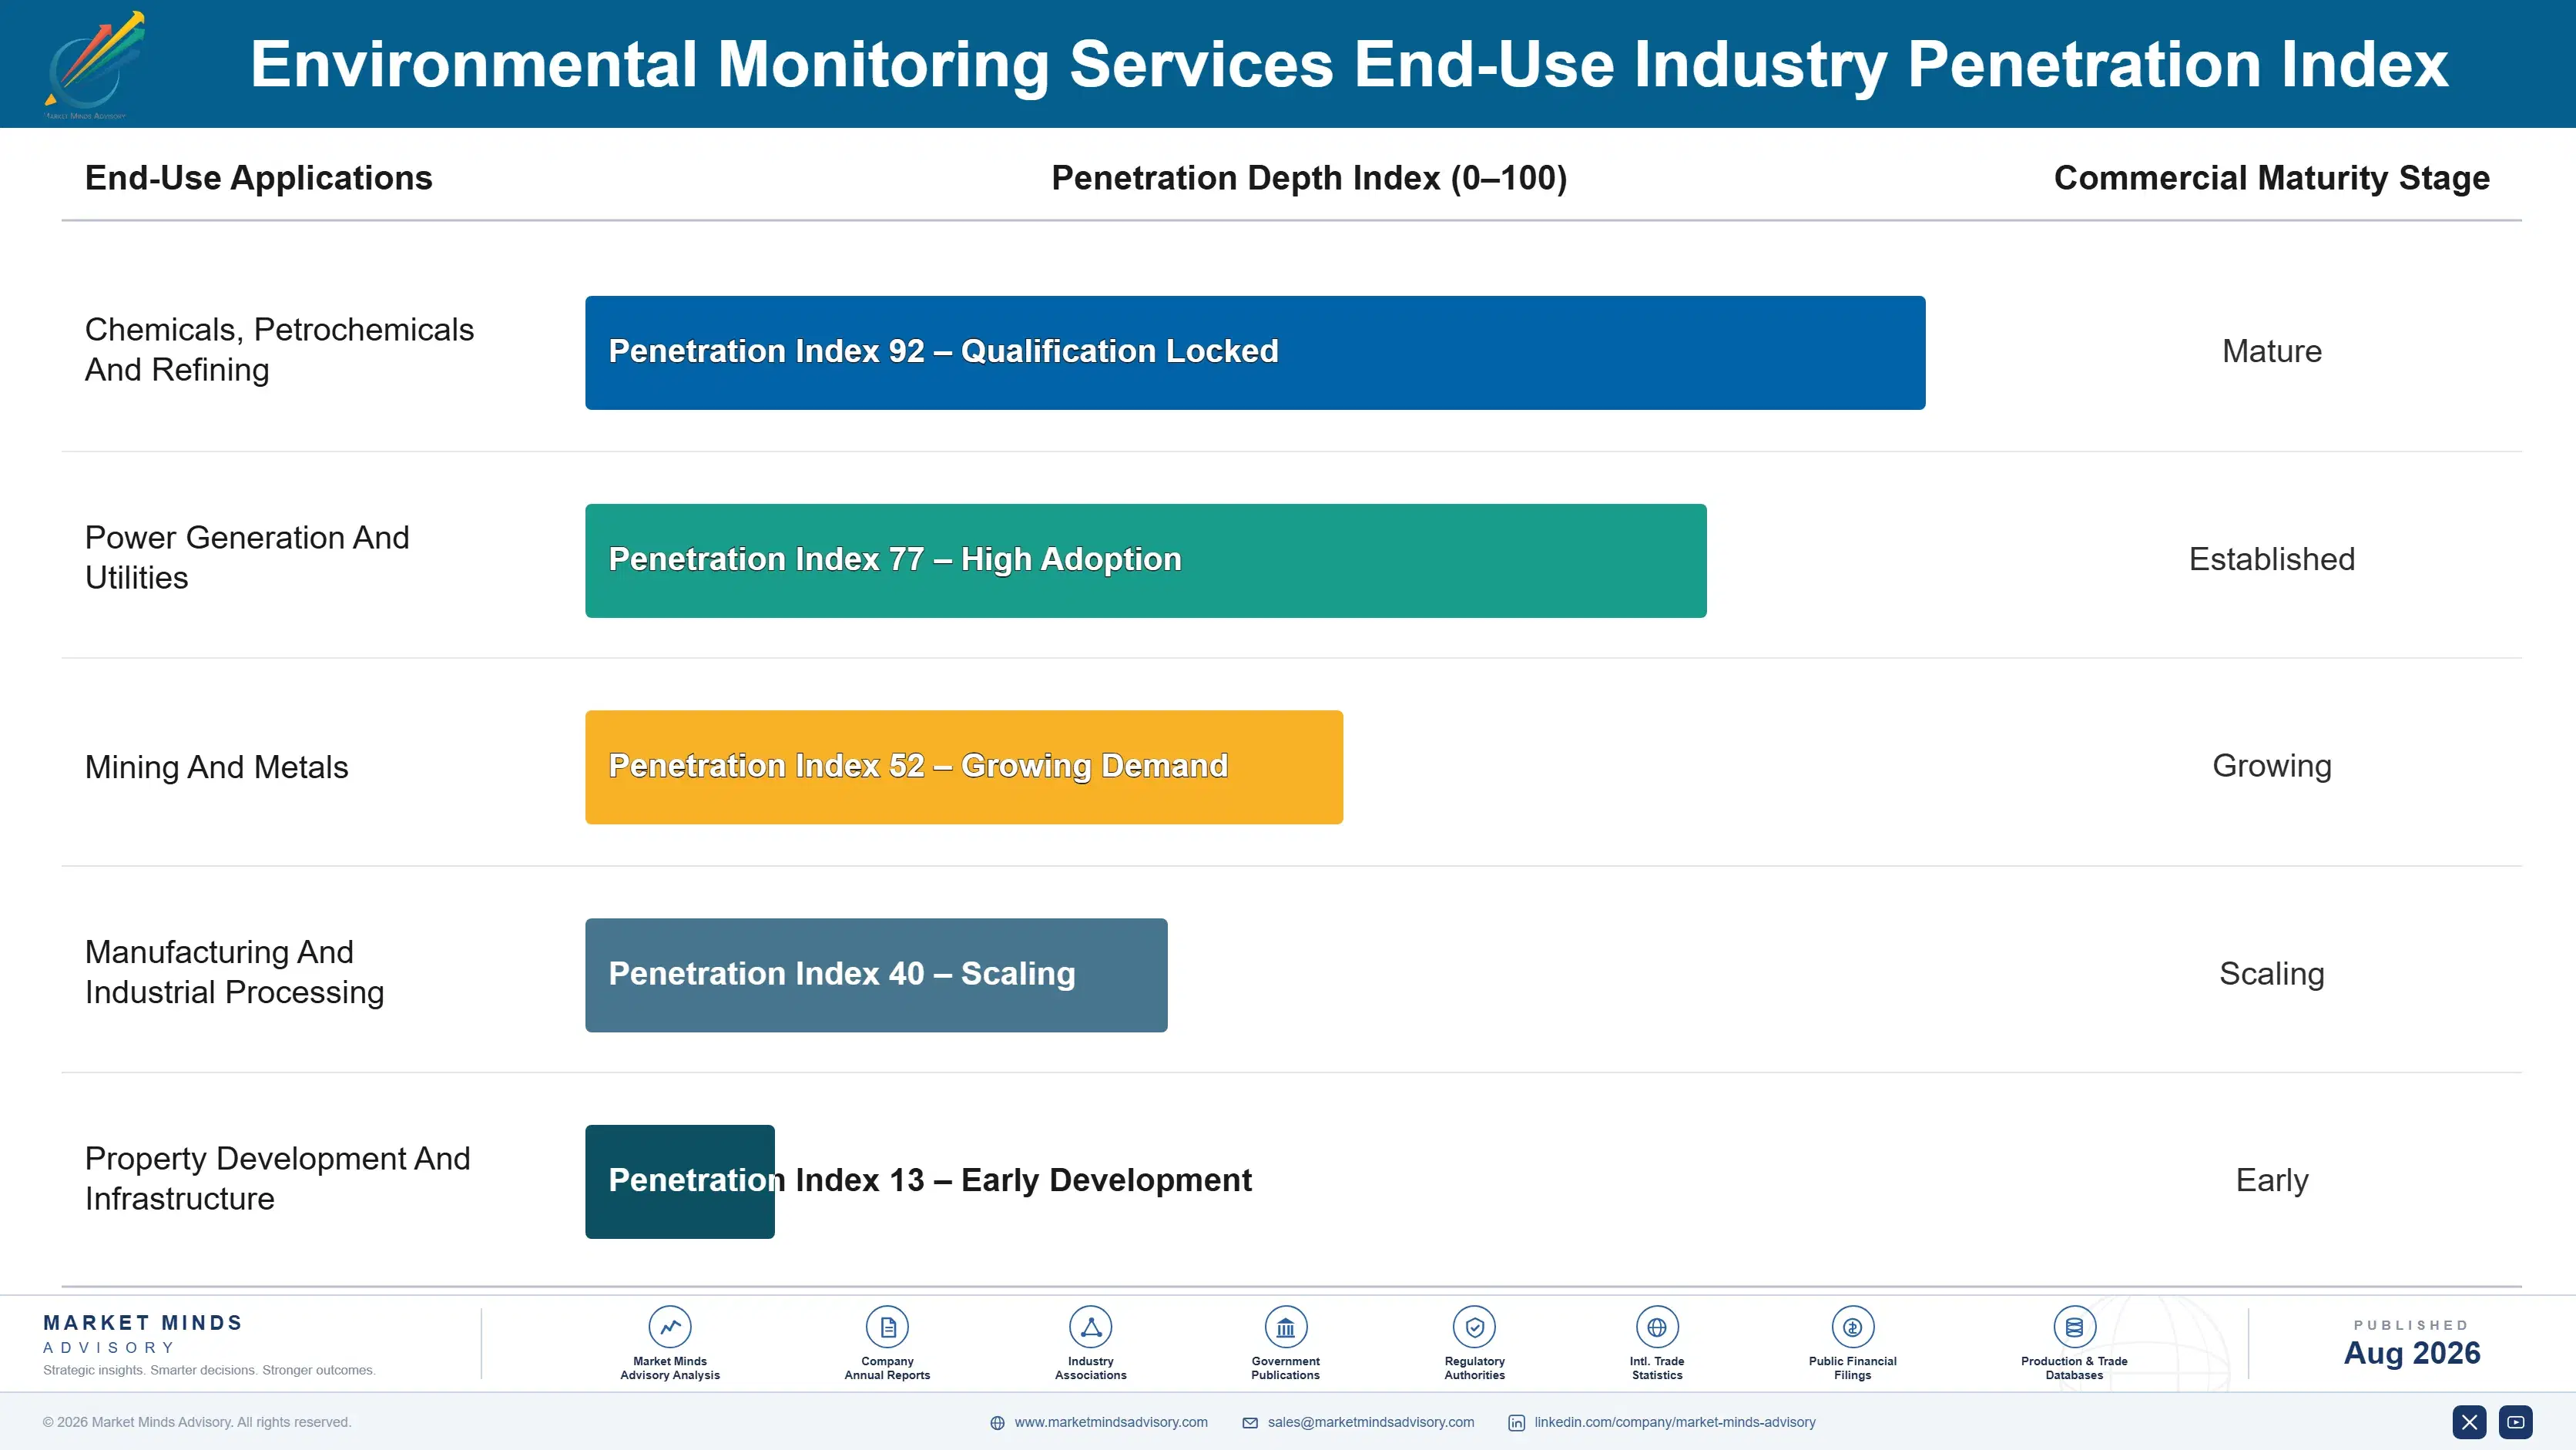
Revenue behaves as an annuity tied to permit conditions rather than to any purchasing cycle. A permitted site must monitor whether or not it is producing, whether or not budgets are tight, and whether or not anybody in procurement is paying attention, which makes compliance revenue among the most predictable in industrial services. Continuous instrument contracts extend that further by removing the visit from the equation entirely.
Stickiness runs through dataset continuity rather than through satisfaction. Frameworks retain at roughly 91% because changing provider creates a discontinuity that regulators and transaction counterparties later scrutinise, and no site manager wants to explain a methodology change in an enforcement hearing. Transaction-driven land assessment is the loosest, being project-based. Routine single-site sampling sits between the two and does move on price.

Buyer profiles shifted as continuous monitoring grew and emerging contaminants arrived. The earlier buyer was a site environmental manager arranging sampling visits against a permit schedule. The current conversation increasingly involves a corporate compliance function contracting multi-site frameworks, and a data or systems owner who cares about reporting integration considerably more than about the sampling itself. That shift has moved the conversation well up the organisation.
environmental-monitoring-services-market-end-use-penetration-index-1787302698144

What We Would Tell a Board

These are among the four positions where our research anticipates prominent divergence between winners and laggards over the coming forecast period. Each is grounded in the demand model, the regulatory perimeter, and the announced capacity pipeline.
01 / FRAMEWORK POSITION PRIORITY

Frameworks are the asset; jobs are not

Framework agreements retain at roughly 91% through competitive retender because changing provider creates a dataset discontinuity that regulators and transaction counterparties will later scrutinise closely. The first framework win is therefore worth many times its own first-year revenue, and pricing it as though it were a single-year job misprices the whole position badly. Providers bidding frameworks aggressively on cost while protecting margin on individual jobs have the commercial logic exactly inverted, and several of the largest ones do precisely that today.
02 / INSTRUMENT CONTRACT CONVERSION

The growth left field sampling some years ago

Continuous monitoring now carries around 27% of revenue and grows at 11.1% against 7.4% for the wider market, generating multi-year service and data assurance contracts rather than any repeat sampling visits. Installed instruments also proved entirely immune to the site access disruption that stopped field crews completely through 2020 and 2021, which reset how clients think about monitoring architecture. A provider built primarily around field sampling capacity is defending a delivery model whose share of this market falls every single year without any exception at all.
03 / ACCREDITATION SCOPE EXTENSION

Narrow scope loses growth at your own clients

Emerging contaminant requirements arrive as scope expansion at sites already under contract, and the detection limits involved exclude many regional laboratories from performing the work at all. A provider without the analytical capability subcontracts the work and carries the liability without any of the margin, and then watches the scope migrate away from it entirely. Extending accreditation scope ahead of permit changes that are already clearly visible costs far less than reacting after they land, when the client has already found somebody else.
04 / GEOGRAPHIC REACH BUILDING

Buy laboratories; accreditation cannot be hurried

Several regulated analytes must reach a laboratory within 48 hours of sampling, which makes physical presence a hard requirement rather than a convenience and explains roughly 9,400 accredited laboratories worldwide. Organic entry into a new jurisdiction means method validation and accreditation processes measured in years before any revenue whatever arrives from that jurisdiction. Acquiring an accredited regional laboratory buys the accreditation, the client relationships, and the qualified analysts together at commercial speed, which is the only route that moves fast enough.

Engagement Snapshot From the Field

A live engagement with an industry participant carrying material or product regulatory and market exposure ahead of a defining policy shift, showing how our research translates into a defensible multi-year portfolio strategy.
MARKET MINDS ADVISORY · CLIENT ENGAGEMENT SUMMARY
Environmental Monitoring Services Producer Strategic Portfolio Review and Transition Roadmap 2026·Investment Scenario on Environmental Monitoring Services Exposure Evaluation 2025-26
CLIENT PROFILE
A diversified industrial manufacturer with approximately 3.2 billion dollars in annual revenue (client-reported, unverified by MMA), operating twenty-eight permitted sites across four countries. Environmental monitoring was procured site by site with eleven different providers, no central data repository existed, and two sites had received regulator queries about dataset gaps in the preceding eighteen months. Procurement had flagged the fragmentation twice.
STRATEGIC CHALLENGE
Group leadership wanted to consolidate monitoring procurement without creating the dataset discontinuity that changing providers would cause, and needed to understand which sites could be moved safely and which had historical records too valuable to disturb at all. Nobody had assessed which datasets carried real regulatory weight. Procurement savings had been the only stated objective.
MMA APPROACH
We assessed each site's monitoring history for dataset continuity value and regulatory scrutiny exposure. Provider accreditation scope was mapped against current and anticipated permit conditions. Holding time constraints were tested for every analyte at every site, and framework consolidation options were modelled against transition risk. Transition windows were then mapped against permit renewal dates.
KEY FINDINGS
  1. Six sites held monitoring datasets with a decade or more of continuity under regulatory scrutiny, where changing provider carried real enforcement risk that no procurement saving would justify.
  2. Nine sites used providers whose accreditation scope did not cover emerging contaminants already appearing in comparable permits, creating a subcontracting exposure nobody had identified.
  3. Holding time constraints made four sites unservable by any provider outside their immediate region, which ruled out full consolidation regardless of commercial preference.
  4. The two regulator queries traced to gaps created when sites had changed providers previously, which had been recorded internally as administrative rather than as a warning.
CLIENT PROFILE
A diversified industrial manufacturer with approximately 3.2 billion dollars in annual revenue (client-reported, unverified by MMA), operating twenty-eight permitted sites across four countries. Environmental monitoring was procured site by site with eleven different providers, no central data repository existed, and two sites had received regulator queries about dataset gaps in the preceding eighteen months. Procurement had flagged the fragmentation twice.
STRATEGIC CHALLENGE
Group leadership wanted to consolidate monitoring procurement without creating the dataset discontinuity that changing providers would cause, and needed to understand which sites could be moved safely and which had historical records too valuable to disturb at all. Nobody had assessed which datasets carried real regulatory weight. Procurement savings had been the only stated objective.
MMA APPROACH
We assessed each site's monitoring history for dataset continuity value and regulatory scrutiny exposure. Provider accreditation scope was mapped against current and anticipated permit conditions. Holding time constraints were tested for every analyte at every site, and framework consolidation options were modelled against transition risk. Transition windows were then mapped against permit renewal dates.
KEY FINDINGS
  1. Six sites held monitoring datasets with a decade or more of continuity under regulatory scrutiny, where changing provider carried real enforcement risk that no procurement saving would justify.
  2. Nine sites used providers whose accreditation scope did not cover emerging contaminants already appearing in comparable permits, creating a subcontracting exposure nobody had identified.
  3. Holding time constraints made four sites unservable by any provider outside their immediate region, which ruled out full consolidation regardless of commercial preference.
  4. The two regulator queries traced to gaps created when sites had changed providers previously, which had been recorded internally as administrative rather than as a warning.
RECOMMENDED STRATEGY
Phase 1: Phase 1 (months one to nine): consolidate the nine scope-deficient sites onto a framework provider with adequate accreditation, transitioning during permit renewal windows. Phase 2: Phase 2 (months nine to twenty-four): build a central data repository capturing all sites regardless of provider, removing dataset risk from any future consolidation. Phase 3: Phase 3 (months twenty-four to forty-two): leave the six high-continuity sites with incumbents and revisit only once the repository holds complete records.
OUTCOME
Nine sites moved to a single framework within three quarters, reducing provider count from eleven to five. The central repository was commissioned, and the six high-continuity sites were formally excluded from consolidation on documented regulatory risk grounds (client-reported, unverified by MMA). Provider transitions were sequenced against permit renewal windows throughout.

Frequently Asked Questions

Foundational context covering the market sizes, CAGR, scope, country, region and competition that inform every finding below. This section is provided to cover basics and most often pre-purchase conversations, answered from the MMA Primary Research Dataset.

What is the current size of the Environmental Monitoring Services Market?

The market is valued at USD 14.5 billion in 2025, rising to USD 15.57 billion in 2026. Scope covers monitoring and compliance services, not monitoring instruments sold as equipment or remediation construction.

How large will the Environmental Monitoring Services Market be by 2036?

MMA forecasts USD 31.80 billion by 2036, an increase of USD 16.23 billion over the 2026 base. That represents an expansion multiple of 2.04 times across the forecast period.

What is the CAGR for the Environmental Monitoring Services Market 2026 to 2036?

The base case CAGR is 7.4%, with a bull case of 8.6% and a bear case of 6.2%. The historical rate from 2020 to 2025 was also 6.2%, depressed by site access restrictions.

Which segment is growing fastest?

Continuous emissions and ambient air monitoring at 11.1%, exactly 1.50 times the market rate. Permit conditions are moving from periodic sampling toward instruments that report without interruption.

Who are the major companies in the Environmental Monitoring Services Market?

SGS, Bureau Veritas, Eurofins Scientific, Intertek, and ALS Limited lead on environmental services revenue. The top five hold only 22%, because sample holding times keep laboratories regional.

Which country is growing fastest?

India at 10.2%, where enforcement capacity is building faster than industrial activity and continuous emissions monitoring is mandated at large permitted sites. Accredited laboratory capacity remains short in several states.

Report Segmentation Architecture

The full report scope spans multiple orthogonal segmentation dimensions, with cross-tabulated demand data provided for each dimension pair. Coverage extends further to regional breakdowns, trend trajectories, and the competitive detail needed to support segment-level decision-making.

By Environmental Medium And Discipline

  • Continuous Emissions And Ambient Air Monitoring
  • Water And Wastewater Compliance Testing
  • Contaminated Land And Groundwater Assessment
  • Laboratory Analytical Services
  • Noise, Vibration And Occupational Monitoring

By End-Use Industry

  • Chemicals, Petrochemicals And Refining
  • Power Generation And Utilities
  • Mining And Metals
  • Manufacturing And Industrial Processing
  • Property Development And Infrastructure

By Commercial Model

  • Multi-Site Compliance Framework Agreements
  • Continuous Monitoring Service Contracts
  • Project-Based Site Investigation Work
  • Laboratory Analysis On Submitted Samples
  • Expert Testimony And Regulatory Support

By Region

  • East Asia
  • North America
  • Western Europe
  • South Asia and Pacific
  • Latin America
  • Middle East and Africa
  • Eastern Europe

Scope, Methodology, and Coverage

Every figure in this report is reproducible from documented input assumptions. The scope below maps the historical period, the forecast horizon, the segmentation dimensions, and the countries covered, alongside the underlying primary and qualitative methodology.
Historical Period
2020 to 2025
Forecast Period
2026 to 2036
Base Year
2025 (USD billions; MMA Primary Research Dataset, August 2026)
Market Definition
This market comprises environmental monitoring, testing, and compliance services delivered to regulated industrial, utility, mining, and development sites, measured at provider revenue across framework, continuous service, project, laboratory analysis, and expert support channels. Coverage spans continuous emissions and ambient air monitoring including data management and assurance, water and wastewater compliance testing, contaminated land and groundwater assessment, laboratory analytical services performed on environmental samples, and noise, vibration and occupational exposure monitoring. Monitoring instruments, analysers and sensors sold as capital equipment, environmental engineering design, remediation construction and earthworks, waste collection, treatment and disposal services, environmental insurance and financial products, carbon accounting and sustainability reporting services, and general management system certification fall outside scope.
Quantitative Units
USD billions (current prices); accredited laboratory count; framework agreement value and term; continuous monitoring points under contract
Segmentation Dimensions
By Environmental Medium And Discipline; By End-Use Industry; By Commercial Model; By Region
Regions Covered
East Asia, North America, Western Europe, South Asia and Pacific, Latin America, Middle East and Africa, Eastern Europe
Countries Covered
China, Japan, South Korea, Taiwan, United States, Canada, Mexico, Germany, France, United Kingdom, Netherlands, Italy, Spain, India, Australia, Indonesia, Vietnam, Brazil, Chile, Peru, Saudi Arabia, United Arab Emirates, South Africa, Poland, Czechia, Romania, and additional markets relevant to this sector
Key Companies Profiled
SGS, Bureau Veritas, Eurofins Scientific, Intertek, ALS Limited, Tetra Tech, AECOM, Jacobs, Stantec, Arcadis, WSP Global, Ramboll, ERM, Element Materials Technology, Pace Analytical Services, Montrose Environmental Group, TUV SUD, DEKRA, Applus, Enthalpy Analytical
Quantitative Methodology
Primary survey, n=3,800 respondents, Q4 2025, six countries; demand-side model with trade association cross-validation
Qualitative Methodology
47 expert interviews, Q4 2025; applied to validate demand model assumptions, identify emerging dynamics, and assess competitive positioning
Report Format
PDF and XLSX data workbook (Word format preview document)
Publisher
Market Minds Advisory
Report Code
MMA-2026-TEC-812
Published
August 2026
Contact
sales@marketmindsadvisory.com | www.marketmindsadvisory.com

Purchase the full Environmental Monitoring Services Market Report (2026 to 2036).

The full report sizes environmental monitoring services across five disciplines, five client industries, five commercial models, and seven regions, with holding time constraints mapped against laboratory geography throughout. Framework retention and dataset continuity value are assessed as the primary switching barrier, since they explain incumbency more convincingly than any pricing analysis does. Accreditation scope is compared against anticipated permit conditions by jurisdiction. Competitive profiling covers twenty providers on environmental services revenue, and continuous monitoring capability is assessed separately from field sampling capacity. Regional demand is built from permit populations rather than from industrial output measures.
Holding time constraints mapped against accredited laboratory geography
Framework retention and dataset continuity assessed as switching barriers
Accreditation scope compared against anticipated permit conditions by jurisdiction
Continuous monitoring capability assessed separately from field sampling capacity
Emerging contaminant analytical requirements mapped by region and regime
Technical labour availability modelled against delivery capacity constraints

Built For The People Who Decide

From boardroom strategy to bench-side execution, this report is read cover-to-cover by leaders shaping the next decade of their industry, turning demand scenarios, market dynamics and valuation benchmarks into decisions.
CXOs/ Presidents/ VPs/ Managers
M&A and Corporate Development
Strategy Teams and R&D Heads
Procurement and Product Directors
Regulatory and Compliance Leaders
Investor Relations and Equity Analysts