Market Minds Advisory
Electric Kick Scooter Market

Electric Kick Scooter Market: Electric Kick Scooter Market: Range Economics, Fleet Durability and the Municipal Permit Question

Buyers are paying for range rather than price, fleet hardware now survives two years where it once lasted three months, and city permit decisions still determine whether whole markets exist at all.

Lead Analyst

David Horsley

Published

August 2026

Make Smarter Decisions with Customized Research Insights

Request a free sample report and evaluate market opportunities, growth trends, and competitive dynamics relevant to your business needs.

2025 MARKET VALUE$5.4BMarket Size 2025
2036 FORECAST VALUE$13.4BBase Case , 2026 to 2036
CAGR 2026 TO 20368.6 %Bull 9.8% / Bear 7.4%
INCREMENTAL OPPORTUNITY$7.5BNet 10- year value creation
EXPANSION MULTIPLE2.28x2036 value over 2026 base
Strategic Levers
M&A Pipeline
Regional Outlook
Country Rankings
Competitive Intelligence
Segmental Deep-dive
Call-Us : 91 93563 13602

Executive Snapshot and Market Trajectory.

The industry that nearly killed itself with disposable hardware has quietly become an engineering business. Early shared scooters lasted about three months in service. Current fleet-grade vehicles run two years, and that single change is what made shared operations viable and what reshaped the whole product hierarchy.
Long-range commuter scooters grow at 12.9%, a full 1.50 times the market rate, because private buyers have stopped shopping on price and started shopping on range, and a 40 kilometre pack costs a great deal more to build than a 20 kilometre one. East Asia holds 34% of global value, above the standard band, because roughly 78% of world units are assembled in China and domestic demand there is substantial in its own right.
Concentration sits at 41% for the top five, and that figure badly understates how concentrated the actual manufacturing base is. A great many Western brands are simply designs commissioned from a small number of Chinese producers, which means the badge printed on the deck says far less about who actually built the vehicle than buyers generally assume. Manufacturing capability and brand ownership have separated almost entirely in this category.
Market Definition
This report covers standing electric kick scooters with a folding or fixed deck and handlebar steering, sold into private ownership and shared operator fleets across consumer, commuter and light utility applications. Electric mopeds, seated electric two-wheelers requiring registration, electric bicycles, hoverboards, self-balancing devices, mobility scooters and shared fleet operating service revenue are excluded from the sizing.
Base Year Value
$5.4B in 2025 (MMA Primary Research Dataset, August 2026)
Forecast Period
2026 to 2036, eleven discrete annual values
CAGR
8.6% base case. Bull 9.8%. Bear 7.4%.
Fastest Growth Segment
Long-Range Commuter Scooter: 12.9% CAGR
Fastest Growth Country
India: 11.2% CAGR
Fastest Growth Region
South Asia and Pacific: 10.8% CAGR
Largest Region
East Asia: 34% of 2025 global value
Market Leaders
Segway-Ninebot, Xiaomi, NIU Technologies, Okai Vehicle and Yadea Technology Group lead on unit shipment volume. Source: MMA Analysis, July 2026.
Primary Survey
n=3,800 procurement and R&D decision-makers, Q4 2025, six countries
Methodology
Demand-side build-up, cross-validated against public data, 47 expert interviews

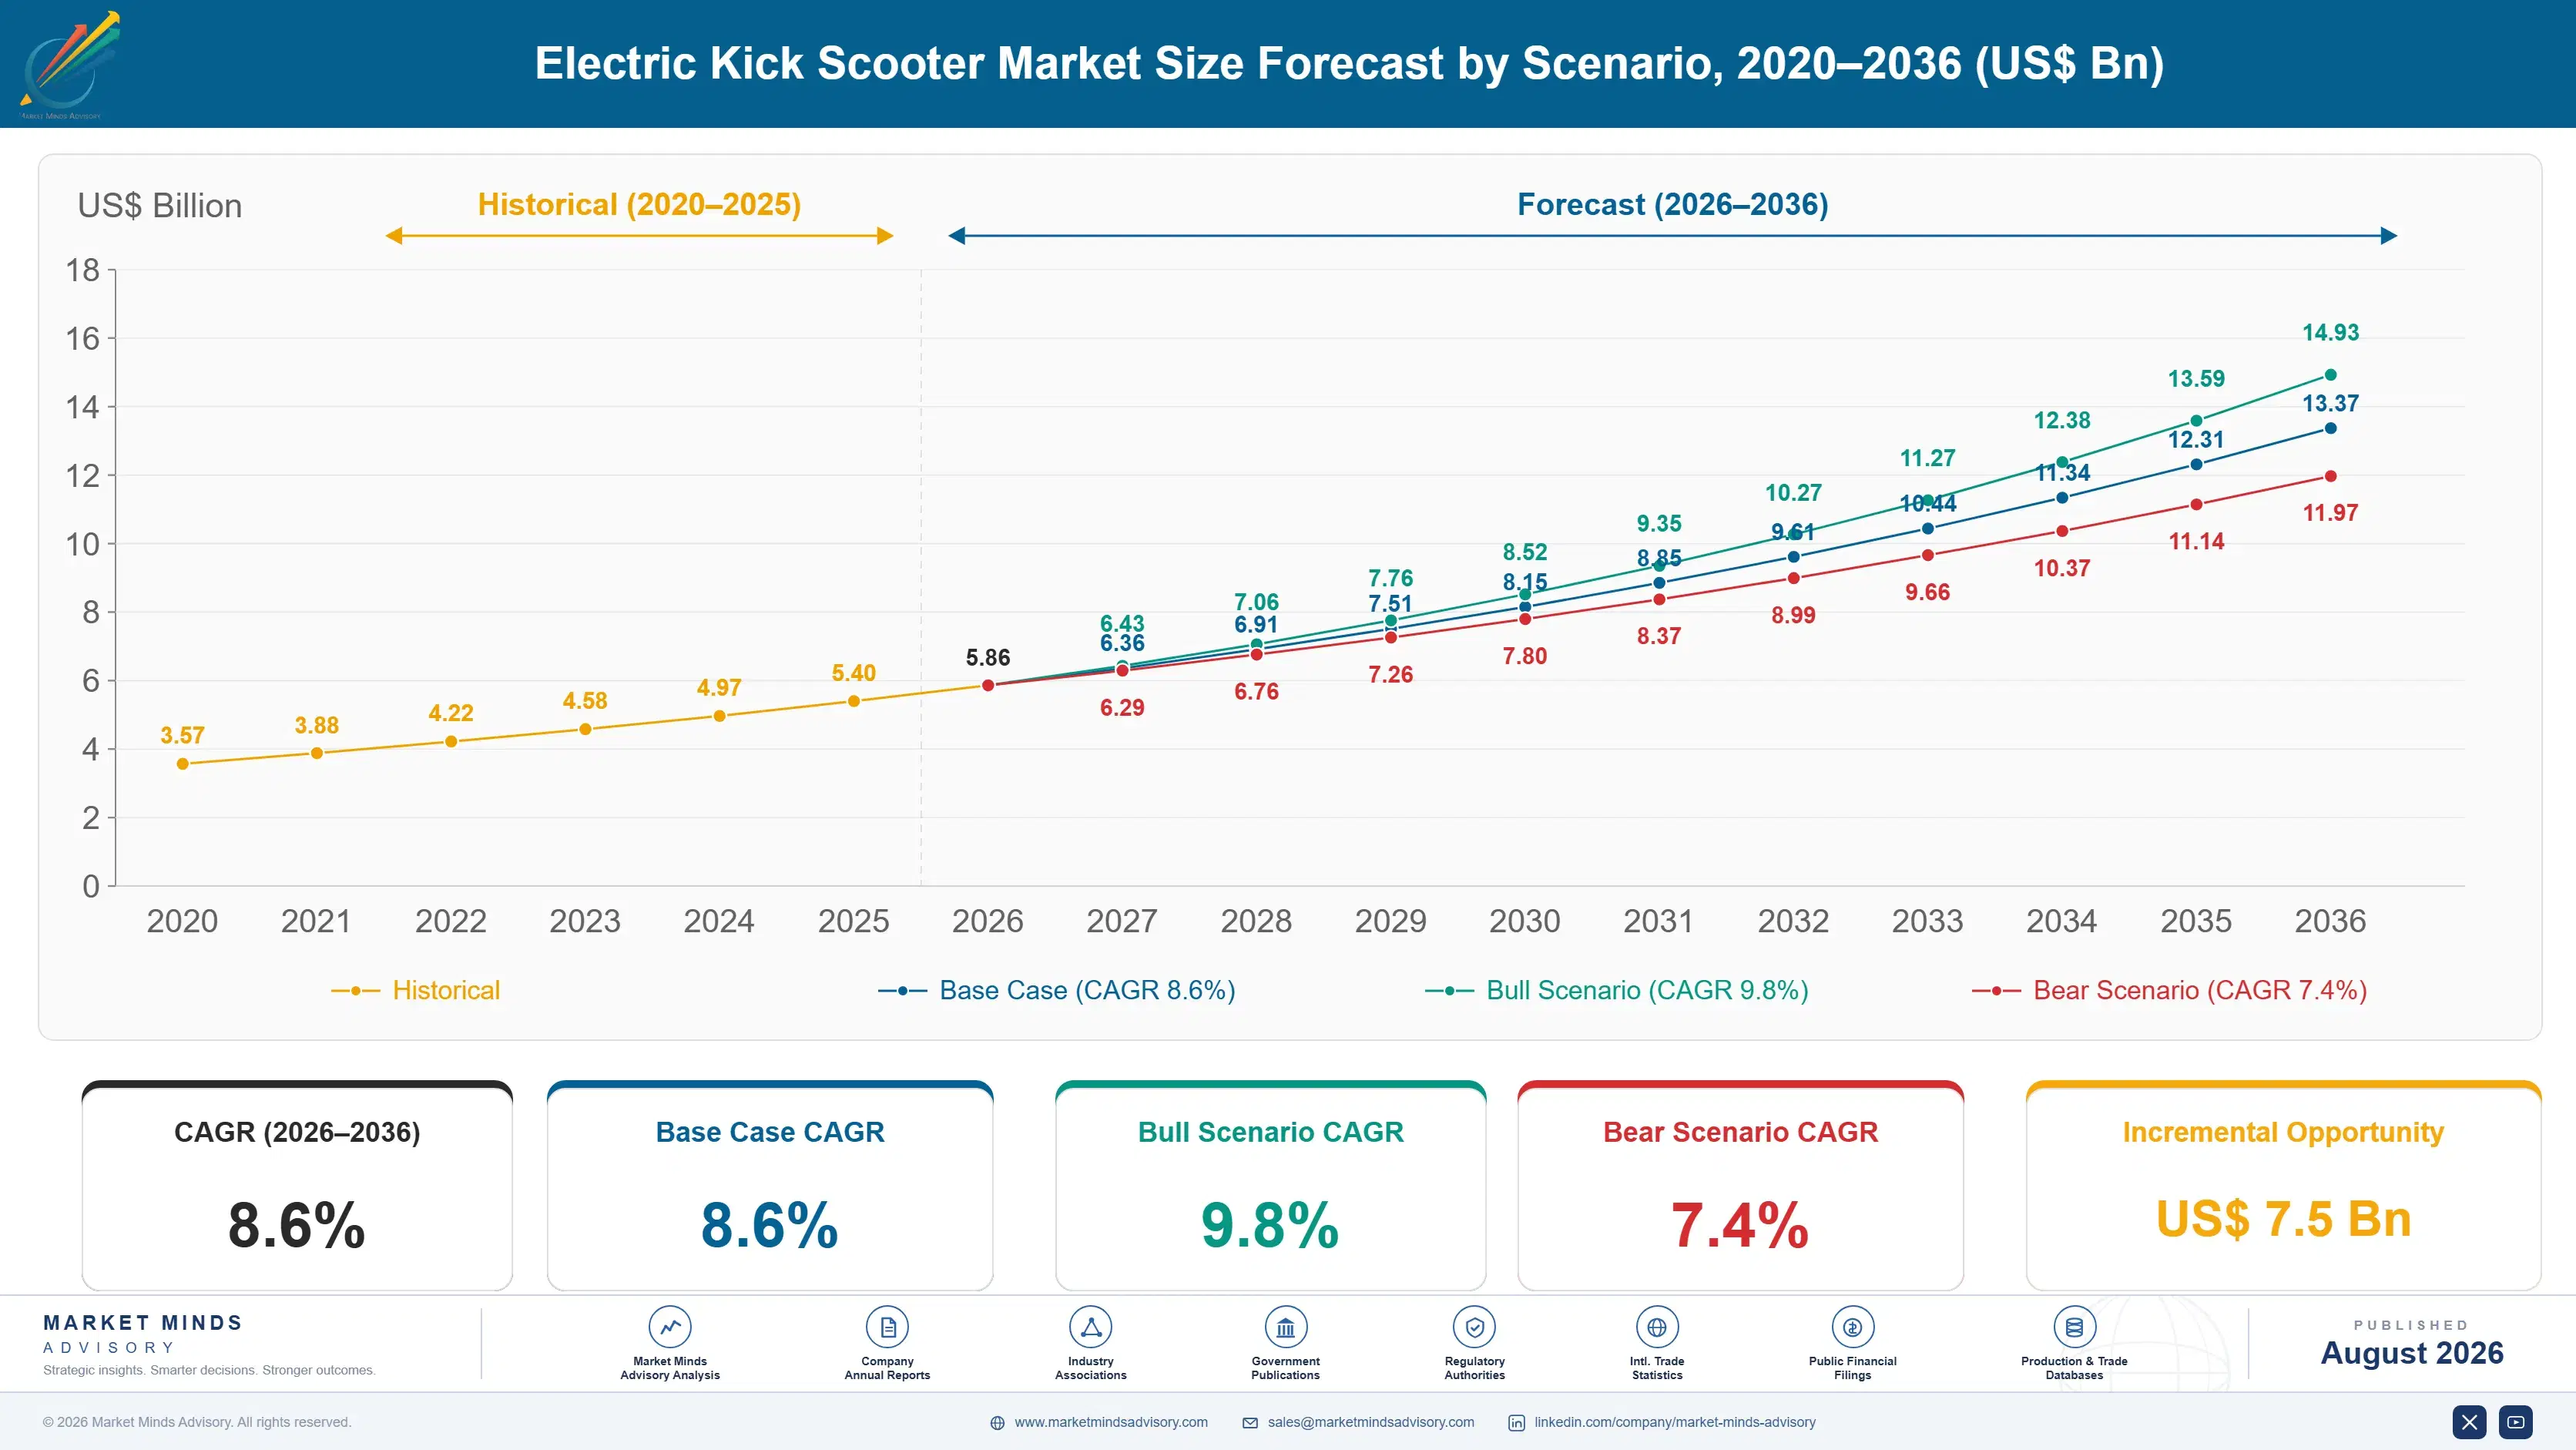
Electric Kick Scooter Market Forecast Scenarios

electric-kick-scooter-market-size-forecast-scenario-1787315831749
Between 2020 and 2025 the market compounded at 7.2%, and the number conceals two opposite movements. Shared fleet purchasing collapsed as operators consolidated, several went bankrupt and Paris voted its scooters off the streets entirely. Private ownership grew straight through all of it, and the average unit sold got considerably more expensive as buyers traded up for range, build quality and battery safety certification.
The base case at 8.6% rests on three mechanisms. Private purchase keeps shifting toward long-range product carrying larger packs, which lifts realised value per unit well ahead of volume. Shared fleets are rebuilding on hardware that now lasts two years rather than three months, making replacement demand predictable rather than frantic. Emerging market adoption, particularly across India and Southeast Asia, adds genuine unit growth where short trips are currently served by auto-rickshaws and motorcycles.
The bull case at 9.8% turns on European and North American cities converting more road space to micromobility infrastructure, which historically produces step changes in both shared and private demand. The bear case at 7.4% is a repeat of the Paris outcome across several major cities: permit revocation removes fleet demand overnight and, more damagingly, tells private buyers the category is unwelcome.

What Actually Determines Scooter Value

The defining event in this industry was not a product launch. It was the realisation around 2019 that shared scooters were lasting roughly three months in service, which meant every vehicle was destroyed long before it repaid its purchase price. The entire business model was a subsidy machine dressed up as a transport service.
TOP FIVE CONCENTRATION41%Share held by the five largest global scooter manufacturers
AVERAGE RETAIL PRICE$540Typical consumer transaction price for a commuter model
SHARED FLEET SHARE26%Portion of unit volume supplied into shared operator fleets
BATTERY COST SHARE31% of COGSCell pack content as portion of manufactured unit cost
FLEET VEHICLE LIFESPAN24 monthsTypical service life before a shared unit retires
CHINA PRODUCTION SHARE78%Portion of world units assembled in a single country
What followed was proper engineering. Cast aluminium frames replaced folding consumer chassis, swappable batteries removed the need to collect vehicles for charging, wheels grew, bearings got sealed and fasteners stopped vibrating loose. Fleet vehicle life now runs around 24 months, which changes unit economics from impossible to merely difficult, and it made the fleet-grade product a genuinely distinct category rather than a consumer scooter painted a different colour.
Private demand moved in parallel but for its own reasons. Buyers who once shopped on price now shop on range, and a scooter carrying 40 kilometres of usable battery sells for roughly double an entry-level unit on a frame that costs only modestly more. Battery safety certification has become a real purchase criterion too, after battery fires prompted retailer delisting and building management bans across several major cities.
"The Paris referendum is the most important data point in this industry and most participants still discuss it as bad luck. It was a verdict on how operators behaved in a city for five years, and the ones who learned from it are the ones still holding permits."
Practice Director, Mobility and Specialty Vehicles, Market Minds Advisory · MMA

Market Trends

Swappable Battery Architecture Reshapes Fleet Operating Economics

Removable battery packs let field crews swap a depleted unit in under a minute rather than collecting the vehicle, trucking it to a warehouse and returning it the following day. That single change cuts fleet operating cost by roughly 30% and keeps vehicles earning instead of sitting in vans. It also extends vehicle life, since handling damage during collection and transport was a significant failure source across every early fleet. Consumer product is following the same direction more slowly, driven mainly by apartment dwellers who have nowhere to charge a whole scooter indoors.
Market Impact: Adds 2,400 lane kilometres
Battery Safety Certification Becomes A Purchase Criterion

Underwriters Laboratories certification and comparable standards have moved from technical formality to genuine buying decision after lithium fires prompted retailer delisting, building management bans and municipal restrictions across several major cities. Certification adds cost through cell selection, pack construction and testing, and it eliminates the cheapest imported product from formal retail entirely. Roughly 60% of units sold through major Western retailers now carry certification, against a far lower share only five years ago. The compliance burden favours established manufacturers over opportunistic importers considerably, and that gap is widening every year.
Market Impact: Targets 50% of urban trips

Market Opportunities and Growth Drivers

Urban Low Emission Policy Converts Road Space To Micromobility

European and increasingly North American cities are reallocating road space toward protected lanes, and every kilometre built removes a genuine and measurable barrier to adoption. Low emission zone charging in London, Milan and a growing list of others makes short car trips expensive enough that substitution becomes rational rather than merely virtuous. The commercial effect is measurable: cities adding protected infrastructure consistently show private scooter sales growth well above their national averages. Municipal policy is therefore the demand mechanism here, which makes it both unusually powerful and entirely reversible without warning.
Market Impact: Removed 15,000 fleet units

Short Trip Substitution Addresses A Very Large Journey Pool

Roughly half of all urban car journeys in developed markets cover under five kilometres, which is precisely the distance a scooter handles well and a car handles badly. That pool is enormous relative to current adoption, and the substitution argument works on cost and parking convenience rather than on environmental sentiment, which makes it durable through economic cycles. Emerging markets present the same arithmetic against auto-rickshaws and motorcycles instead of cars, at price points where the saving matters considerably more to the buyer than it ever does in a wealthy market.
Market Impact: Holds margins near 12%

Market Restraints and Challenges

Municipal Permit Decisions Can Remove Markets Overnight

The 2023 Paris referendum ended shared scooter operations in one of Europe's largest markets with no commercial appeal available. The root cause was accumulated public irritation over pavement clutter, riding behaviour and injury reporting, none of which operators addressed convincingly while growth was easy. Commercially the damage runs beyond lost fleet revenue, because a public rejection of that kind tells private buyers the whole category is unwelcome. Participants are responding with parking infrastructure investment, geofenced speed control, mandatory parking photography and considerably more disciplined municipal engagement than anything the early years featured.
Market Impact: Cuts fleet operating cost 30%

Commodity Import Competition Compresses Entry-Level Pricing

Chinese manufacturers supply finished scooters at delivered costs that no Western assembler approaches, often as unbranded product that becomes whatever name the importer prints on the deck. The root cause is genuine scale: cells, motors and controllers all come from the same domestic supply base serving electric vehicle manufacturing. Commercially this holds entry-level margins in the low teens and makes brand building expensive. Participants are responding by moving mix toward long-range and certified product, by building service networks, and by competing on warranty and parts support that badge importers cannot credibly match.
Market Impact: Covers 60% of retail units
4 additional market trends, 3 additional growth drivers, and 2 additional restraints and challenges are covered in the full report. Contact sales@marketmindsadvisory.com to access the complete intelligence.

Segment CAGR and Growth Architecture

Segmentation follows scooter product class, because range, frame construction and duty rating together determine manufacturing cost, realised price, the buyer being served and the distribution channel that reaches them. Battery chemistry, feature content, warranty scope and brand positioning all sit downstream of that class decision, and every one of them is priced directly against it.
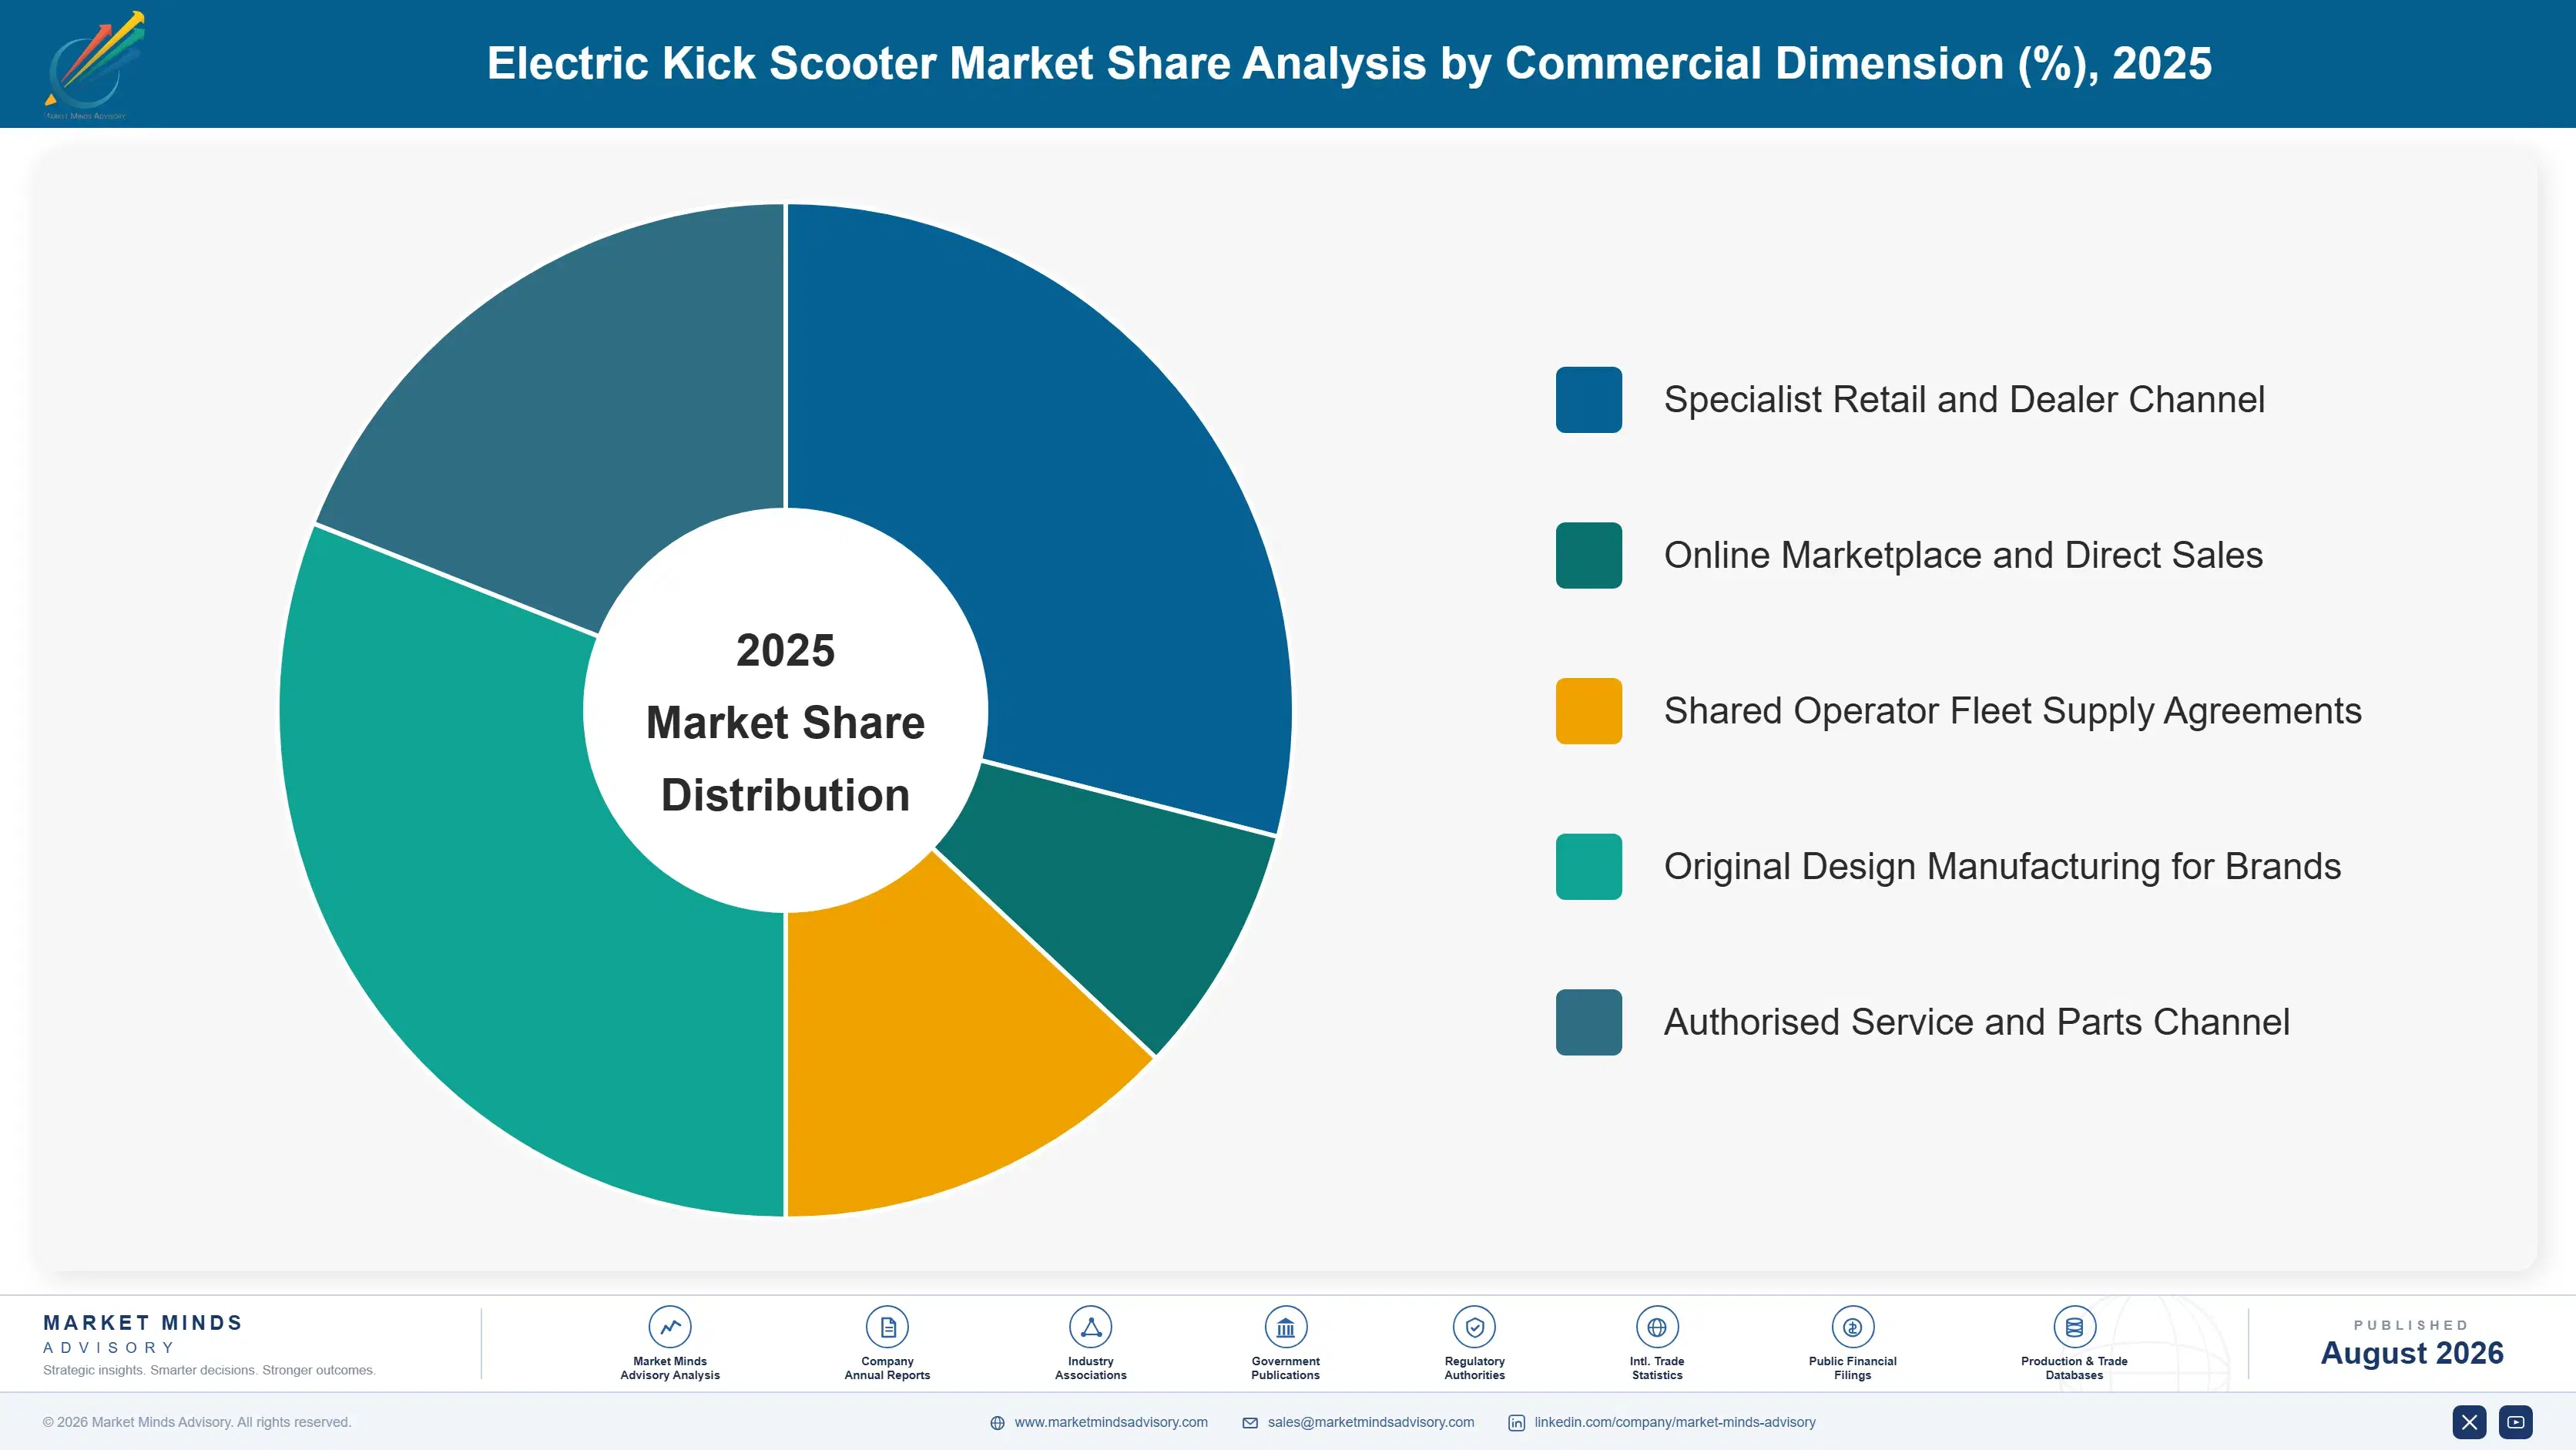
electric-kick-scooter-market-market-share-analysis-1787315832317

Long-Range Commuter Scooter

The fastest segment at 12.9%, a full 1.50 times the market rate, covering privately owned scooters with battery capacity delivering 40 kilometres or more of real range, usually on larger wheels with suspension and hydraulic braking. Range anxiety is what created the segment. A buyer who has run out of charge two kilometres from home once will pay for capacity, and the pack is the expensive part, so a long-range model retails at roughly double an entry-level unit on a frame that costs only modestly more to build. North American suburban trip distances suit the format particularly well. What limits growth is weight, since a large pack makes a scooter genuinely difficult to carry up stairs or onto a train.
CAGR 12.9%

Fleet-Grade Shared Service Scooter

Growing at 10.0% on vehicles engineered specifically for shared operator duty, meaning cast frames, sealed bearings, swappable batteries, larger wheels and fastener designs that survive constant vibration and casual abuse. Fleet economics forced this segment into existence. Early shared scooters were consumer products that lasted roughly three months in service, which meant every vehicle was destroyed long before repaying its purchase price. Current fleet-grade hardware runs around 24 months, which changes the arithmetic entirely. The buyer is a professional procurement function rather than a consumer, and it negotiates on total cost per ride, warranty terms and parts availability rather than on headline specification, styling or brand recognition of any kind.
CAGR 10.0%
Full segment breakdown across 5 segments available in the complete report.

Regional Architecture and Country Demand Map

East Asia holds 34% of global value on Chinese manufacturing concentration and its own substantial domestic demand together. Western Europe follows closely on shared fleet depth and private commuting adoption together, while growth runs fastest across South Asia and Pacific, where short-trip substitution economics work hardest.

East Asia

Note: East Asia holds 34% against a 22 to 30% band because roughly 78% of world units are assembled in China and the region carries substantial domestic demand alongside that manufacturing. Segway-Ninebot, Xiaomi and Yadea between them supply a large share of every brand sold anywhere, including many that carry Western names on the deck. Domestic Chinese demand is driven by short-trip commuting in second and third tier cities where car ownership costs remain prohibitive. Japan legalised specified small motorised vehicles in 2023, opening a market that had effectively been closed, and South Korean shared fleets have stabilised after early regulatory turbulence. Manufacturing and demand reinforce each other here in a way no other region matches.
Share: 34% | CAGR: 9.8% (2026 to 2036)

Western Europe

Europe is where shared micromobility grew up and where it got its hardest lessons. City permit regimes across Paris, Madrid, Berlin and Copenhagen now define operating conditions tightly, and the 2023 Paris referendum that ended shared scooter operations there reshaped how every operator approaches municipal relations. Private ownership has grown steadily through that turbulence, particularly in Germany and Italy where commuting distances suit the format. Type approval requirements under national road traffic rules push specification toward lighting, indicators and speed limitation that entry-level product does not carry. Battery safety certification has become a genuine purchase criterion rather than a technicality. Permit stability now varies enormously between one city and the next.
Share: 24% | CAGR: 7.1% (2026 to 2036)
Regional intelligence for 5 additional markets available in the complete report: North America, South Asia and Pacific, Latin America, Middle East and Africa, Eastern Europe. Contact sales@marketmindsadvisory.com.
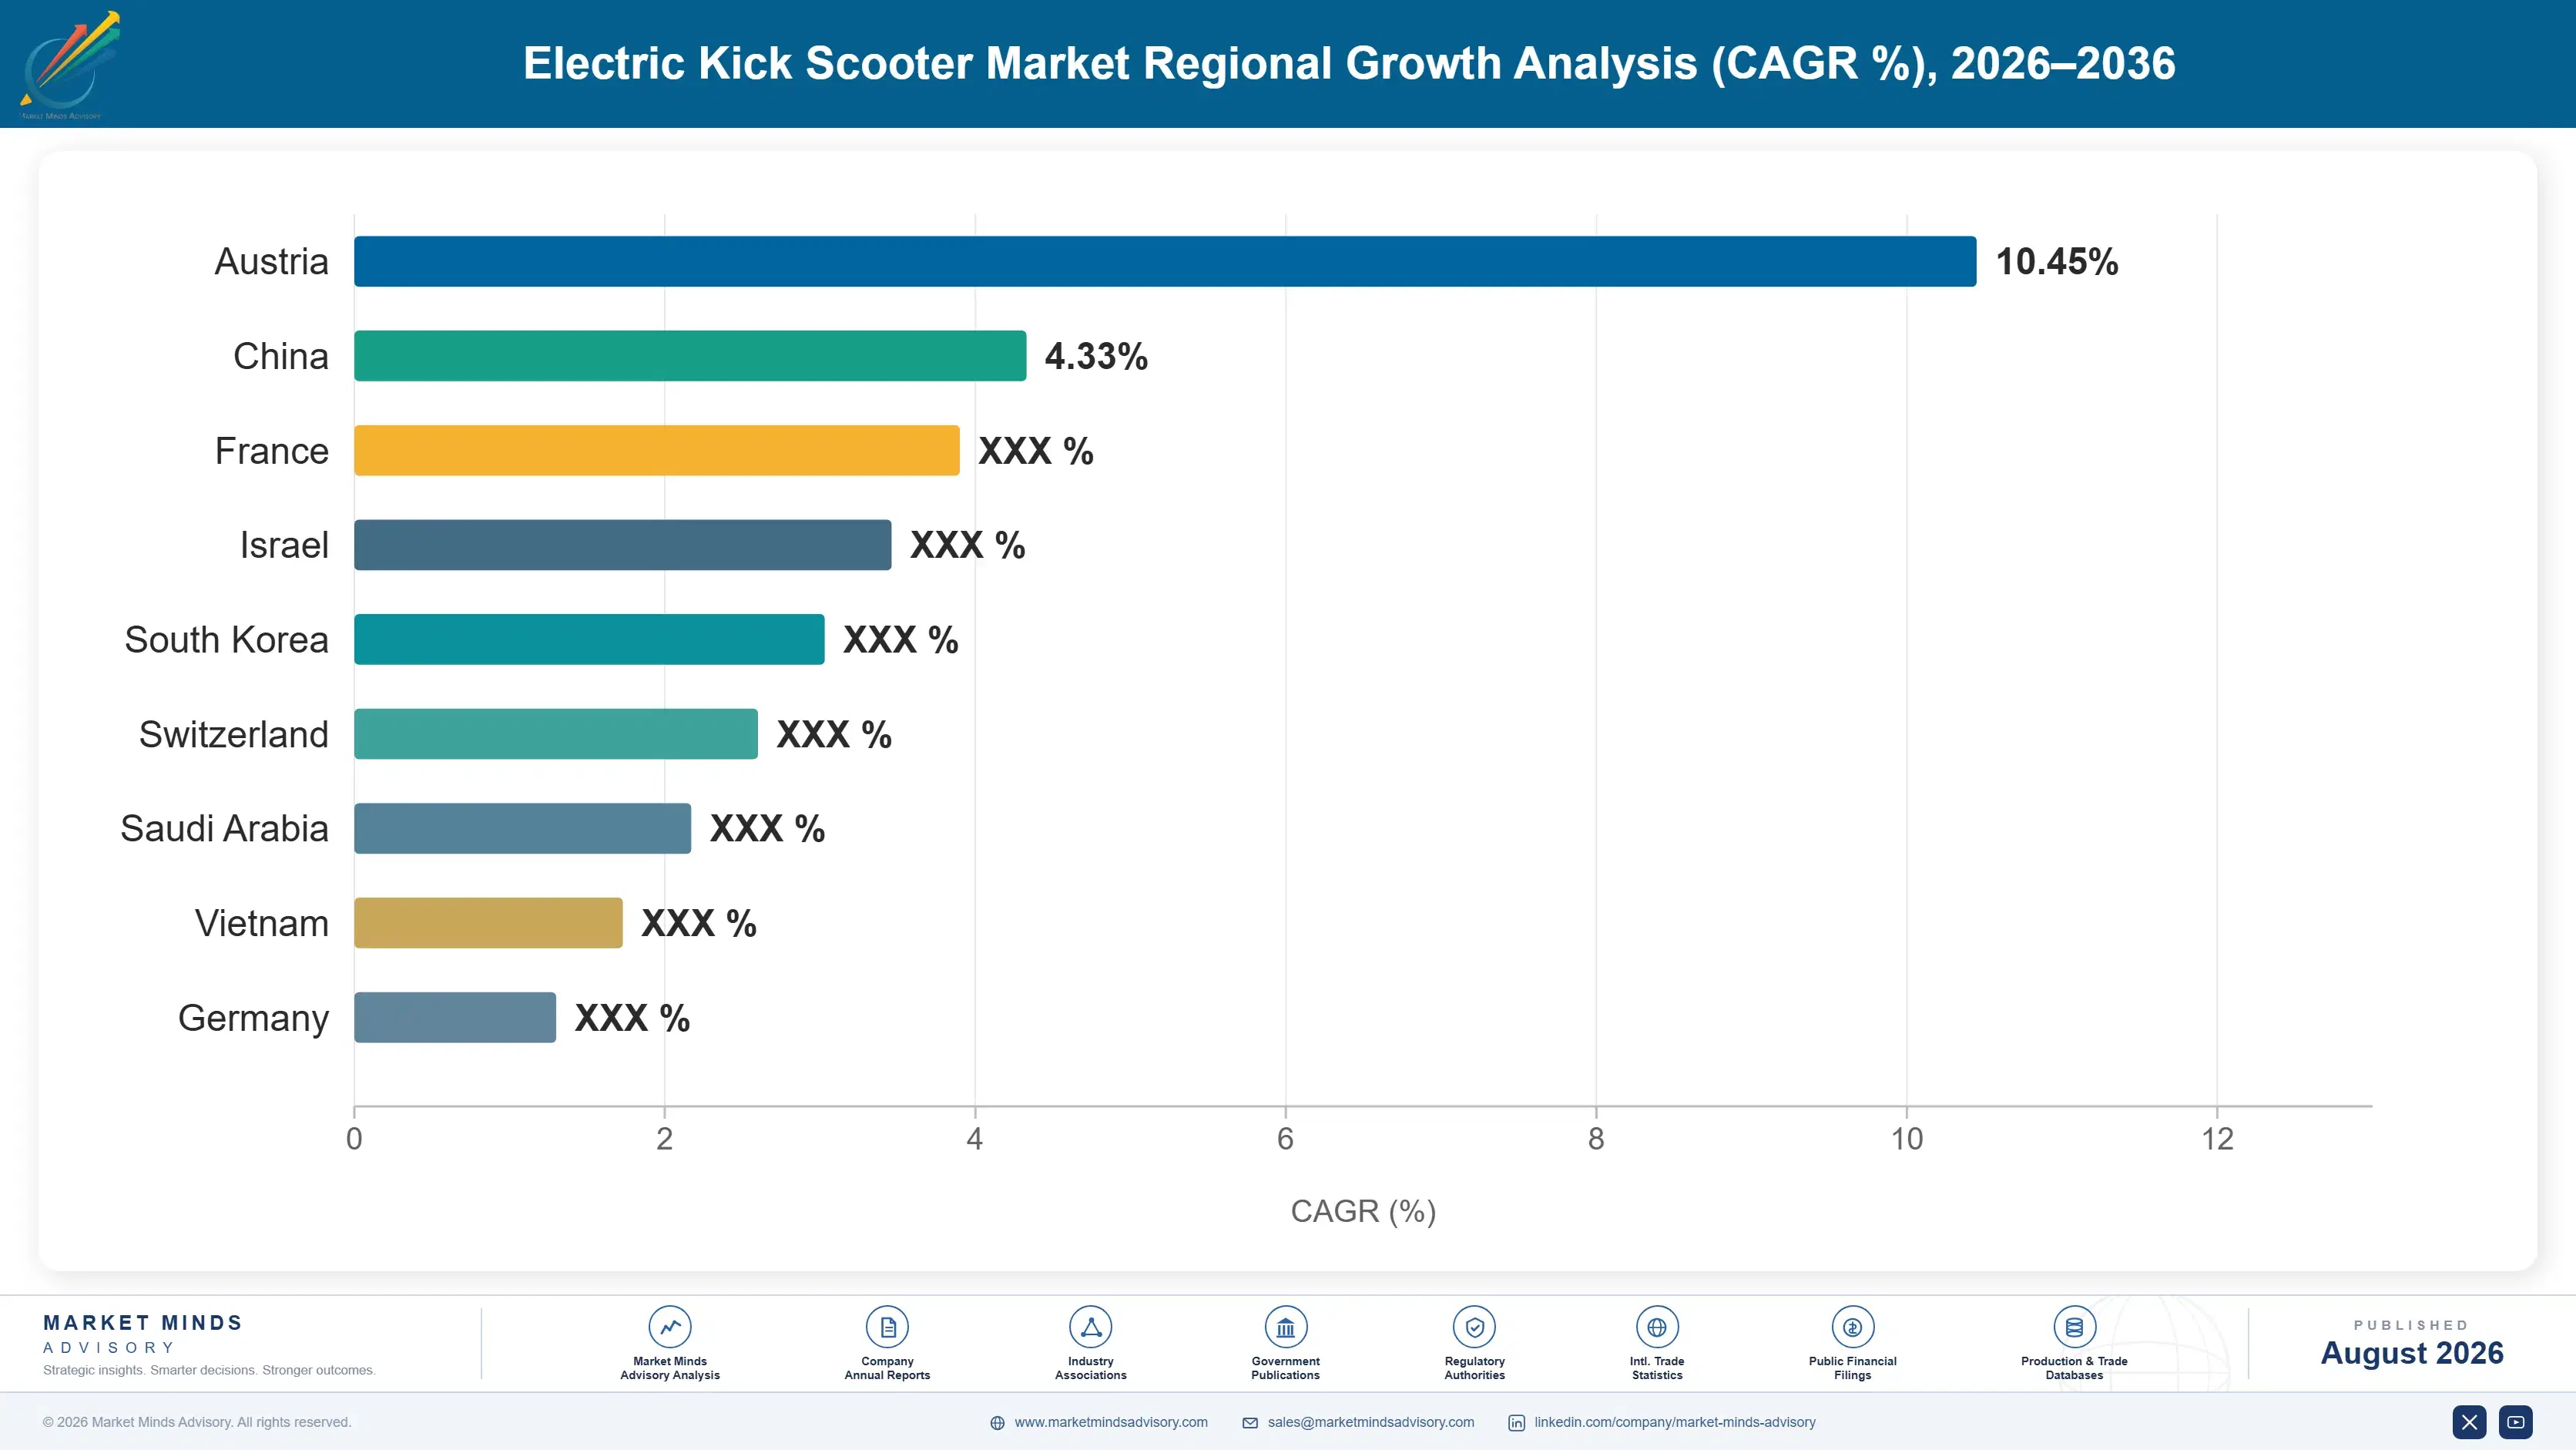
electric-kick-scooter-market-country-cagr-analysis-1787315832836

Where Scooter Margin Is Actually Won

Four positions separate manufacturers earning genuine margins from those shipping badged imports at commodity rates: engineering fleet-grade durability that operators can measure, holding battery safety certification across every major regulated market, building service and parts networks that badge importers cannot match, and selling tested range rather than competing against imports on headline retail price alone.

Engineer Measurable Fleet Durability Into The Hardware

Shared operators now buy on total cost per ride, and a vehicle lasting 24 months instead of 12 halves the capital charge carried by every trip it takes. Manufacturers who can demonstrate that life through field data rather than claim it in a brochure realise 25% to 35% higher unit pricing and win multi-year supply agreements rather than single purchase orders. The engineering involved is cast frames, sealed bearings and vibration-resistant fasteners rather than anything exotic, but proving it takes deployed fleet data that most manufacturers have never bothered to collect.
Market Impact: Realises 35% higher pricing on all

Hold Safety Certification Across Every Major Market

Underwriters Laboratories certification and equivalent European approvals have become the effective entry requirement for formal retail distribution, after battery fires prompted widespread delisting and municipal restrictions. Certification costs cell selection discipline, pack construction quality and testing programmes that run several months for every model in the range, and it eliminates the cheapest imported competition entirely from precisely the retail channels that actually matter. Certified product commands 18% to 26% higher realised pricing, and more importantly it stays on the shelf when a retailer purges uncertified stock after any safety incident.
Market Impact: Commands 26% higher pricing across

Build Service And Parts Networks Importers Cannot Match

A scooter that fails just outside warranty with no available spare parts simply becomes landfill, and buyers who have experienced that once never repeat the brand. Manufacturers operating authorised service networks and stocking spare parts for a full five years after launch hold 20% to 28% higher repeat purchase rates, and they price accordingly. The cost involved here is inventory and partner management rather than any manufacturing capital at all, which makes it considerably faster to establish than any product programme, and far harder for a badge importer to replicate at all.
Market Impact: Lifts repeat purchase rates by up t

Sell Range Instead Of Competing On Headline Price

Long-range models grow at 12.9% while entry-level product grows at less than half that rate, and the pack accounts for most of the price difference on a frame costing only modestly more to build. Manufacturers positioning on real-world range rather than advertised maximum figures realise 30% to 40% higher average selling prices and attract buyers who have already been disappointed by optimistic claims. Honest range testing is a marketing asset in a category where almost nobody publishes it, which is a rare advantage and costs nothing beyond the discipline itself.
Market Impact: Raises average selling prices by as

Who Controls the Margin Pool

Concentration sits at 41% for the top five measured on unit shipment volume, the basis used throughout this section, and it understates true manufacturing concentration considerably. Segway-Ninebot and Xiaomi lead on global volume including substantial output badged under other companies' brands, while NIU, Okai and Yadea hold strong positions across consumer and fleet product. The gap to the next tier is narrow in badge terms and very wide in actual manufacturing capability.
Competitive activity runs on three fronts. Fleet durability engineering is the first, since operators now buy on demonstrated vehicle life rather than on specification sheets. Safety certification is the second, and it determines shelf access at every major Western retailer. The third is service and parts network depth, where established manufacturers hold an advantage that badge importers find genuinely difficult to replicate at any price.

Pressure arrives from two directions. Unbranded Chinese output competes at delivered costs that no Western assembler approaches, particularly at entry level. Separately, municipal permit decisions can remove fleet demand from a whole city without warning, as Paris demonstrated. Rankings will shift on who holds certified long-range product when private purchase overtakes fleet volume decisively.
electric-kick-scooter-market-company-positioning-matrix-1787315833359

Competitive Moat and Risk Dimensions

SEGWAY-NINEBOT

Moat: Manufacturing scale and design breadth

Production volume across consumer, fleet and badged output for other brands spreads tooling and component purchasing across quantities no competitor approaches, and the resulting cost position holds even against unbranded Chinese product. Design capability spanning entry-level through fleet-grade also means the company competes credibly in every segment rather than defending one.
SEGWAY-NINEBOT

Risk: Own-brand versus contract tension

Manufacturing for competing brands while selling under its own name creates a conflict that grows sharper as those customers scale, and several have begun dual-sourcing specifically to reduce dependence. Contract volume is also the first thing lost when a brand customer decides its supplier has become a rival rather than a partner.
OKAI VEHICLE

Moat: Fleet-grade durability engineering

Purpose-built shared service hardware with documented field life data gives operators the total cost per ride evidence they now demand before committing to multi-year supply agreements. That evidence base takes years of deployed fleet operation to accumulate, and a competitor arriving with claims rather than data does not get past procurement.
OKAI VEHICLE

Risk: Shared operator demand concentration

Revenue depends heavily on a small number of shared operators whose own fortunes swing with municipal permit decisions and funding availability. A single city banning operations or an operator failing removes volume with no notice, and the consumer channel that would balance that exposure requires brand investment the business has not made.

Players Tracked

Prominent Players

Segway-Ninebot
Xiaomi
NIU Technologies
Okai Vehicle
Yadea Technology Group

Other Key Players

Micro Mobility Systems
Razor USA
Kaabo
Minimotors
Inokim
Pure Electric
Apollo Scooters
Unagi Scooters
VSETT
Nanrobot
Jiangsu Xinri E-Vehicle
Aima Technology Group
Luyuan Group
Bird Global
Acton

Recent Developments

FEBRUARY 2025

Swappable battery platform adopted across shared operator fleet

A manufacturer and a European shared operator jointly deployed a swappable battery platform across a multi-city fleet, which replaces vehicle collection entirely with field swapping and cutting operating cost by roughly thirty percent while keeping vehicles out earning revenue rather than sitting idle in collection vans.
Signal: Field battery swapping rather than vehicle
JUNE 2025

Retailer certification requirement removes uncertified imports

A major North American retailer began requiring Underwriters Laboratories certification on every single electric scooter listing it carried during the year, which delisted a very substantial volume of imported product almost overnight and reshaped which manufacturers could reach mainstream consumers through that particular channel at all.
Signal: Retailer certification policy has now beco
OCTOBER 2025

Domestic scooter assembly launched under Indian content incentives

A manufacturer began assembling electric kick scooters domestically at a plant in India under the prevailing local content incentive schemes, targeting the short urban trips currently served by auto-rickshaws and motorcycles, at price points that fully imported units could never reach once duty was applied.
Signal: Local assembly economics rather than any d

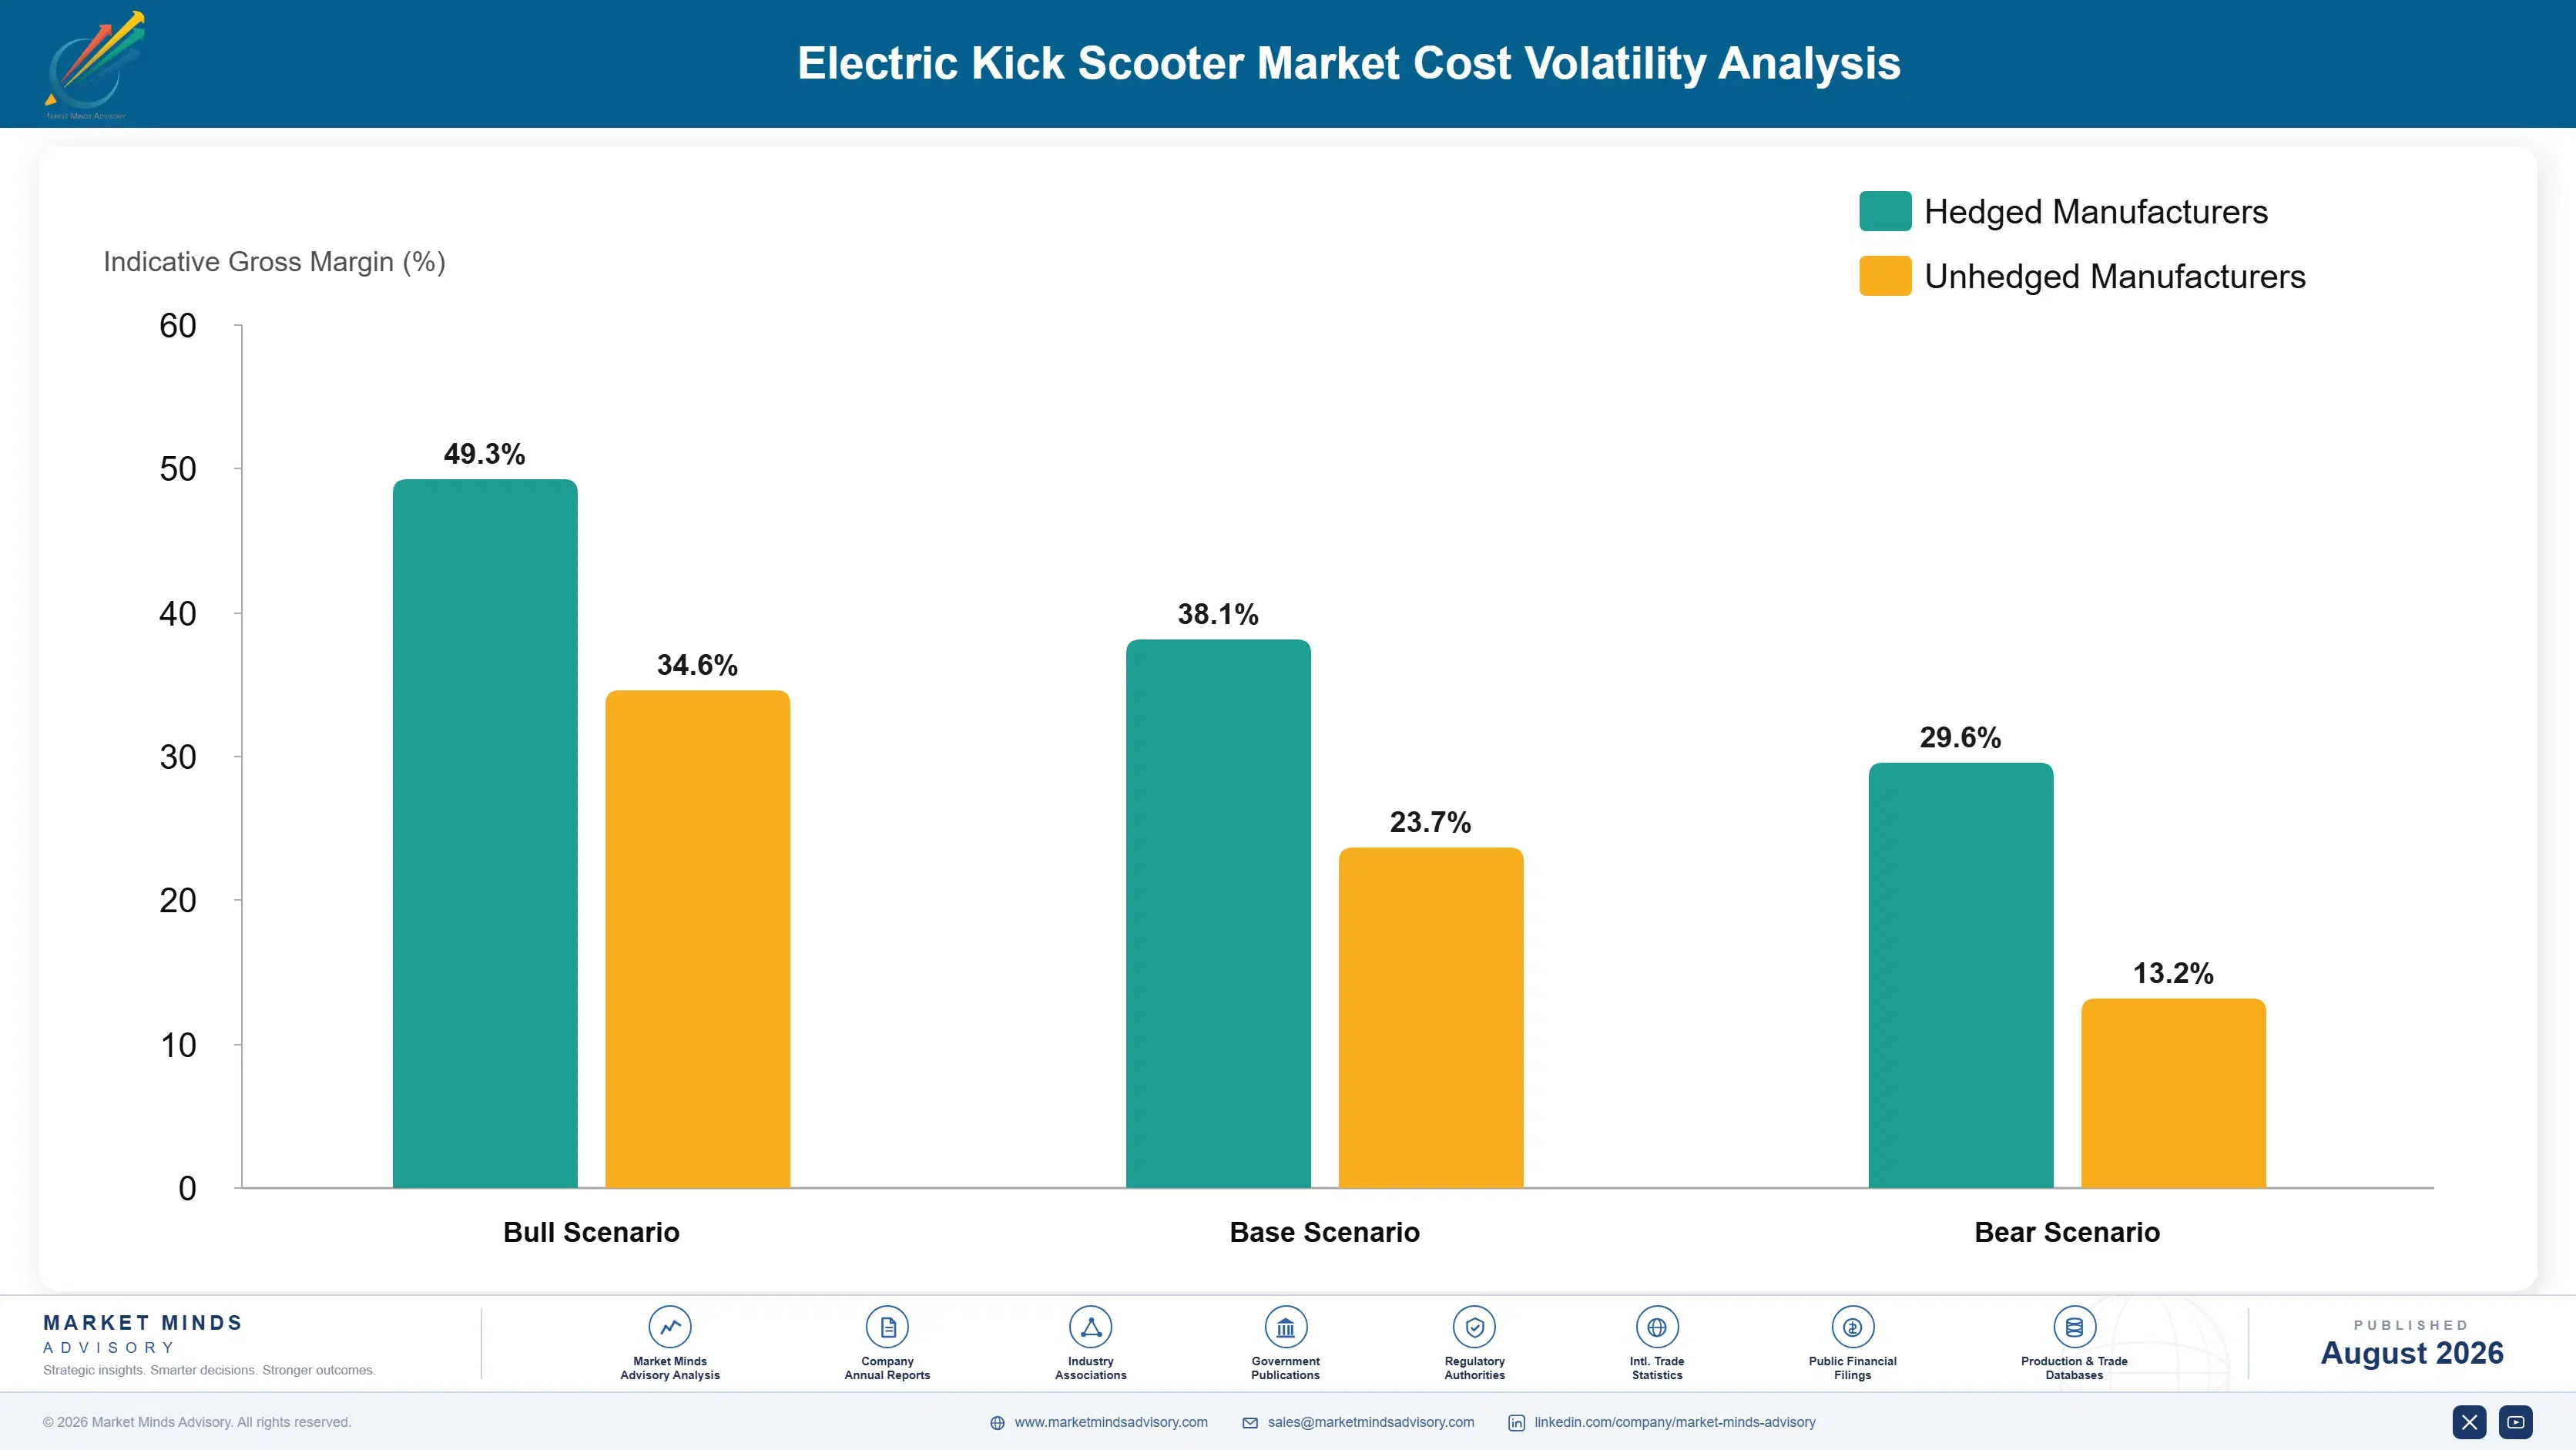
What Drives Scooter Input Cost

Lithium cells and pack assembly account for roughly 31% of manufactured cost, sourced almost entirely from Chinese and Korean producers. Aluminium deck, stem and frame content adds around 18%, motor and controller a further 14%, and wheels, tyres, brakes and suspension roughly 12% between them. Certification, testing and compliance work contributes about 5% on product sold into regulated Western retail channels, which is a cost the cheapest imports simply avoid.
Lithium carbonate pricing collapsed through 2023 and 2024 after the 2022 spike, which cut pack costs materially and was passed through as either lower retail pricing or larger batteries at the same price point. IEA battery price tracking shows the pack-level decline clearly. Aluminium moved the other way during European smelter curtailments, and manufacturers on fixed retail price points absorbed that increase rather than repricing mid-season.

The disadvantage mechanism is certification cost rather than materials. A manufacturer carrying Underwriters Laboratories and European approvals across its range absorbs roughly 5% of cost that an uncertified importer does not, and competes against that product at retail. Exposure also varies by market: certified channels reward the investment, while emerging markets with no enforcement let uncertified product undercut compliant manufacturers directly.
electric-kick-scooter-market-cost-volatility-analysis-1787315833557

Standardise cell format and pack architecture across models

A single cell format and pack architecture spanning several models concentrates purchasing volume, cuts certification cost by allowing shared test evidence, and simplifies spare parts inventory across the service network. The constraint is design flexibility, since every model then works within one pack envelope. On a product where cells are nearly a third of cost, that constraint is worth accepting.

Certify once and sell across multiple regulated markets

Designing to the strictest applicable standard and certifying against several regimes simultaneously spreads compliance cost across far more units than sequential market-by-market approval does. The discipline is upfront rather than retrofitted, which is where most manufacturers get it wrong. Certification is also the gate to retail shelf access, so the spending buys distribution rather than merely compliance.

Assemble locally where content incentives justify it

Import duties and local content incentives across India, Brazil and several Southeast Asian markets make fully imported units progressively uncompetitive against locally assembled product. Assembly investment is modest compared with full manufacturing, since cells, motors and controllers still arrive from established suppliers. The decision hinges on whether incentive schemes are durable enough to justify committing capacity against them.

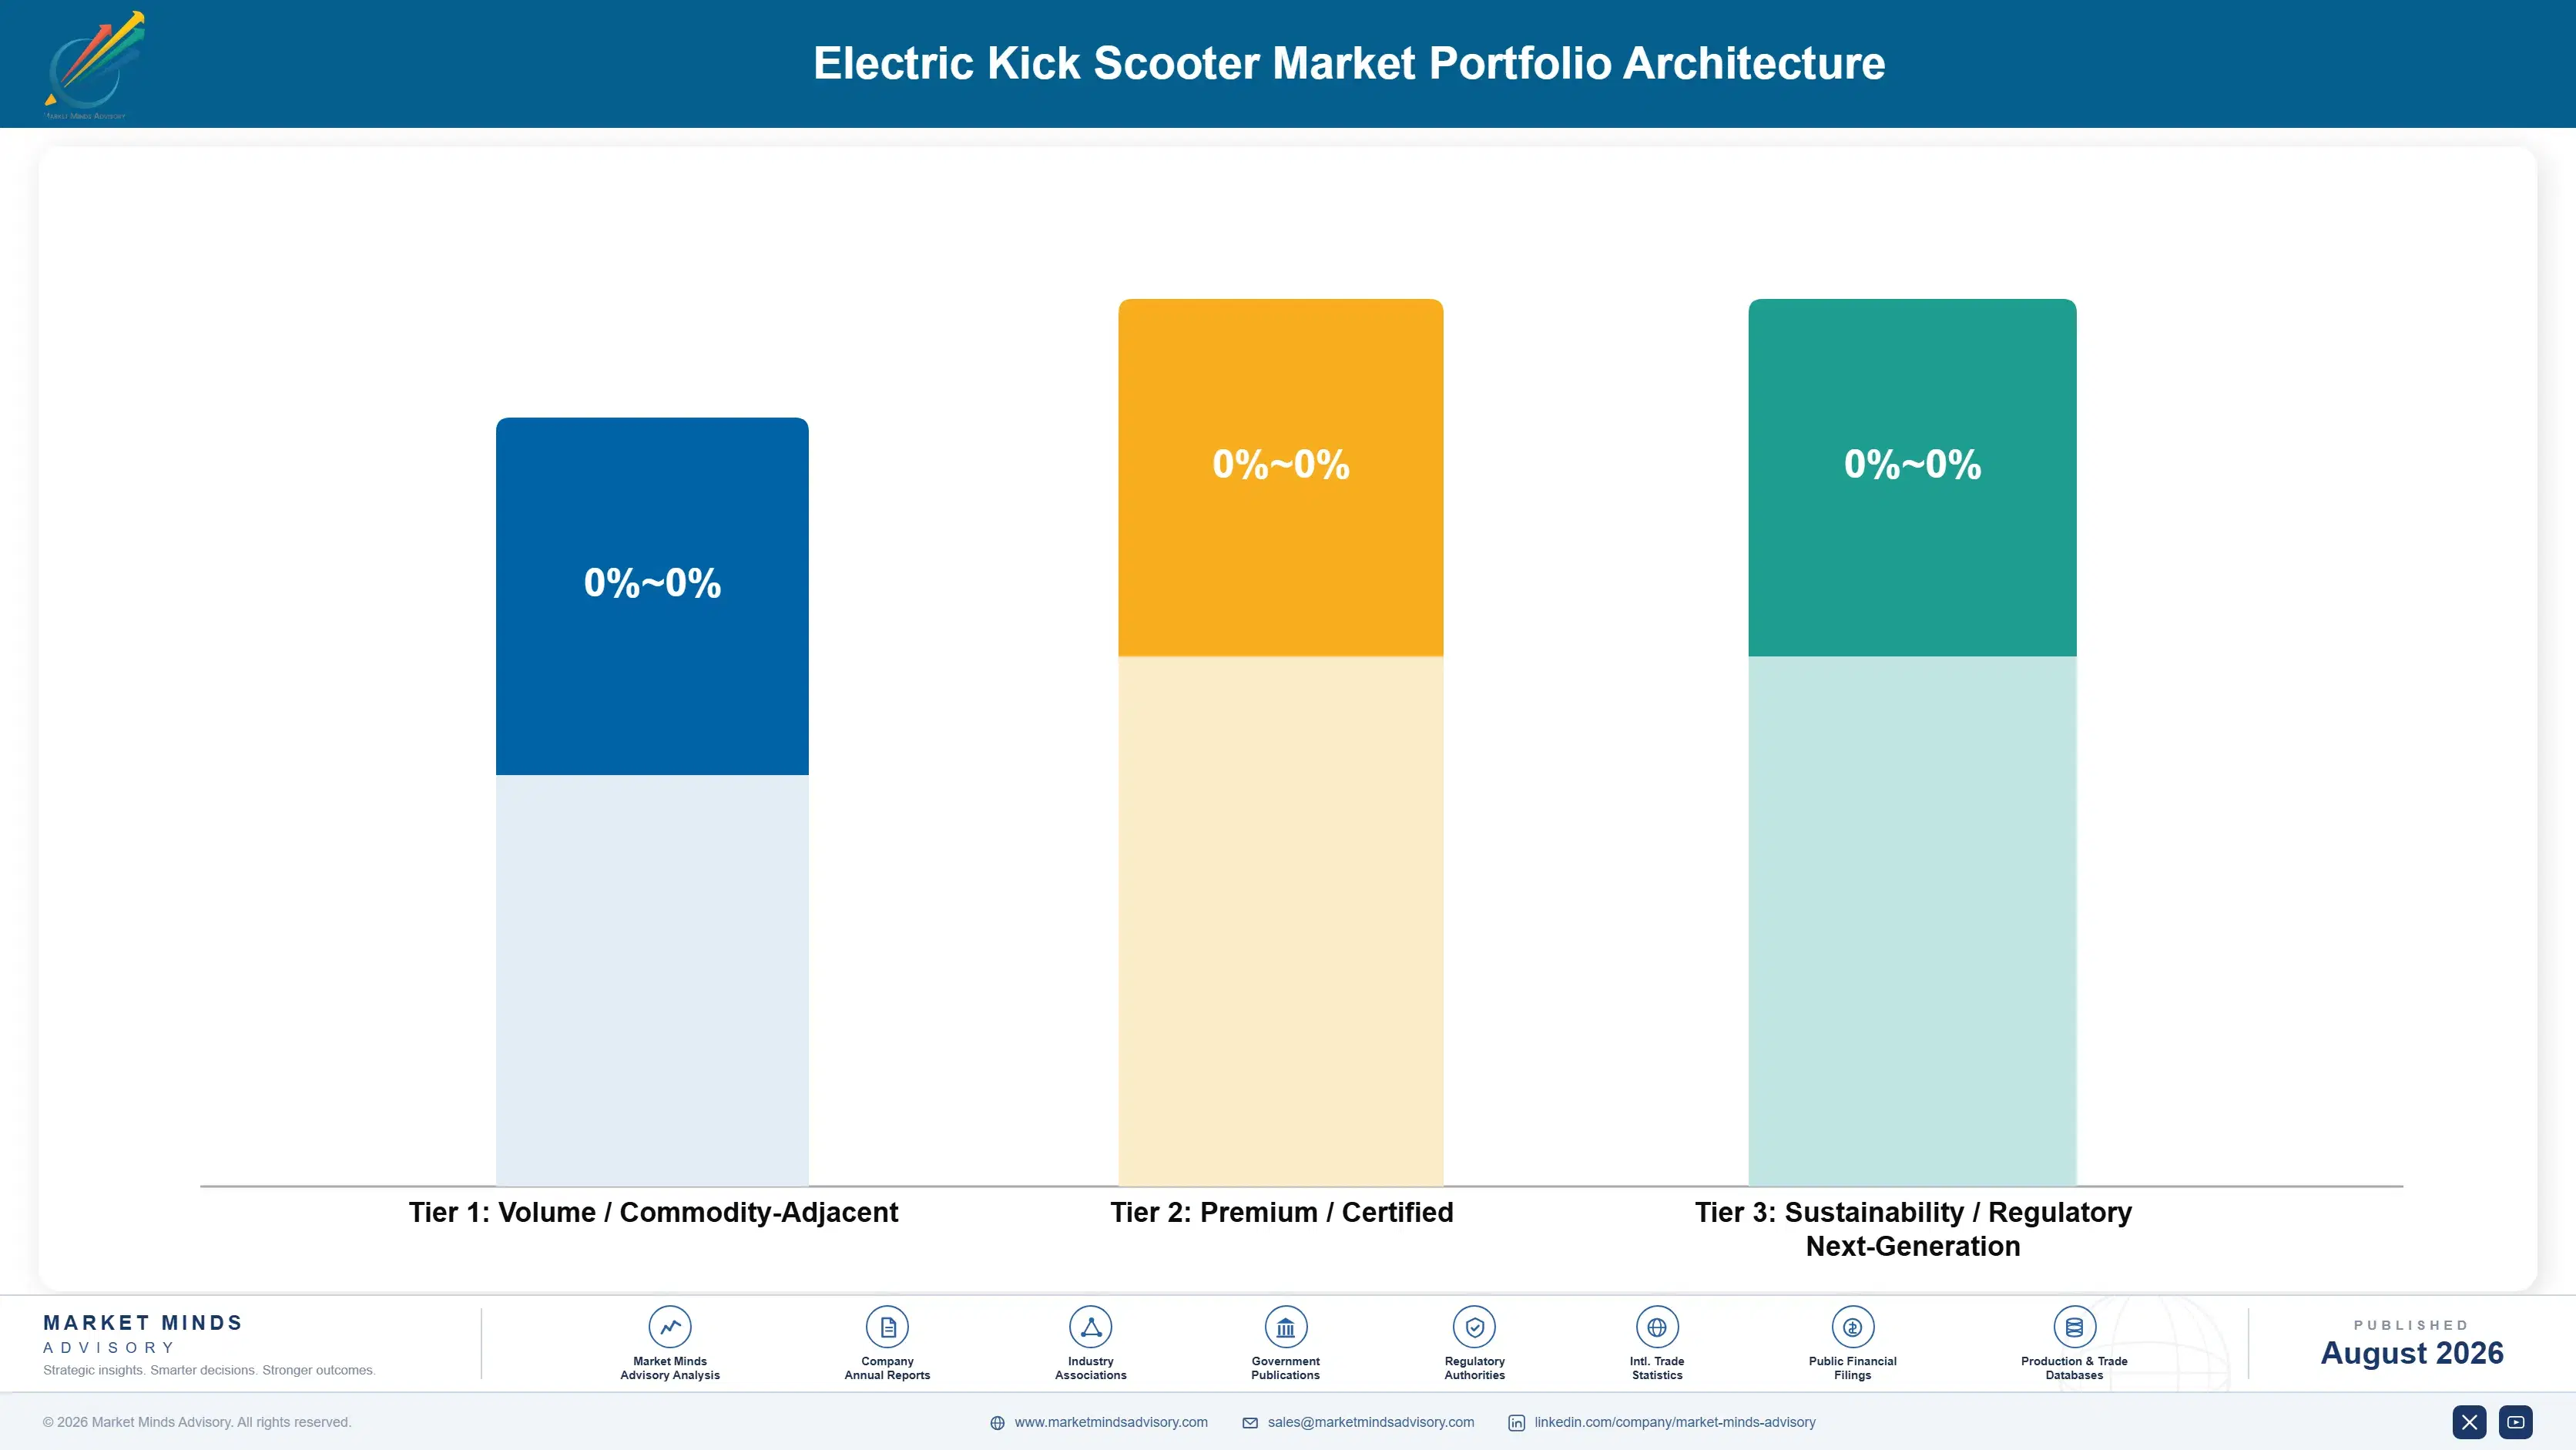
Portfolio Architecture for Margin Defence

Portfolio economics here divide on certification and durability content rather than on brand. Entry-level uncertified product sold through online marketplaces earns gross margins in the low teens, because the physical vehicle is available from dozens of Chinese producers, the badge carries no pricing power at all and buyers in that channel compare on headline price and nothing else.
The premium tier is certified long-range consumer product. Larger packs, safety certification, service network support and honest range figures together command roughly double entry-level retail on a frame costing modestly more, which holds margins in the high twenties to mid thirties across the whole category. Buyers in this tier compare on range and warranty rather than on sticker price alone.

Above both sits fleet-grade hardware sold to shared operators under multi-year supply agreements. Cast frames, swappable batteries and documented field life data command premium pricing because operators calculate total cost per ride rather than purchase price, and the supply agreements carry parts and service revenue behind them. Margins reach the high thirties, and the demand is contracted rather than seasonal, which makes it considerably more predictable than consumer retail.

Volume / Commodity-Adjacent

Entry-level uncertified product sold through online marketplaces. Available from dozens of Chinese producers under any badge an importer chooses, compared purely on headline price, which holds margin at the floor permanently.
Gross Margin: 10 to 15%

Premium / Certified

Certified long-range consumer scooters with service network support. The range is wide because certification scope varies by market and because service network depth differs considerably between one manufacturer and the next.
Gross Margin: 27 to 35%

Sustainability / Regulatory / Next-Generation

Fleet-grade hardware supplied under multi-year operator agreements with parts and service attached. The range reflects the gap between single fleet orders and full supply partnerships carrying field data and warranty obligations.
Gross Margin: 34 to 42%
electric-kick-scooter-market-portfolio-architecture-1787315834060

High-value Sub-segments and Strategic Watch-out

Fleet-Grade Swappable Battery Platforms

High value and high growth sitting squarely together. Field battery swapping cuts operator running cost by roughly a third, documented vehicle life supports total cost per ride arguments that procurement actually accepts, and multi-year supply agreements carry parts and battery revenue along behind the hardware itself.
Gross Margin: 36 to 43%

Certified Long-Range Consumer Product

High value running on genuinely strong underlying growth. Buyers who once shopped purely on price now shop on range and safety certification, both of which carry real cost, and the resulting product sells at roughly double entry-level retail on a frame that costs only modestly more.
Gross Margin: 29 to 36%

Mid-Range Branded Commuter Scooters

The volume core that keeps distribution relationships alive and healthy and service networks properly utilised between higher-value sales. Margins stay modest here because Chinese alternatives are genuinely close substitutes, but the volume involved underwrites the brand and distribution investment that everything else in this portfolio depends on.
Gross Margin: 18 to 25%

Entry-Level Marketplace Product

The strategic watch-out sitting squarely in this portfolio. Volumes here are large and the channel is genuinely easy to enter, but certification requirements are now steadily closing mainstream retail off to uncertified product, and the badge printed on the deck carries no pricing power of any kind whatsoever.
Gross Margin: 10 to 15%

How Scooter Demand Repeats

The annuity here differs completely between the two channels. Fleet supply generates replacement demand on a roughly 24 month cycle plus continuous parts and battery revenue across that life, all of it contracted and predictable. Consumer purchase generates almost nothing afterwards unless the manufacturer holds a service network, in which case spares, battery replacement and eventual repurchase all follow the original sale.
Stickiness varies sharply by buyer. Shared operators are the stickiest, because switching hardware means retraining field crews, restocking parts and rebuilding the field data that justified the last procurement decision. Certified retail channels are moderately sticky, since retailers dislike churning suppliers who have cleared compliance review. Marketplace buyers are not sticky at all and never have been, comparing headline price across dozens of near-identical listings with no brand consideration whatsoever.

The buyer profile has shifted generationally. Early private buyers were technology enthusiasts tolerating rough edges for novelty. Today's buyer is a commuter replacing a specific journey, and they evaluate real-world range, battery safety certification and whether parts will exist in three years, which favours manufacturers able to answer all three of those questions convincingly and in writing.
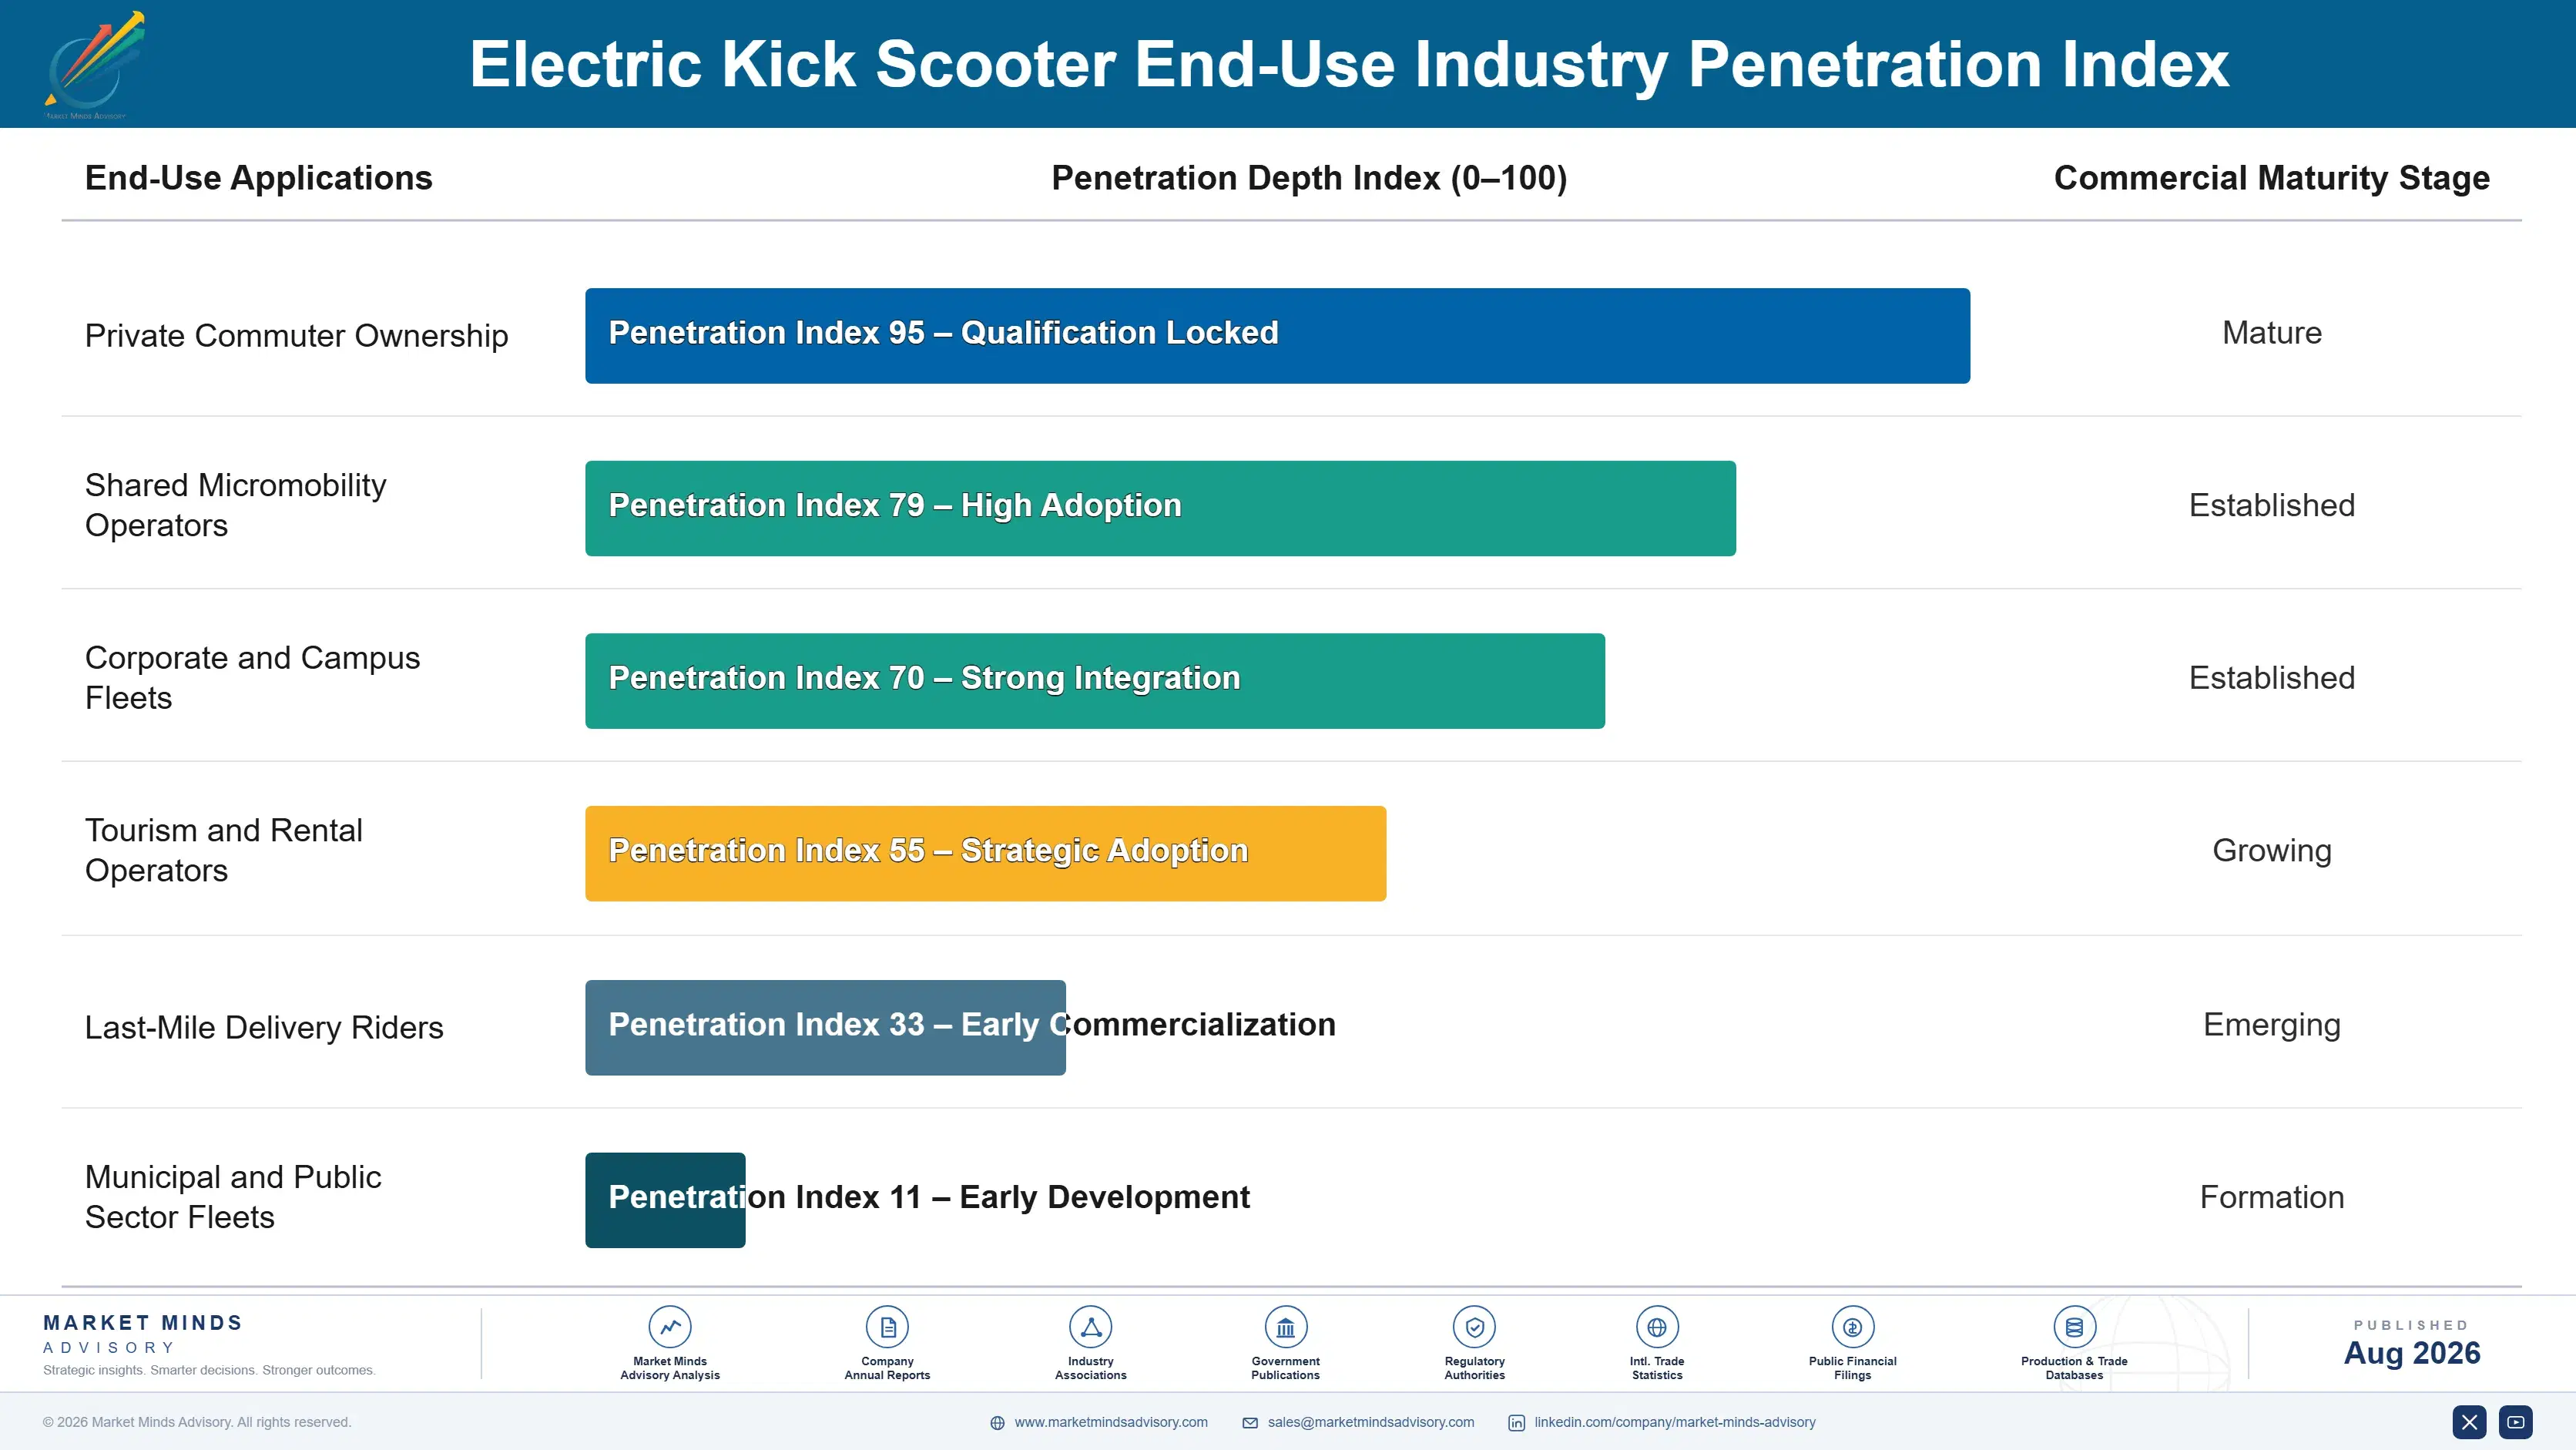
electric-kick-scooter-market-end-use-penetration-index-1787315834544

Where To Compete And Why

These are among the four positions where our research anticipates prominent divergence between winners and laggards over the coming forecast period. Each is grounded in the demand model, the regulatory perimeter, and the announced capacity pipeline.
01 / FLEET DURABILITY ENGINEERING

Operators buy proven life not specification sheets

Shared operators calculate total cost per ride, and hardware lasting 24 months instead of 12 halves the capital charge on every trip taken. Manufacturers demonstrating that life through deployed field data rather than claiming it realise 25% to 35% higher unit pricing and win multi-year supply agreements instead of single orders. The engineering itself is cast frames and sealed bearings rather than anything exotic, but the field evidence takes years of deployed operation to accumulate and no competitor can shortcut it.
02 / SAFETY CERTIFICATION COVERAGE

Certification is now the shelf access gate

Underwriters Laboratories approval and its European equivalents have become the effective entry requirement for formal retail distribution after battery fires prompted widespread delisting and municipal restrictions across several major markets. Certified product commands 18% to 26% higher realised pricing, and more importantly it stays on the shelf when retailers purge uncertified stock after any safety incident. The cost involved is cell discipline, pack construction quality and months of testing per model, which is exactly what opportunistic importers refuse to fund.
03 / SERVICE NETWORK DEPTH

Parts availability decides the next purchase

A scooter failing out of warranty with no available parts becomes landfill, and buyers who experience that once do not return to the brand under any circumstances. Manufacturers running authorised service networks and stocking spare parts for five years hold 20% to 28% higher repeat purchase rates, and they price accordingly. The investment required is inventory and partner management rather than any manufacturing capital, which makes it both faster to build and considerably harder for any badge importer to replicate credibly.
04 / RANGE POSITIONING DISCIPLINE

Sell honest range not advertised maximums

Long-range models grow at 12.9% against less than half that for entry-level product, and the battery pack accounts for most of the price gap on a frame costing only modestly more to build. Manufacturers positioning on tested real-world range rather than optimistic maximum figures realise 30% to 40% higher average selling prices. Publishing honest range data is a marketing asset in a category where almost nobody does it, and it costs nothing at all beyond the discipline of doing it properly.

Engagement Snapshot From the Field

A live engagement with an industry participant carrying material or product regulatory and market exposure ahead of a defining policy shift, showing how our research translates into a defensible multi-year portfolio strategy.
MARKET MINDS ADVISORY · CLIENT ENGAGEMENT SUMMARY
Electric Kick Scooter Producer Strategic Portfolio Review and Transition Roadmap 2026·Investment Scenario on Electric Kick Scooter Exposure Evaluation 2025-26
CLIENT PROFILE
A European electric scooter brand with annual revenue near $95 million (client-reported, unverified by MMA), roughly 68% of it from shared operator fleet supply across six countries. The business held solid fleet relationships and a credible durability record but had almost no consumer presence, and two of its largest operator customers had lost city permits during the previous eighteen months.
STRATEGIC CHALLENGE
Fleet revenue concentration had become dangerous, with municipal permit decisions capable of removing a quarter of the order book without notice. Management needed to decide whether to build a consumer brand and retail distribution from nothing, diversify fleet supply across more operators and geographies, or reposition entirely toward certified long-range consumer product where growth was strongest.
MMA APPROACH
MMA modelled fleet and consumer demand across eleven European markets through 2036, mapped municipal permit stability against operator financial position by city, and assessed certification, distribution and brand building requirements for consumer entry. Twenty expert interviews with operator procurement leads, retail buyers and municipal transport officials tested where demand would prove durable.
KEY FINDINGS
  1. Permit stability varied enormously by city and correlated closely with how operators had handled parking and pavement clutter, which meant fleet risk was addressable through customer selection rather than being inherent.
  2. Consumer certified long-range product carried gross margins roughly 14 points above the client's fleet business, but required retail distribution the business had never built and could not establish quickly.
  3. The client's fleet durability engineering transferred directly into consumer product, with around 65% component reuse, making the repositioning far cheaper than management had assumed it would be.
  4. Retail buyers ranked certification and parts availability above brand recognition, which removed the client's central objection that it lacked consumer awareness in target markets.
CLIENT PROFILE
A European electric scooter brand with annual revenue near $95 million (client-reported, unverified by MMA), roughly 68% of it from shared operator fleet supply across six countries. The business held solid fleet relationships and a credible durability record but had almost no consumer presence, and two of its largest operator customers had lost city permits during the previous eighteen months.
STRATEGIC CHALLENGE
Fleet revenue concentration had become dangerous, with municipal permit decisions capable of removing a quarter of the order book without notice. Management needed to decide whether to build a consumer brand and retail distribution from nothing, diversify fleet supply across more operators and geographies, or reposition entirely toward certified long-range consumer product where growth was strongest.
MMA APPROACH
MMA modelled fleet and consumer demand across eleven European markets through 2036, mapped municipal permit stability against operator financial position by city, and assessed certification, distribution and brand building requirements for consumer entry. Twenty expert interviews with operator procurement leads, retail buyers and municipal transport officials tested where demand would prove durable.
KEY FINDINGS
  1. Permit stability varied enormously by city and correlated closely with how operators had handled parking and pavement clutter, which meant fleet risk was addressable through customer selection rather than being inherent.
  2. Consumer certified long-range product carried gross margins roughly 14 points above the client's fleet business, but required retail distribution the business had never built and could not establish quickly.
  3. The client's fleet durability engineering transferred directly into consumer product, with around 65% component reuse, making the repositioning far cheaper than management had assumed it would be.
  4. Retail buyers ranked certification and parts availability above brand recognition, which removed the client's central objection that it lacked consumer awareness in target markets.
RECOMMENDED STRATEGY
Phase 1: Phase one: launch certified long-range consumer product reusing existing fleet engineering, distributed through specialist retail rather than mass market channels initially. Phase 2: Phase two: rebalance fleet supply toward operators in cities with demonstrated permit stability, accepting lower volume in exchange for materially lower revenue risk. Phase 3: Phase three: build authorised service partner coverage across core European markets, supporting both channels from a single shared parts inventory and network.
OUTCOME
The client launched two consumer models within nine months and reported first-year consumer revenue of $21 million against a $14 million plan (client-reported, unverified by MMA). Blended gross margin improved by roughly five points, fleet concentration fell from 68% to 51% of revenue, and service partner coverage now spans four core markets.

Frequently Asked Questions

Foundational context covering the market sizes, CAGR, scope, country, region and competition that inform every finding below. This section is provided to cover basics and most often pre-purchase conversations, answered from the MMA Primary Research Dataset.

What is the current size of the Electric Kick Scooter Market?

The global electric kick scooter market was valued at $5.40 billion in 2025, reaching an estimated $5.86 billion in 2026. That covers standing electric scooters sold into private ownership and shared operator fleets.

How large will the Electric Kick Scooter Market be by 2036?

MMA forecasts the market reaching $13.37 billion by 2036, an increase of $7.51 billion over the 2026 base. That represents an expansion multiple of 2.28 times across the forecast period.

What is the CAGR for the Electric Kick Scooter Market 2026 to 2036?

The base case compound annual growth rate is 8.6%, with a bull case of 9.8% and a bear case of 7.4%. Historical growth between 2020 and 2025 ran at 7.2% annually.

Which segment is growing fastest?

Long-range commuter scooters grow at 12.9%, a full 1.50 times the market rate, as private buyers trade up for battery capacity. Fleet-grade shared service scooters follow at 10.0% annually.

Who are the major companies in the Electric Kick Scooter Market?

Segway-Ninebot, Xiaomi, NIU Technologies, Okai Vehicle and Yadea Technology Group lead on unit shipment volume. Together they account for roughly 41% of global shipments including substantial badged output.

Which country is growing fastest?

India grows fastest at 11.2% annually, driven by short-trip substitution against auto-rickshaws and motorcycles plus local assembly incentives. Vietnam and Indonesia follow on similar substitution economics.

Report Segmentation Architecture

The full report scope spans multiple orthogonal segmentation dimensions, with cross-tabulated demand data provided for each dimension pair. Coverage extends further to regional breakdowns, trend trajectories, and the competitive detail needed to support segment-level decision-making.

By Scooter Product Class

  • Long-Range Commuter Scooter
  • Fleet-Grade Shared Service Scooter
  • Performance and Off-Road Scooter
  • Seated and Cargo-Capable Scooter
  • Entry-Level Urban Scooter

By End-Use Industry

  • Private Commuter Ownership
  • Shared Micromobility Operators
  • Corporate and Campus Fleets
  • Tourism and Rental Operators
  • Last-Mile Delivery Riders
  • Municipal and Public Sector Fleets

By Commercial Dimension

  • Specialist Retail and Dealer Channel
  • Online Marketplace and Direct Sales
  • Shared Operator Fleet Supply Agreements
  • Original Design Manufacturing for Brands
  • Authorised Service and Parts Channel

By Region

  • North America
  • Western Europe
  • East Asia
  • South Asia and Pacific
  • Latin America
  • Middle East and Africa
  • Eastern Europe

Scope, Methodology, and Coverage

Every figure in this report is reproducible from documented input assumptions. The scope below maps the historical period, the forecast horizon, the segmentation dimensions, and the countries covered, alongside the underlying primary and qualitative methodology.
Historical Period
2020 to 2025
Forecast Period
2026 to 2036
Base Year
2025 (USD billions; MMA Primary Research Dataset, August 2026)
Market Definition
This report covers standing electric kick scooters with folding or fixed decks and handlebar steering, sold into private ownership, shared operator fleets, corporate and campus deployments and rental operations across consumer, commuter and light utility applications. Electric mopeds, registered seated two-wheelers, electric bicycles, hoverboards, self-balancing devices, mobility scooters for disability use, and shared fleet operating service revenue are excluded from the sizing. Aftermarket accessories and replacement batteries sold separately are excluded.
Quantitative Units
USD billions at manufacturer realised value; unit shipments in millions; average realised price in USD per scooter.
Segmentation Dimensions
By scooter product class; by end-use industry; by commercial dimension; by region.
Regions Covered
North America, Western Europe, East Asia, South Asia and Pacific, Latin America, Middle East and Africa, Eastern Europe
Countries Covered
United States, Canada, Mexico, United Kingdom, Germany, France, Italy, Spain, Sweden, Japan, South Korea, China, India, Thailand, Australia, Brazil, Chile, United Arab Emirates, Poland, Turkey.
Key Companies Profiled
Segway-Ninebot, Xiaomi, NIU Technologies, Okai Vehicle, Yadea Technology Group, Micro Mobility Systems, Razor USA, Kaabo, Minimotors, Inokim, Pure Electric, Apollo Scooters, Unagi Scooters, Bird Global and others.
Quantitative Methodology
Primary survey, n=3,800 respondents, Q4 2025, six countries; demand-side model with trade association cross-validation
Qualitative Methodology
47 expert interviews, Q4 2025; applied to validate demand model assumptions, identify emerging dynamics, and assess competitive positioning
Report Format
PDF and XLSX data workbook (Word format preview document)
Publisher
Market Minds Advisory
Report Code
MMA-2026-AUT-921
Published
August 2026
Contact
sales@marketmindsadvisory.com | www.marketmindsadvisory.com

Purchase the full Electric Kick Scooter Market Report (2026 to 2036).

The full report sizes the electric kick scooter market across five product classes, six end-use industries and seven regions, with unit shipment and realised pricing detail behind every value estimate. It profiles twenty manufacturers on durability engineering, certification coverage and service network depth. Regional chapters cover municipal permit frameworks, type approval requirements and local assembly incentive schemes by market. Fleet analysis quantifies vehicle life, replacement cycles and total cost per ride economics. Cost analysis tracks cell, aluminium and certification exposure across product classes and channels.
Unit shipment and pricing detail by product class
Municipal permit stability scoring across major cities
Certification coverage mapping by manufacturer and market
Fleet vehicle life and replacement cycle economics
Competitive position assessments across twenty global manufacturers
Local assembly incentive analysis by emerging market

Built For The People Who Decide

From boardroom strategy to bench-side execution, this report is read cover-to-cover by leaders shaping the next decade of their industry, turning demand scenarios, market dynamics and valuation benchmarks into decisions.
CXOs/ Presidents/ VPs/ Managers
M&A and Corporate Development
Strategy Teams and R&D Heads
Procurement and Product Directors
Regulatory and Compliance Leaders
Investor Relations and Equity Analysts