Market Minds Advisory
Digital Twin Market

Digital Twin Market: Digital Twin: Process Optimisation Now Outpaces The Product Design Use Case That Started It

A commercial reading of digital twin software, where process optimisation grows faster than the product design use case that started the category, and integration cost with legacy systems decides which vendors get deployed.

Lead Analyst

Victor Gallo

Published

August 2026

Make Smarter Decisions with Customized Research Insights

Request a free sample report and evaluate market opportunities, growth trends, and competitive dynamics relevant to your business needs.

2025 MARKET VALUE$14.8BMarket Size 2025
2036 FORECAST VALUE$48.5BBase Case , 2026 to 2036
CAGR 2026 TO 203611.4 %Bull 12.7% / Bear 10.1%
INCREMENTAL OPPORTUNITY$32.0BNet 10- year value creation
EXPANSION MULTIPLE2.94x2036 value over 2026 base
Strategic Levers
M&A Pipeline
Regional Outlook
Country Rankings
Competitive Intelligence
Segmental Deep-dive
Call-Us : 91 93563 13602

Executive Snapshot and Market Trajectory.

Process optimisation now grows faster than the product design work that originally started and defined this whole category, as manufacturers increasingly chase live operating savings rather than better upfront engineering models alone. Buyers increasingly judge vendors on measured plant output, not on rendering quality or demonstration polish today.
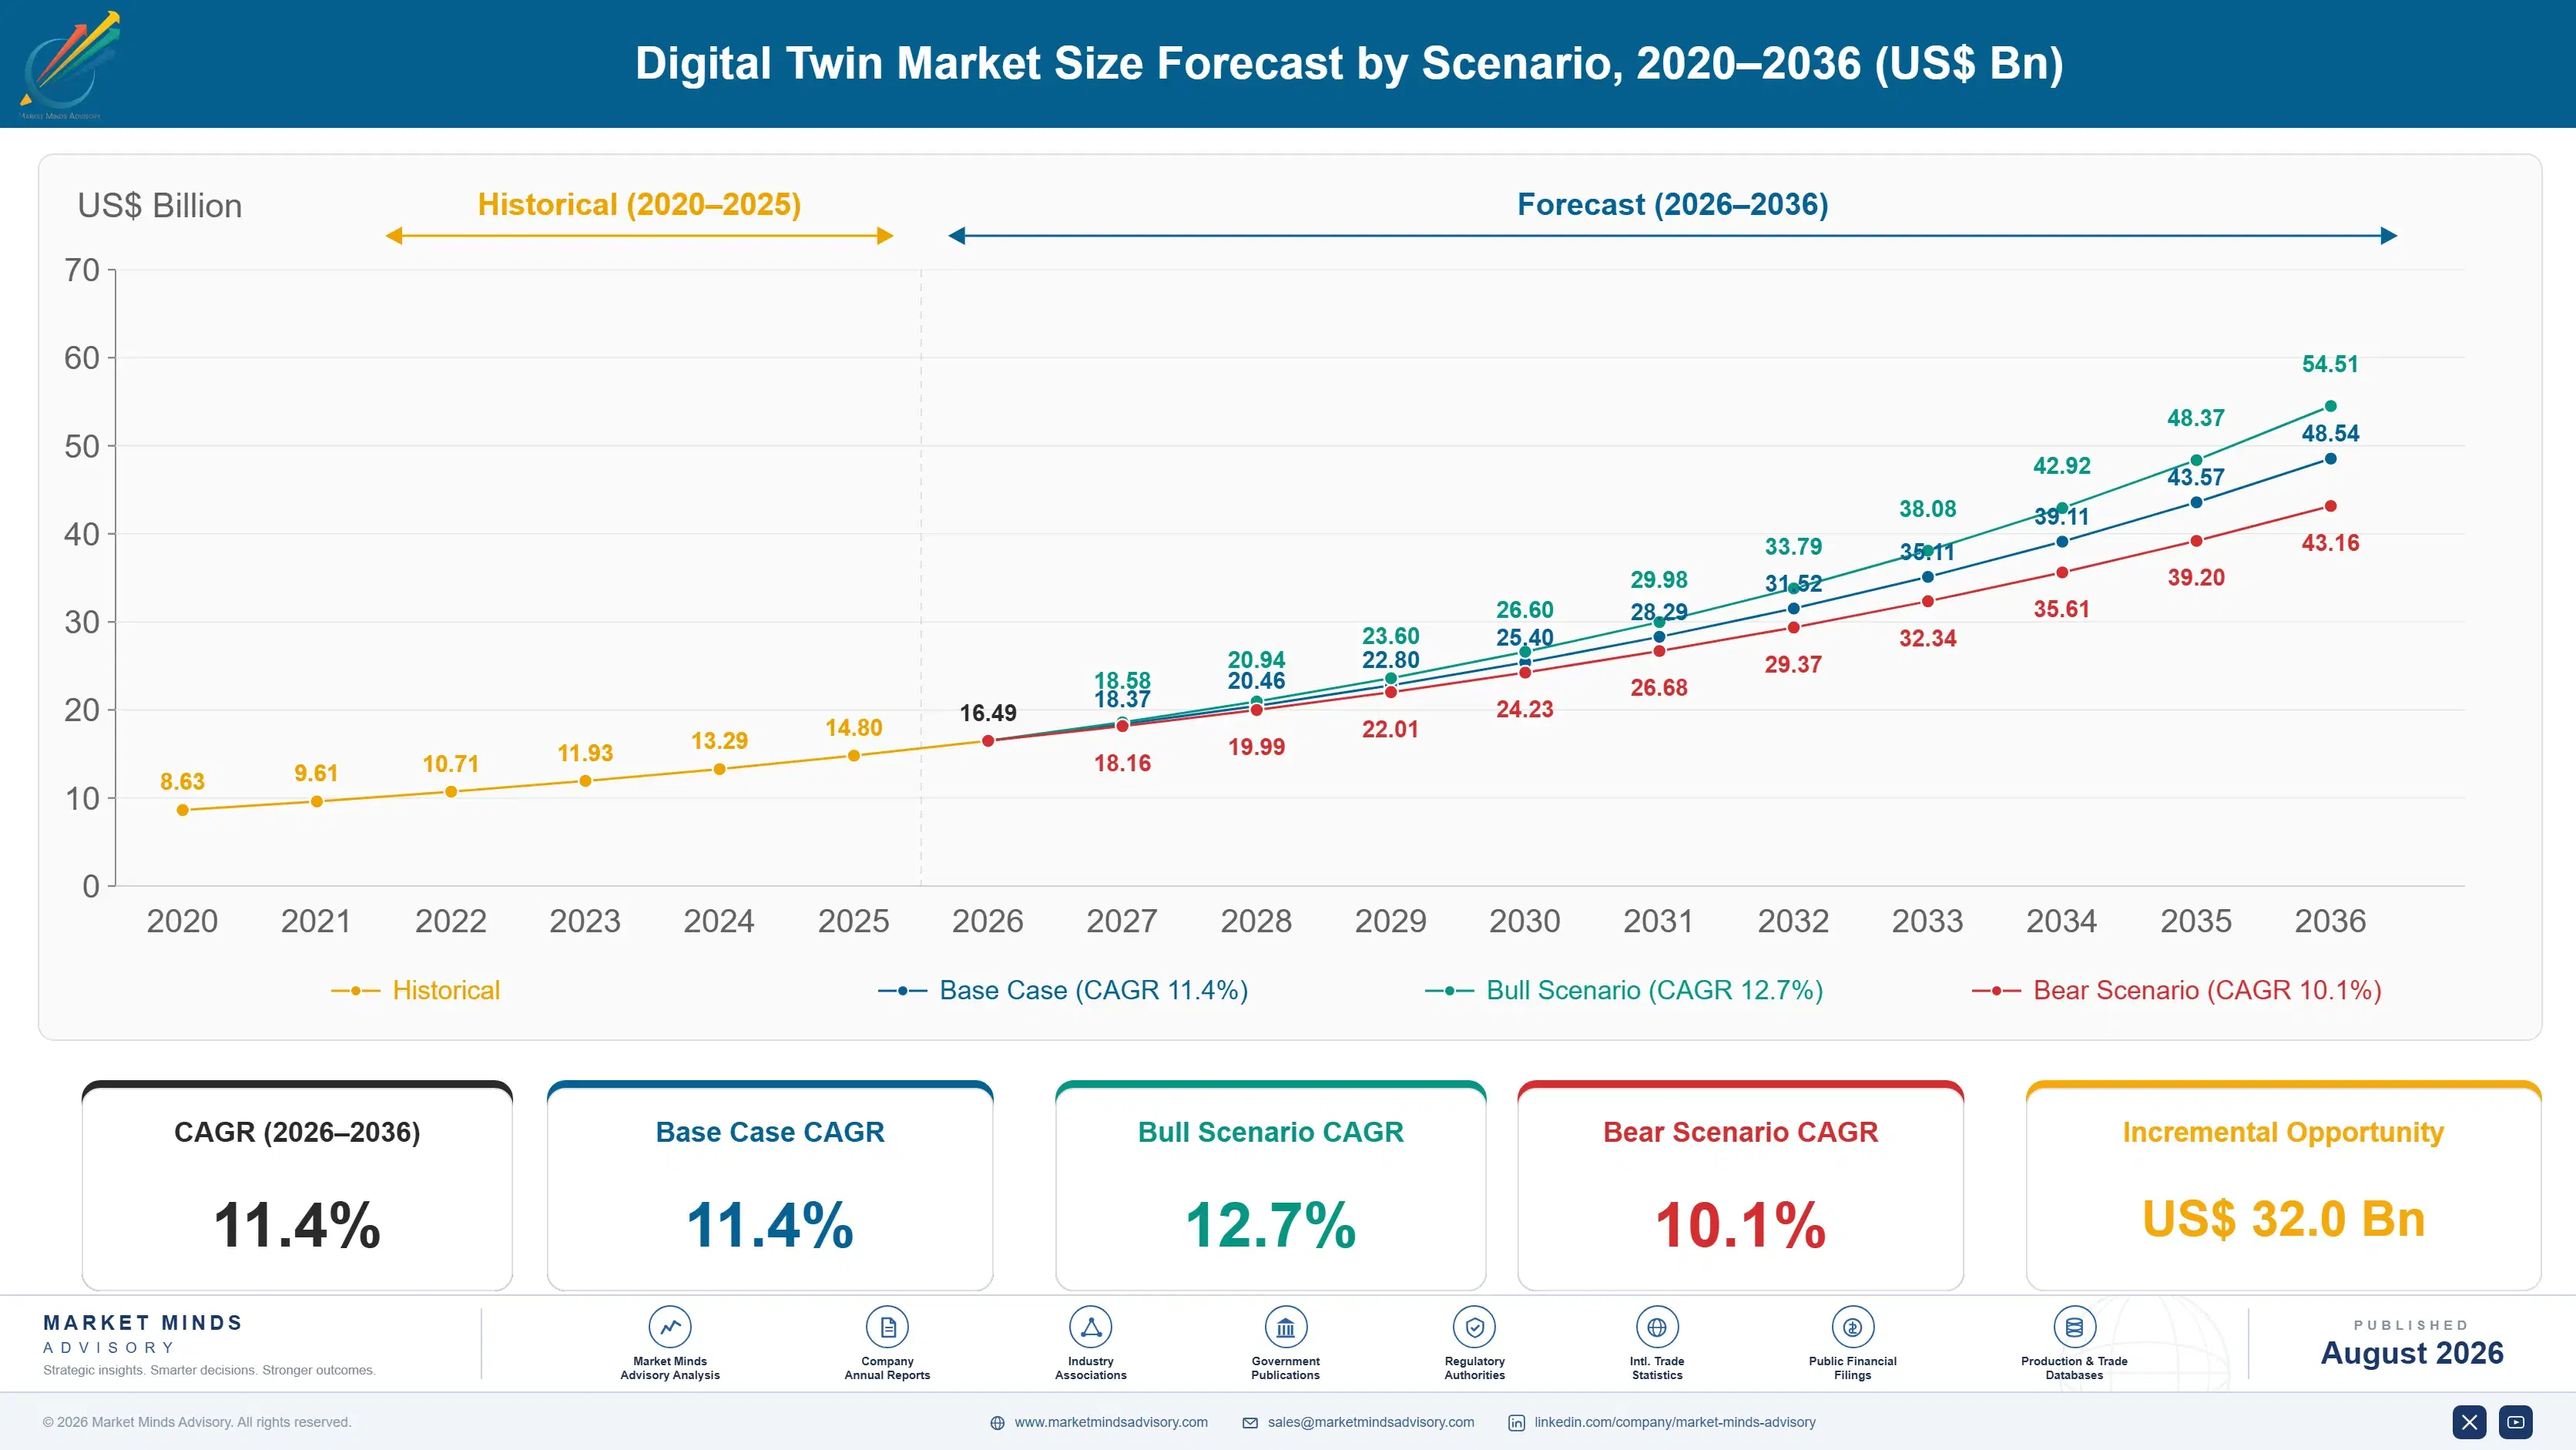
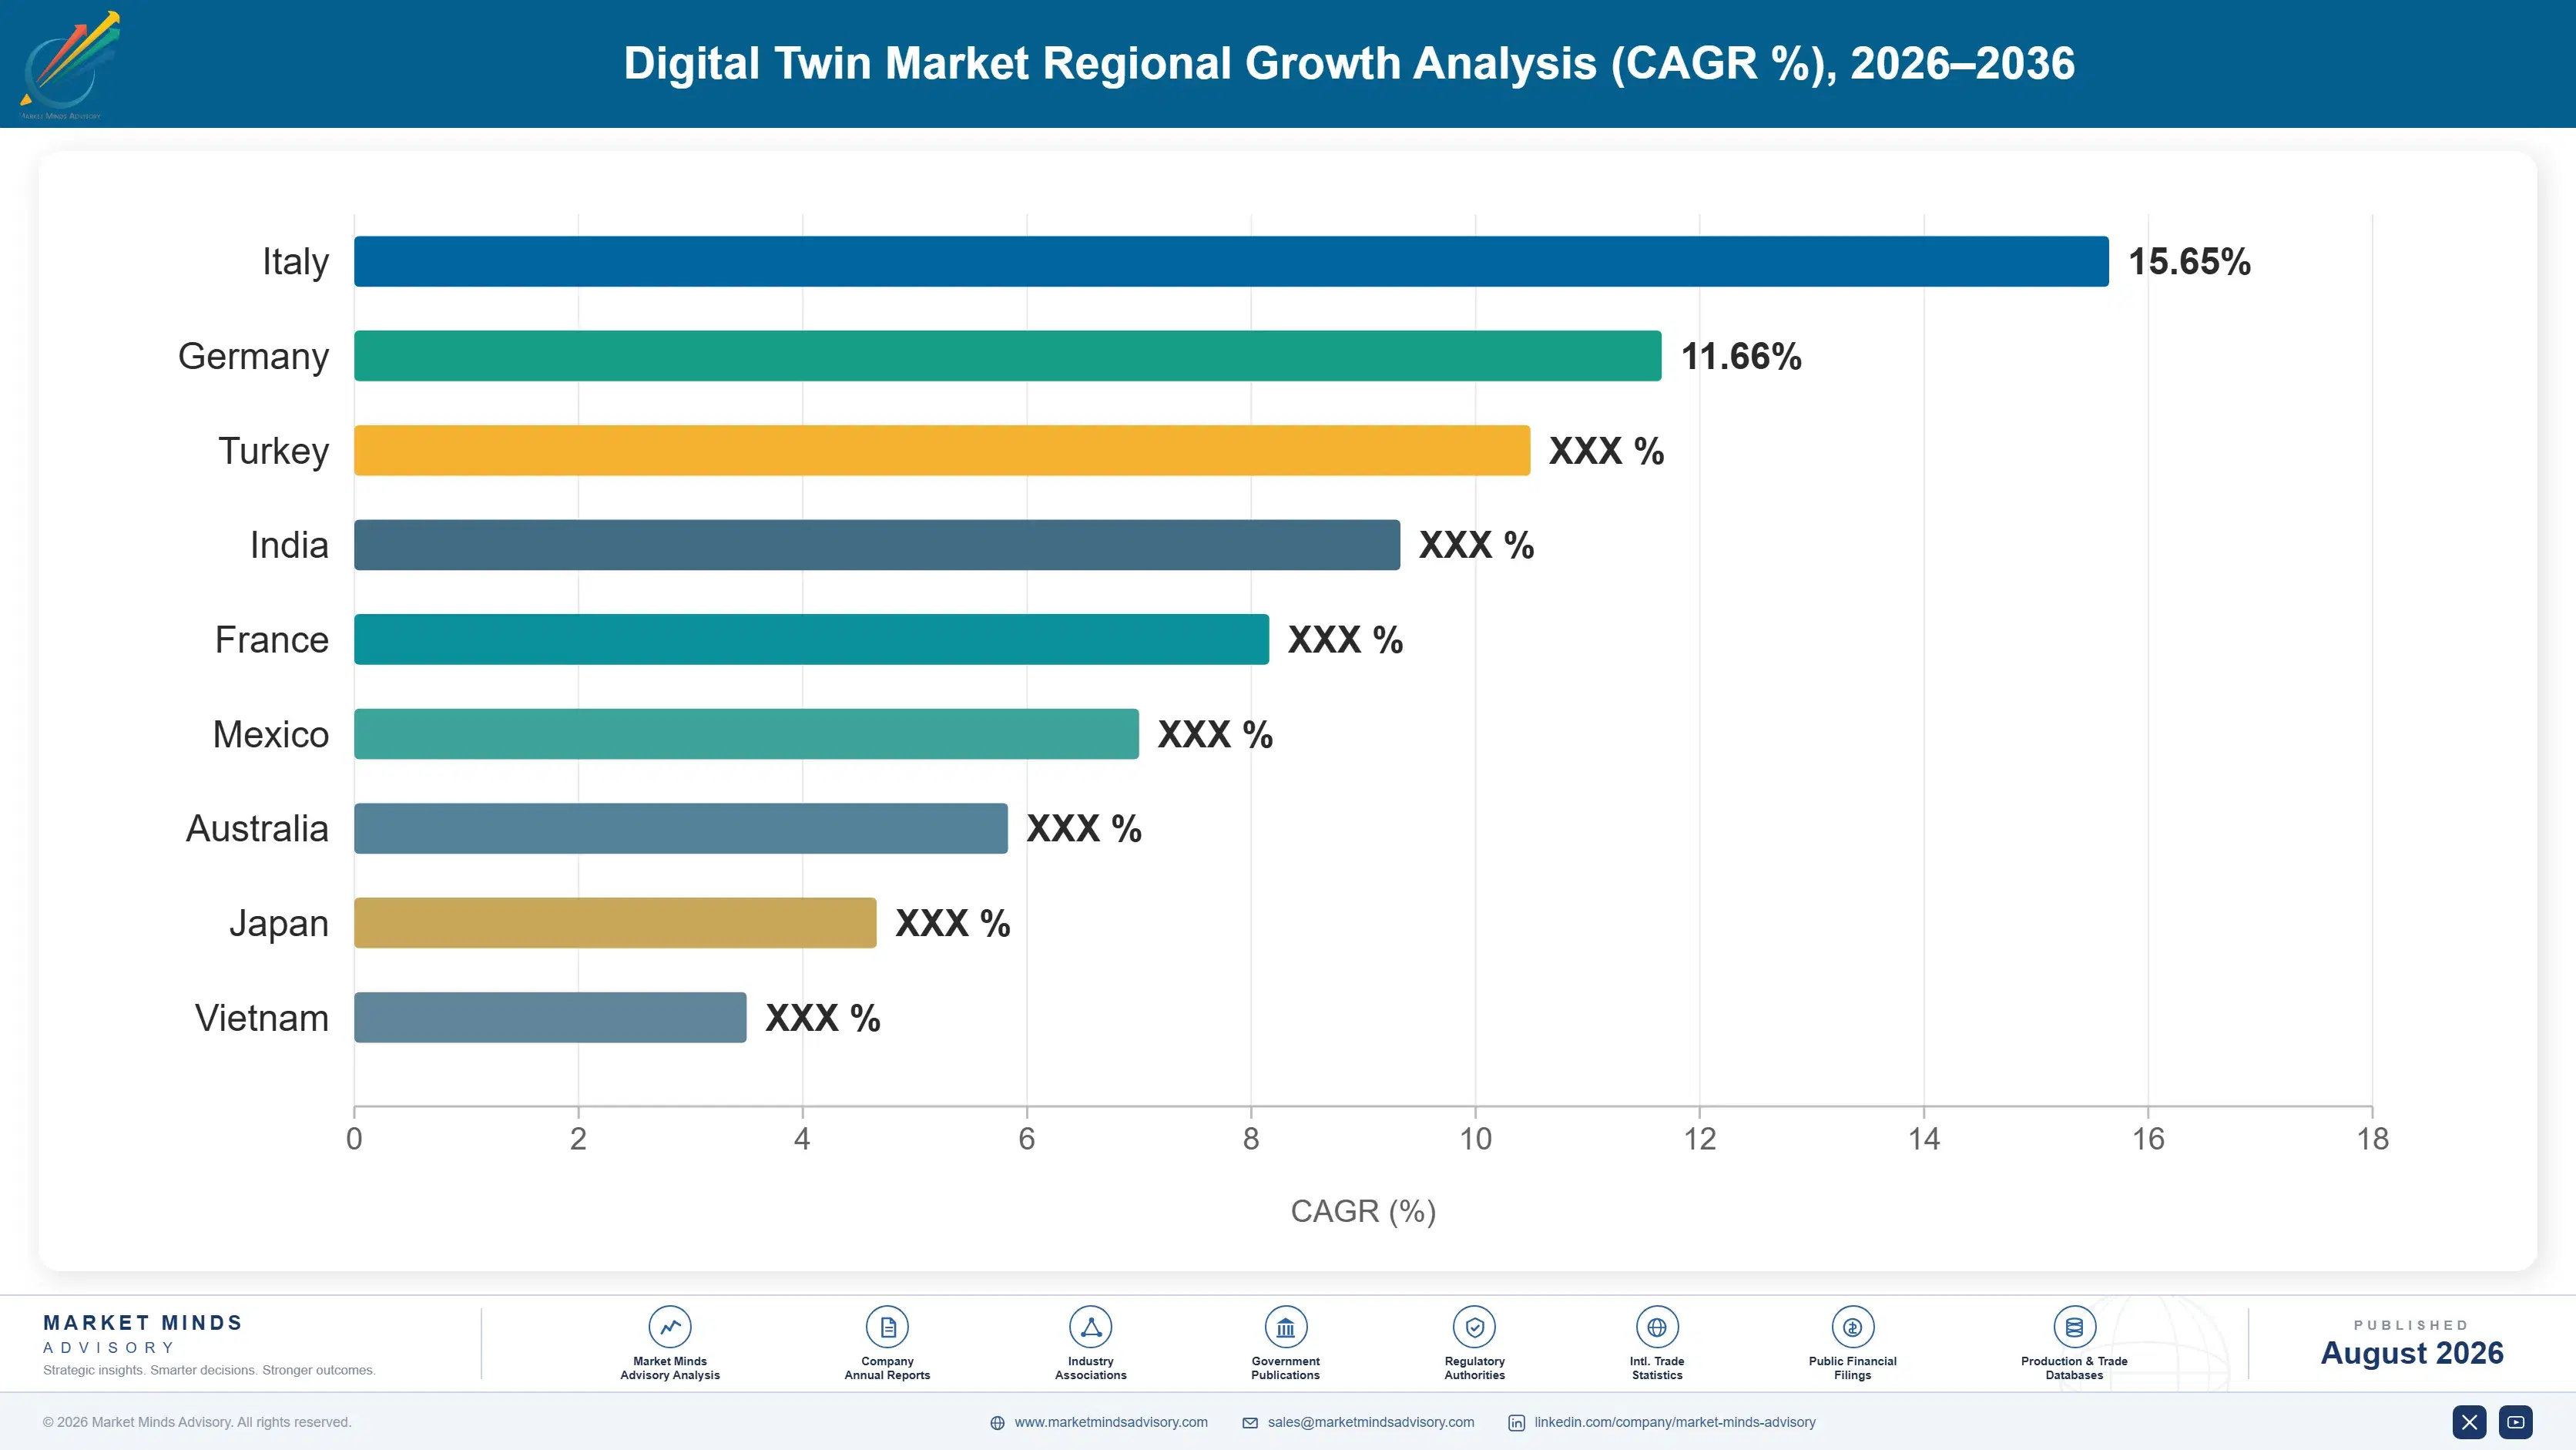
The market stands at USD 14.8 billion in 2025 and reaches USD 48.53 billion by 2036 at an 11.4% CAGR. Process digital twins grow fastest at 16.8%, about 1.47 times the overall rate, as manufacturers connect live sensor data to simulation models for real-time optimisation. North America holds the largest share at 28% on industrial software concentration, while South Korea posts the quickest national growth at 15.6% on smart factory investment.
Concentration sits at CR5 of 46%, reflecting an industry where platform breadth and integration depth increasingly separate leaders from point-solution challengers. Two forces now reshape the field. Integration cost with legacy plant control systems has become the actual gating factor on deployment speed, and artificial intelligence layered onto simulation models is turning static twins into predictive tools that change what buyers expect a twin to do.
Market Definition
The digital twin market covers software platforms and services that create and maintain a live, data-connected virtual representation of a physical product, process, or system for simulation, monitoring, and prediction. It includes product, process, and system digital twins, platform and integration software, simulation and physics modelling engines, and directly attached consulting and integration services. Sensor and IoT hardware sold independently, generic 3D CAD authoring without live data connection, and enterprise resource planning software are excluded.
Base Year Value
$14.8B in 2025 (MMA Primary Research Dataset, August 2026)
Forecast Period
2026 to 2036, eleven discrete annual values
CAGR
11.4% base case. Bull 12.7%. Bear 10.1%.
Fastest Growth Segment
Process Digital Twins: 16.8% CAGR
Fastest Growth Country
South Korea: 15.6% CAGR
Fastest Growth Region
South Asia and Pacific: 13.6% CAGR
Largest Region
North America: 28% of 2025 global value
Market Leaders
Siemens, Dassault Systemes, PTC, ANSYS, AVEVA. Source: MMA Analysis based on company annual reports.
Primary Survey
n=3,800 procurement and R&D decision-makers, Q4 2025, six countries
Methodology
Demand-side build-up, cross-validated against public data, 47 expert interviews

Digital Twin Market Forecast Scenarios

digital-twin-market-size-forecast-scenario-1787324302082
Growth from 2020 to 2025 compounded near 9.9%, starting from product design applications in aerospace and automotive before manufacturing process twins and artificial intelligence integration accelerated adoption sharply from 2023 onward across most major industrial markets. Early deployments proved value slowly, and momentum only built once measurable plant-level savings began circulating widely among industrial buyers.
Three mechanisms carry the base case to 11.4%. First, process optimisation: manufacturers connect live sensor data to simulation models to cut downtime and energy use in ways product-only twins never addressed. Second, artificial intelligence integration, as predictive and generative models layered onto simulation turn static twins into tools that recommend action rather than only display state. Third, infrastructure and city-scale twins, where utilities and municipal operators model grids and transport networks for planning and resilience.
The bull case at 12.7% assumes artificial intelligence integration accelerates deployment across mid-market manufacturers who previously found digital twins too complex to justify. The bear case at 10.1% assumes integration cost with legacy plant control systems continues limiting deployment speed, and that artificial intelligence hype cycles cool enterprise buying committees before measurable returns are demonstrated at comparable scale across most industries.

Why Integration Cost Now Gates Deployment Speed

Three forces set demand. Process optimisation provides the fastest-growing layer, as manufacturers connect live data to simulation models for measurable operating savings rather than design-stage review alone. Artificial intelligence integration provides a second layer, turning twins from passive monitoring tools into systems that recommend or automate corrective action. Infrastructure and city-scale twins provide a third, smaller but growing layer as utilities and municipal operators model comp
MARKET CONCENTRATIONCR5: 46%Moderately concentrated among broad industrial software platform vendors
TYPICAL DEPLOYMENT TIMELINE6 to 18 monthsTime from contract signature to live production twin operation
INTEGRATION COST SHARE25 to 40%Total project cost spent connecting twins to existing plant systems
MEASURED ROI PAYBACK PERIOD12 to 24 monthsTypical timeline for a twin to recover deployment cost
TOP ADOPTING COUNTRY SHAREUnited States: about 24%Global digital twin software spending concentrated in one country
MANUFACTURING END-USE SHAREAbout 38%Total spending concentrated within manufacturing process applications specifically
The commercial character is decided by integration cost rather than by software licensing price. A twin connected poorly to legacy plant control systems delivers little value regardless of simulation sophistication, and integration now consumes 25% to 40% of total project cost. That is why vendors with proven industrial integration experience defend share that pure simulation software competitors struggle to match on capability alone.
The next decade turns on two things. Whether artificial intelligence integration genuinely lowers the expertise barrier that has kept mid-market manufacturers from adopting digital twins at scale. And whether measured return on investment data, still inconsistently documented across the industry, becomes standardised enough that buying committees can compare vendors on outcomes rather than on demonstration quality alone.
"Everyone still sells the digital twin on the simulation. Nobody buys it for the simulation. They buy it because a plant manager can finally see why line four keeps stopping, and that answer has to survive contact with forty-year-old control systems first."
Director, Industrial Software Practice · MMA Technology / Industrial Software an

Market Trends

Artificial Intelligence Turns Static Twins Into Predictive Tools

Predictive and generative artificial intelligence models layered onto simulation engines increasingly let digital twins recommend corrective action rather than only display current state, shifting the category toward a decision-support system. Vendors including Siemens and PTC have integrated machine learning capability directly into their platforms, allowing twins to flag anomalies and suggest maintenance timing before failures occur on the plant floor. This shift is lowering the specialised simulation expertise historically required to extract value, since natural language interfaces increasingly let operators query the system directly. Early adopters report meaningfully faster time to measurable value.
Market Impact: Payback now runs 24 months
Process Optimisation Overtakes Product Design As Primary Use Case

Manufacturers are increasingly deploying digital twins against live production processes rather than only product design, connecting sensor data streams to simulation models that identify downtime causes and energy waste in near real time. This shift reflects a maturing buyer base that has moved past design-stage novelty toward operational return on investment measured in avoided downtime and reduced energy consumption. Process twins now represent the fastest-growing category by a considerable margin, and vendors originally built around design-stage simulation are extending platforms into live operational monitoring to avoid losing share to process-native rivals entirely.
Market Impact: Government funding lifts adoption 1

Market Opportunities and Growth Drivers

Measured Operating Savings Justify Expanding Deployment Budgets

Manufacturers running process digital twins increasingly report measurable reductions in unplanned downtime and energy consumption, and these documented savings are what expand budgets for further deployment across additional production lines rather than any simulation capability improvement alone. Typical payback periods of twelve to twenty-four months make the investment case considerably easier for plant-level budget approval than the multi-year payback horizons earlier product-design twins often required to justify. This has shifted purchasing conversations from IT and engineering departments toward operations leadership directly, who control budget tied to measurable production outcomes rather than design efficiency metrics that rarely surface in quarterly reporting.
Market Impact: Integration eats 40% of budget

Smart Factory Government Programmes Fund Adoption Directly

National manufacturing competitiveness programmes in South Korea, Germany, and China are directly funding digital twin adoption among small and mid-sized manufacturers who would otherwise lack the capital or technical expertise to deploy independently. These programmes typically combine grant funding with vendor partnership requirements, creating a channel that established platform vendors are increasingly building dedicated government relations capability around. South Korean manufacturing competitiveness funding specifically has pulled deployment timelines forward considerably relative to markets without comparable public support, demonstrating how directly policy can accelerate category adoption when funding removes the capital barrier facing smaller manufacturers.
Market Impact: Unclear ROI delays deals 9 months

Market Restraints and Challenges

Legacy System Integration Consumes Disproportionate Project Cost

Connecting a digital twin to decades-old plant control systems, programmable logic controllers, and disparate sensor networks now consumes 25% to 40% of total project cost, often exceeding the cost of the simulation software itself. The root cause is that industrial control systems were never designed for the real-time data streaming a modern twin requires, and retrofitting communication capability onto legacy hardware demands specialised integration expertise that remains scarce. Commercially this extends deployment timelines well beyond initial vendor estimates and erodes the return on investment case. Vendors respond with pre-built integration connectors and dedicated integration service teams.
Market Impact: AI-enabled twins cut setup time 30%

Return On Investment Data Remains Inconsistently Documented

Buying committees evaluating competing digital twin vendors frequently cannot compare return on investment claims reliably, since measurement methodology varies considerably across vendors and few independent benchmarks exist for typical outcomes. The root cause is that the category is still young enough that no standardised measurement framework has emerged, and vendors naturally report outcomes using methodology favourable to their own platform's specific strengths. Commercially this slows enterprise buying decisions, as risk-averse committees delay commitment until comparable evidence becomes available. Vendors respond with published case studies, audited pilot programmes, and standardised reporting frameworks.
Market Impact: Process twins grow at 16.8% now
3 additional market trends, 4 additional growth drivers, and 3 additional restraints and challenges are covered in the full report. Contact sales@marketmindsadvisory.com to access the complete intelligence.

Segment CAGR and Growth Architecture

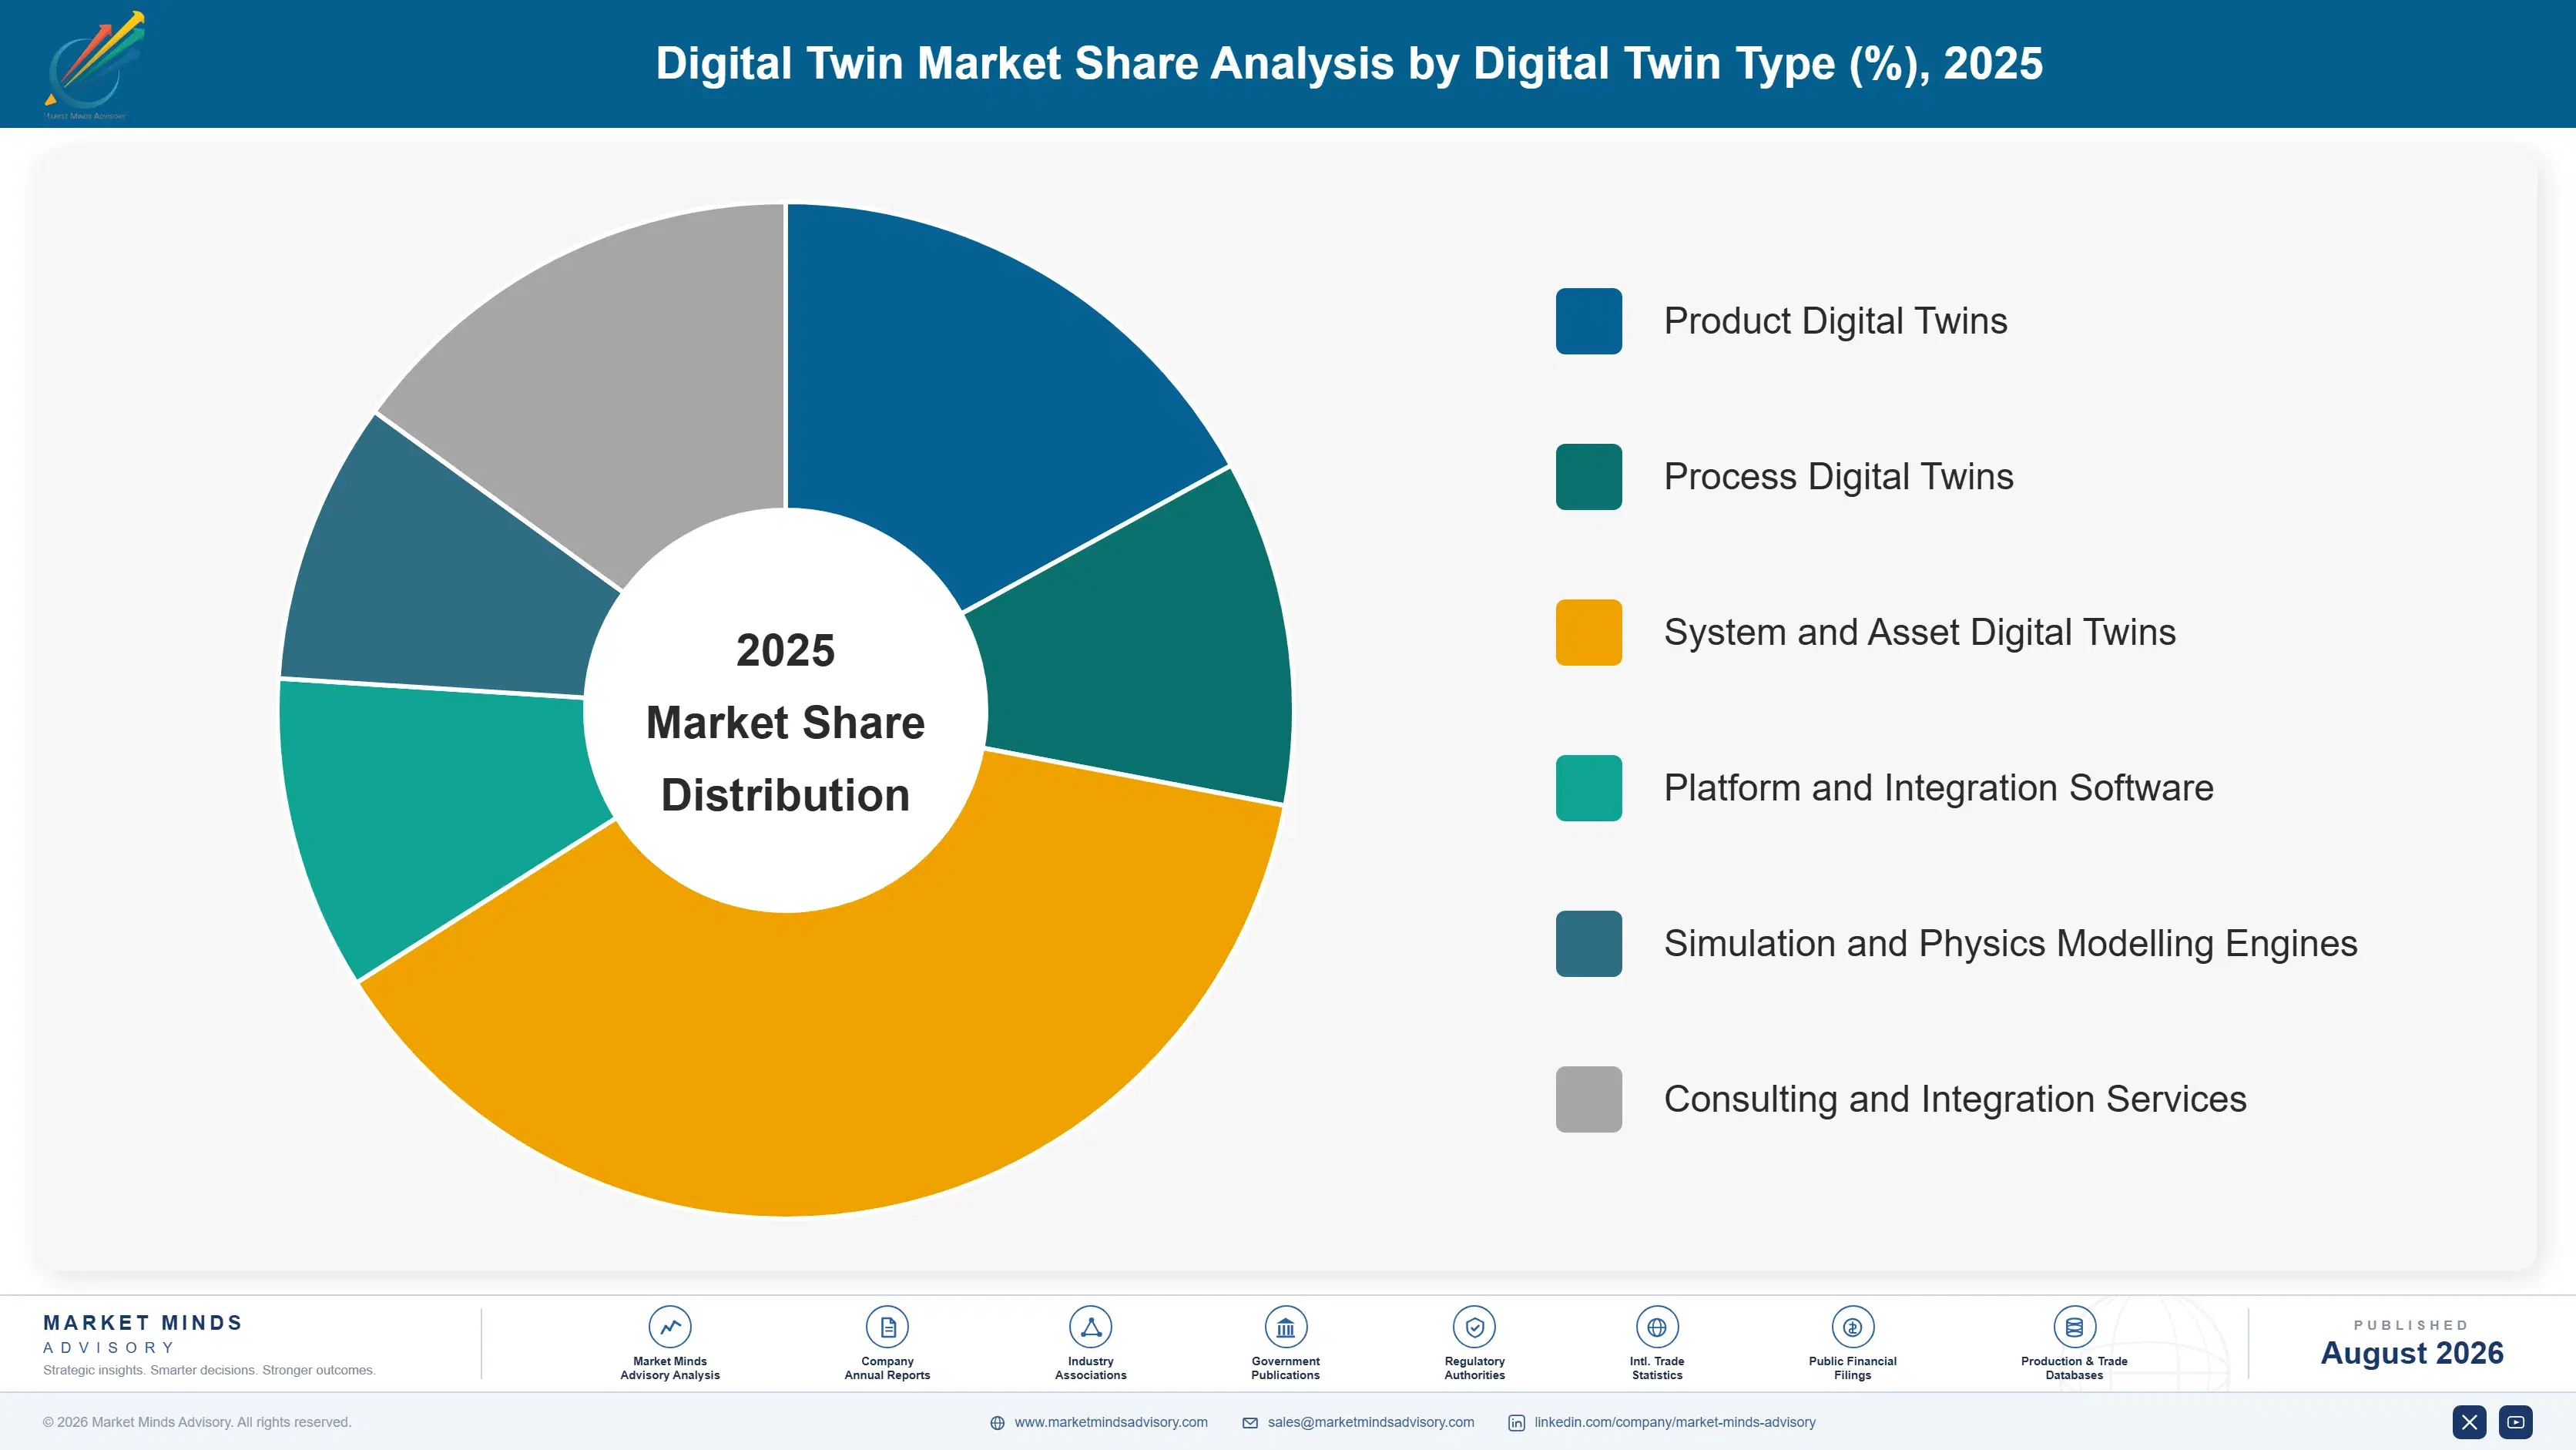
Segmentation follows digital twin type, a single classification logic describing what physical entity the twin represents and maintains a live connection to. Platform software, simulation engines, and services sit separately within the framework, since the same process twin can be built on different platform and engine combinations depending on buyer preference, budget, and existing vendor relationships.
digital-twin-market-market-share-analysis-1787324302620

Process Digital Twins

Process digital twins grow fastest at 16.8%, about 1.47 times the overall 11.4% rate, covering live simulation models connected to manufacturing production lines, chemical processes, and industrial operations for real-time monitoring and optimisation. Manufacturers increasingly deploy these against live operations rather than only design-stage review, connecting sensor data streams to identify downtime causes and energy waste that static models could never surface. Typical payback periods of twelve to twenty-four months make the investment case easier to justify at the plant level than earlier design-focused twins required. Siemens, AVEVA, and Rockwell Automation hold strong positions, having invested early in industrial protocol integration that newer entrants still work to replicate across legacy plant control systems in active use.
CAGR 16.8%

System and Asset Digital Twins

System and asset digital twins grow at 14.2%, the second-fastest category, as utilities, transportation operators, and infrastructure managers model complex physical networks including power grids, rail systems, and building portfolios for planning and resilience purposes. This category serves a fundamentally different buyer than product or process twins, typically public sector or regulated utility procurement with longer sales cycles but considerably larger individual contract values once secured. Bentley Systems and Hexagon hold strong positions here, having built infrastructure-specific modelling capability over decades of civil and geospatial engineering software development. Growth concentrates in markets facing acute grid resilience or urban planning pressure, particularly where extreme weather has already demonstrated the cost of inadequate infrastructure modelling.
CAGR 14.2%
Full segment breakdown across 6 segments available in the complete report.

Regional Architecture and Country Demand Map

Industrial software concentration and manufacturing digitalisation policy together set this overall distribution more than raw manufacturing output alone ever really could. North America leads on software vendor concentration, while the fastest growth sits in South Asia and Pacific under South Korean smart factory investment specifically.

North America

Industrial software vendor concentration, more than manufacturing output alone, defines this 28% share. United States manufacturers, aerospace primes, and utilities are the largest single buyer group globally, with process twin adoption accelerating fastest among automotive and semiconductor manufacturers facing acute competitive pressure. Canadian utilities are adopting infrastructure-scale twins for grid resilience planning following recent extreme weather events that exposed planning gaps directly and considerably. Major platform vendors headquartered in the region hold a genuine home-market advantage in enterprise sales relationships built over decades of prior software categories. Growth of 11.8% reflects both process twin expansion and infrastructure-scale adoption accelerating together. Vendor headquarters concentration increasingly shapes where new platform capability launches first.
Share: 28% | CAGR: 11.8% (2026 to 2036)

Western Europe

German manufacturing depth and EU industrial policy together define this 24% share. Germany's Industrie 4.0 programme has driven digital twin adoption among manufacturers for nearly a decade, giving the region a mature deployment base that newer-entrant markets still work to match. French and Nordic utilities lead in infrastructure-scale twin adoption, tied to ambitious grid modernisation and renewable integration targets. EU digital sovereignty policy increasingly favours European platform vendors for public sector and critical infrastructure procurement specifically. Growth of 9.8% is the slowest of the seven, reflecting an already mature manufacturing deployment base growing from considerably larger installed capacity than newer markets carry. Public sector procurement preference increasingly shapes vendor selection outcomes here.
Share: 24% | CAGR: 9.8% (2026 to 2036)
Regional intelligence for 5 additional markets available in the complete report: East Asia, South Asia and Pacific, Latin America, Middle East and Africa, Eastern Europe. Contact sales@marketmindsadvisory.com.
digital-twin-market-country-cagr-analysis-1787324303136

Where Digital Twin Vendors Actually Capture Value

Selling simulation software alone means competing on a capability buyers increasingly treat as commoditised across major platforms and vendors within the same competitive tier. The four moves below shift value toward positions a software-only competitor cannot simply match: integration service depth, measured ROI documentation, government programme positioning, and artificial intelligence layered onto existing simulation cores.

Build Legacy Integration Into A Dedicated Service Line

Integration with legacy plant control systems now consumes 25% to 40% of total project cost, and vendors that build dedicated integration service capability, rather than treating it as an unavoidable cost centre, capture margin that pure software licensing leaves entirely on the table. This service line also creates a durable relationship, since the integration team that connected a plant's legacy systems typically wins the expansion and maintenance contracts that follow across additional production lines. Vendors should staff and market integration expertise as aggressively as simulation capability, since buyers increasingly select on integration confidence over software feature comparison alone.
Market Impact: Integration captures 25% to 40% of

Publish Standardised Measured ROI Documentation Early

Buying committees frequently cannot compare vendor return on investment claims reliably given inconsistent measurement methodology across the industry, and vendors that publish standardised, third-party audited outcome data win specification contests that unverified claims alone cannot. Payback periods of 12 to 24 months are genuinely competitive once documented credibly, but vendors relying on internally generated claims face buyer scepticism that credible external validation removes almost entirely. This transparency investment also shortens sales cycles considerably, since risk-averse committees delay commitment while waiting for evidence quality competitors with published data already provide upfront.
Market Impact: Documented ROI cuts sales cycles 6

Position Early For Government Smart Manufacturing Funding

National manufacturing competitiveness programmes in South Korea, Germany, and China directly fund digital twin adoption among smaller manufacturers, and vendors positioned early as approved programme partners capture disproportionate share of funded deployments relative to those treating public funding as incidental. These programmes typically require dedicated relationship building and compliance documentation that favours vendors who invested in government relations capability years before funding windows actually open. South Korean funding specifically has pulled adoption forward roughly 18% faster among participating manufacturers, demonstrating the commercial value of early positioning in markets where public funding materially changes deployment economics.
Market Impact: Government funding lifts adoption s

Layer Artificial Intelligence Onto Existing Simulation Cores

Vendors adding predictive and generative artificial intelligence capability onto established simulation engines are winning specification contests against both simulation-only incumbents and AI-native entrants lacking industrial domain depth built over years. This approach requires substantially less investment than building simulation capability from scratch, since the physics modelling foundation already exists and artificial intelligence layers primarily add interpretation and recommendation capability on top. Early movers report setup time reductions of roughly 30%, a genuine competitive differentiator in a category where deployment speed increasingly determines which vendor a buying committee ultimately selects among comparable finalists.
Market Impact: AI layering cuts setup time by abou

Who Controls the Margin Pool

Concentration sits at CR5 of 46%, with Siemens, Dassault Systemes, PTC, ANSYS, and AVEVA holding leading positions built on platform breadth and integration depth accumulated across multiple prior software categories. The gap between leaders and point-solution challengers rests on industrial protocol integration experience rather than simulation sophistication alone. All participants are assessed on one basis, annual revenue from digital twin software and directly attached services, excluding CA
Competition runs along three dimensions. First, legacy system integration depth, increasingly the primary factor separating vendors buyers can deploy from those offering compelling demonstrations alone. Second, measured return on investment documentation, which shortens sales cycles for vendors who invest in credible third-party validation. Third, artificial intelligence integration, layered onto simulation cores rather than built as a separate standalone product.

Pressure is building from Chinese domestic platform vendors gaining credibility in manufacturing twins, narrowing a technology gap established Western providers assumed would persist much longer. Meanwhile AI-native entrants without deep industrial protocol expertise are struggling to match incumbent integration capability despite faster model cycles. Rankings should favour vendors with proven integration track records and credible ROI documentation over those demonstrating capability primarily through polished visuals.
digital-twin-market-company-positioning-matrix-1787324303657

Competitive Moat and Risk Dimensions

SIEMENS

Moat: Xcelerator platform breadth and scale

Siemens combines simulation software, industrial automation hardware, and a broad partner network into a single Xcelerator platform that few competitors can match in integration breadth. Its decades of industrial automation experience give it protocol integration depth pure software vendors lack. Global manufacturing customer relationships built across prior automation product generations provide a direct channel into expansion sales.
SIEMENS

Risk: Platform complexity slows adoption

The breadth that differentiates Siemens also makes its platform more complex to deploy than narrower point solutions, which can slow adoption among mid-market manufacturers seeking faster time to value. Specialist process twin vendors are winning some deals purely on simpler deployment against Siemens' heavier platform. Chinese domestic vendors are narrowing the integration gap faster than expected in manufacturing applications.
DASSAULT SYSTEMES

Moat: Product design heritage and depth

Dassault Systemes holds the deepest product design simulation heritage in the category, spanning aerospace, automotive, and industrial equipment relationships built over decades through its 3DEXPERIENCE platform. This design-stage strength provides a natural expansion path into process and system twins for the same enterprise customers. Strong aerospace and automotive vertical expertise differentiates it clearly from generalist industrial software competitors.
DASSAULT SYSTEMES

Risk: Process twin position trails leaders

Dassault Systemes entered process-focused digital twins later than Siemens and AVEVA, leaving it behind on the fastest-growing category within the broader market. Its design-stage heritage, while a genuine strength, means some manufacturing buyers perceive it as a product engineering vendor extending into operations rather than an operations-native platform. Competitors with earlier process twin investment hold better documented ROI case studies.

Players Tracked

Prominent Players

Siemens
Dassault Systemes
PTC
ANSYS
AVEVA

Other Key Players

Bentley Systems
Microsoft
IBM
GE Digital
Autodesk
Oracle
SAP
Hexagon AB
Rockwell Automation
NVIDIA
Cityzenith
Unity Technologies
Altair Engineering
Schneider Electric
Emerson Electric

Recent Developments

FEBRUARY 2025

PTC integrates generative AI capability into ThingWorx platform

PTC announced integration of generative artificial intelligence capability into its ThingWorx digital twin platform, enabling natural language querying and automated anomaly detection for manufacturing customers. This was an organic development rather than an acquisition or joint venture, building on internal AI research investment made over the prior two years.
Signal: Platform vendors are racing to make AI cap
SEPTEMBER 2024

AVEVA acquires industrial integration software specialist

AVEVA completed the acquisition of a specialist developer of industrial protocol integration software, adding pre-built connectors for legacy plant control systems that had previously required custom integration work. This was a full acquisition bringing the target's connector library and engineering team fully inside AVEVA's platform division, not a licensing arrangement.
Signal: Buying integration capability outright sig
MAY 2025

Siemens forms joint venture for smart factory deployment in Korea

Siemens entered a joint venture with a Korean industrial partner to accelerate digital twin deployment among semiconductor and battery manufacturers participating in national smart factory funding programmes. This was a joint venture combining platform technology with the partner's manufacturing relationships and regulatory expertise, not an acquisition.
Signal: Vendors are partnering locally to capture

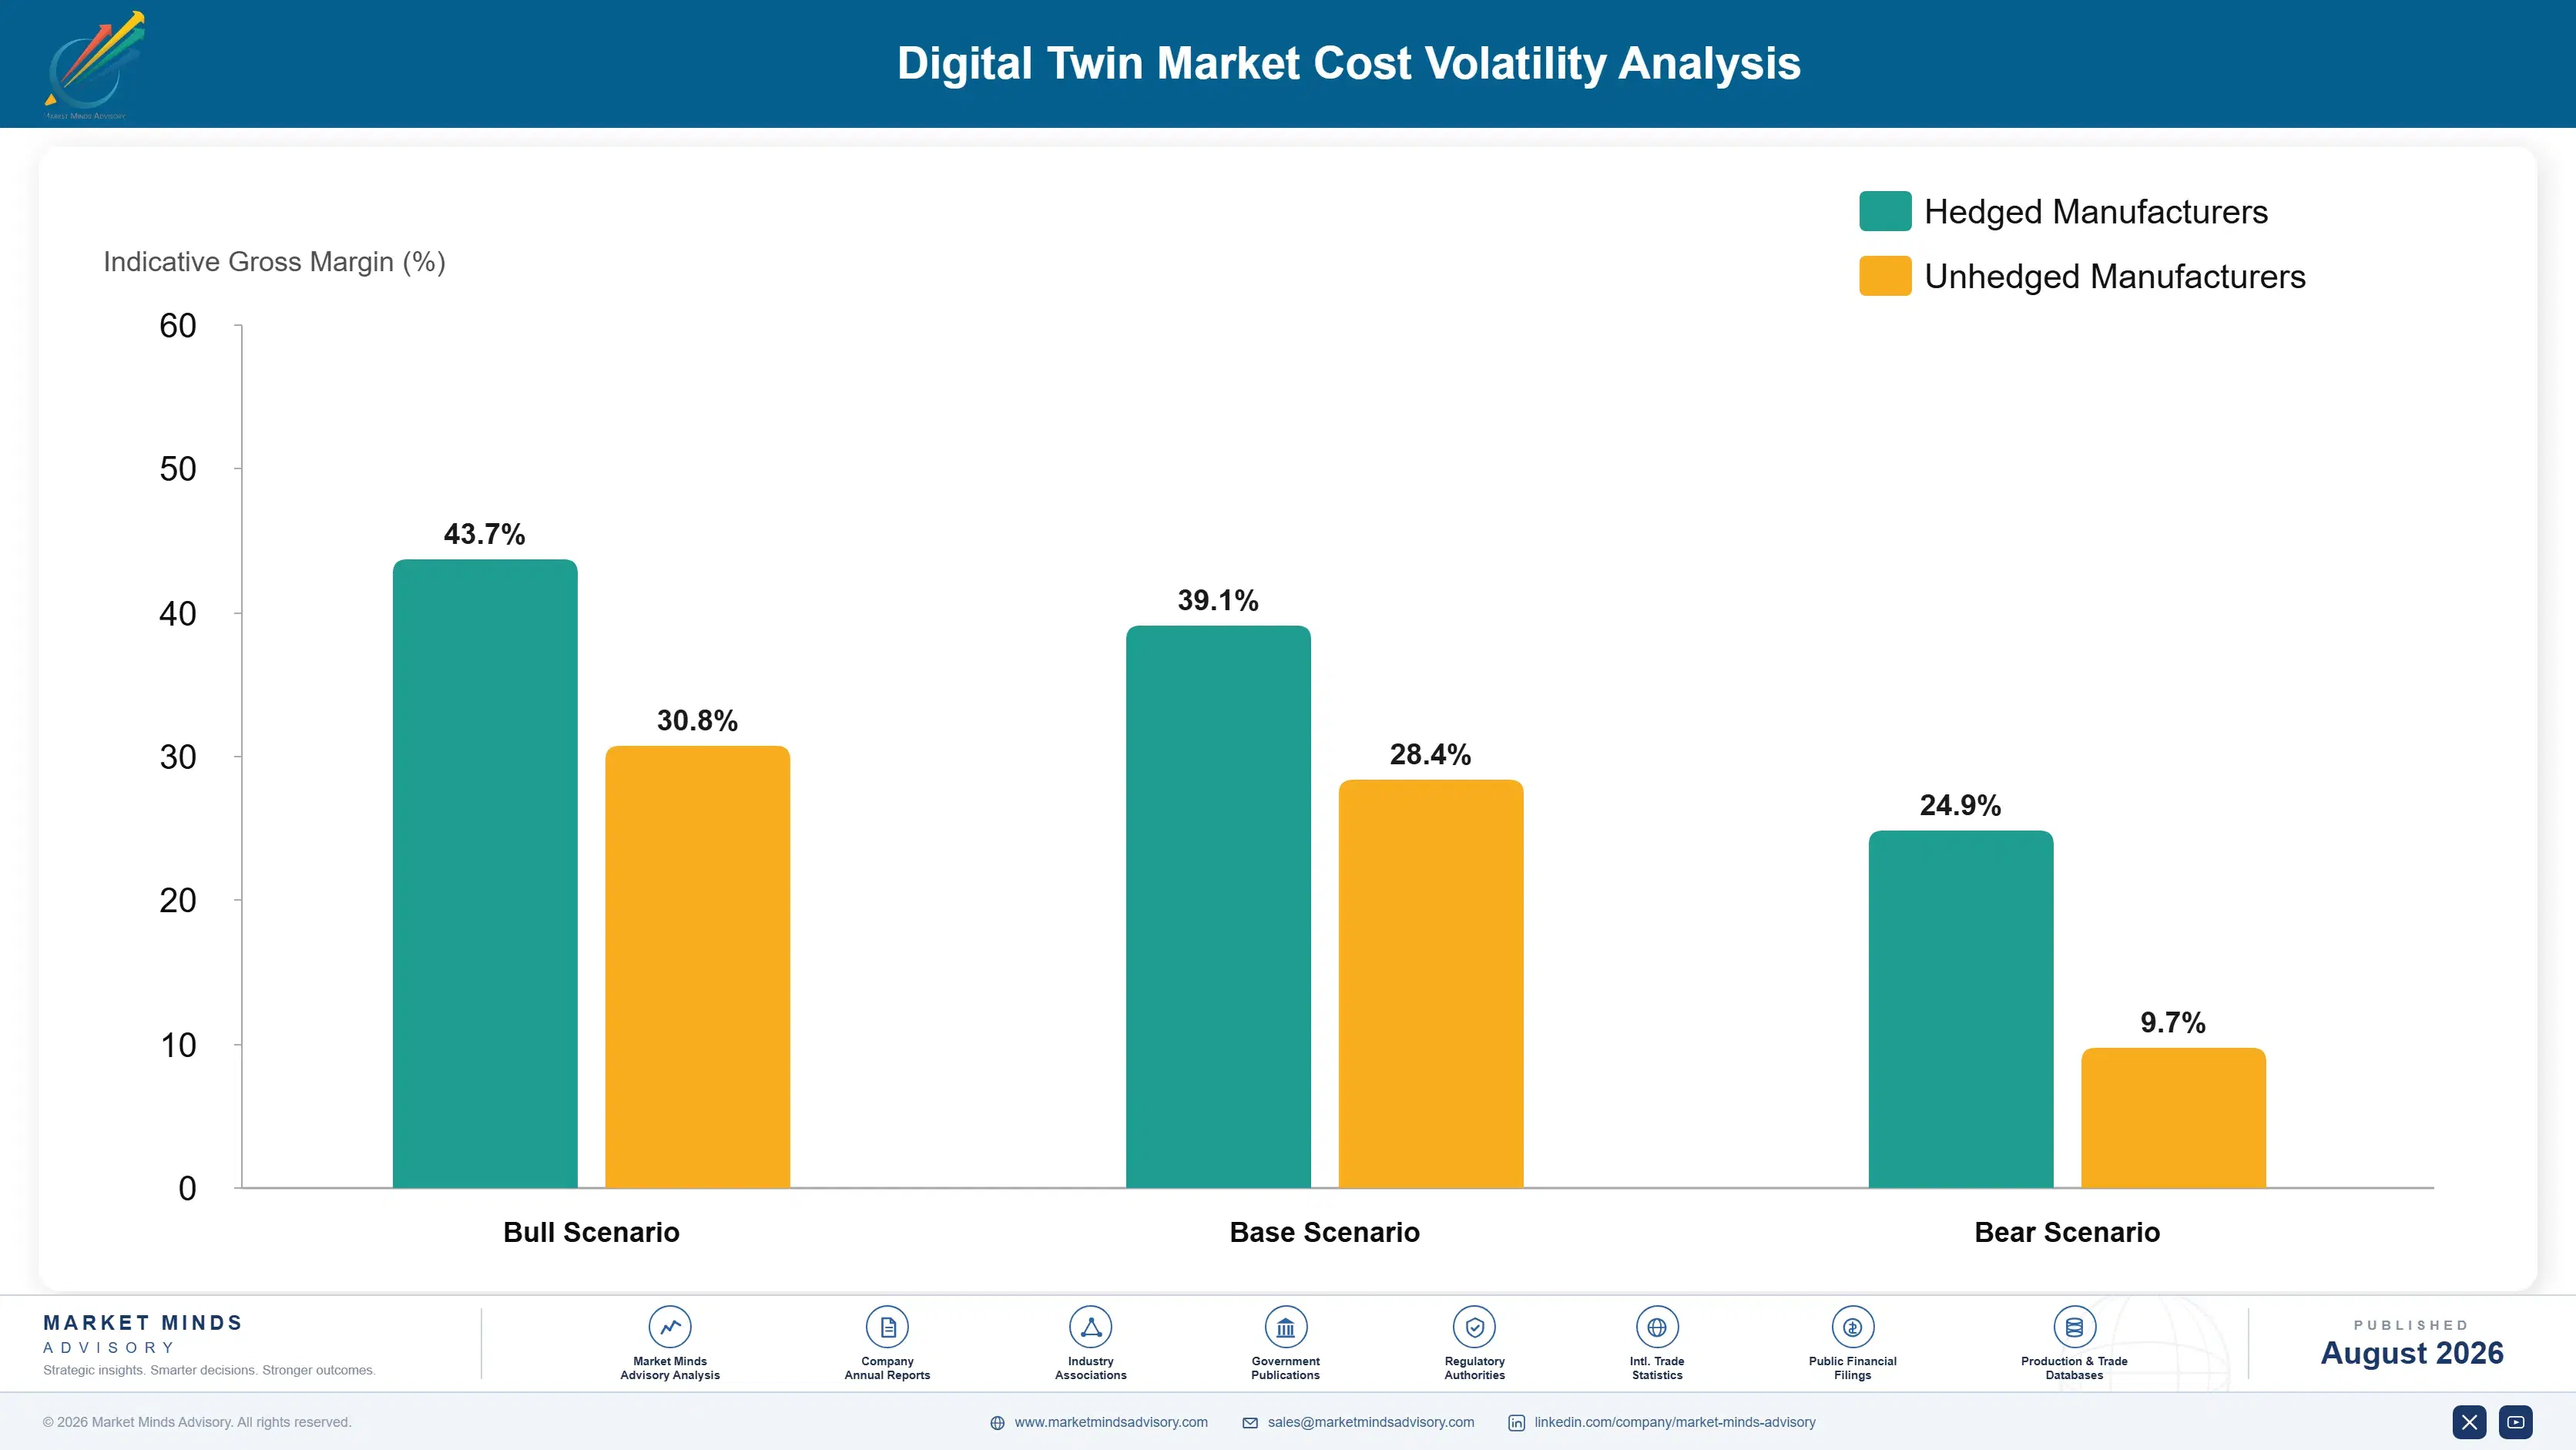
Engineering Talent And Cloud Compute Costs

Specialised engineering talent dominates cost in this category. Simulation and integration engineering staff account for roughly 35% to 48% of cost of goods sold, reflecting how labour-intensive deployment remains despite software licensing scale. Cloud compute and data infrastructure add a further 15% to 22%, while software development and platform maintenance account for 18% to 25% and rising as artificial intelligence capability expands compute requirements.
Specialised talent scarcity has been the sharpest recent pressure. Demand for engineers combining simulation expertise with industrial protocol integration knowledge outpaced available talent supply considerably through 2023 and 2024, according to industry workforce reporting referenced in national technology employment surveys across major markets. Vendors without established training pipelines absorbed meaningful margin pressure through elevated compensation costs that better-positioned competitors with internal training programmes avoided entirely.

Exposure separates by talent pipeline maturity and cloud infrastructure ownership. A vendor dependent entirely on open-market talent hiring faces cost pressure that one with established university partnerships and internal training programmes does not carry, while cloud infrastructure costs scale directly with deployment volume regardless of talent strategy. Vendors with discounted cloud capacity through hyperscaler partnerships manage compute cost better than those paying full public pricing.
digital-twin-market-cost-volatility-analysis-1787324303851

Build internal talent pipelines through university partnerships

Open-market hiring for simulation and integration engineering talent has grown considerably more expensive as demand outpaces supply across the industry. University partnerships and internal training programmes build a talent pipeline that reduces dependence on competitive open-market hiring over time. Vendors that invested in this approach early now recruit at meaningfully lower cost than competitors still relying entirely on external hiring.

Negotiate hyperscaler cloud partnerships at volume

Cloud compute costs scale directly with deployment volume, and vendors paying full public cloud pricing face a cost disadvantage against competitors with negotiated hyperscaler partnerships securing discounted capacity. Volume commitments require confidence in deployment growth smaller vendors may not yet have. Larger platform vendors increasingly use this cost advantage to underprice smaller specialists on infrastructure-intensive deployments.

Standardise integration connectors to reduce custom engineering

Custom integration engineering for each legacy plant system requires specialised, expensive labour that standardised pre-built connectors avoid on repeat deployments across similar plant configurations. Building a connector library requires upfront investment but reduces marginal deployment cost once established across common control system types. Vendors pursuing this systematically build integration economics custom-engineering competitors cannot match.

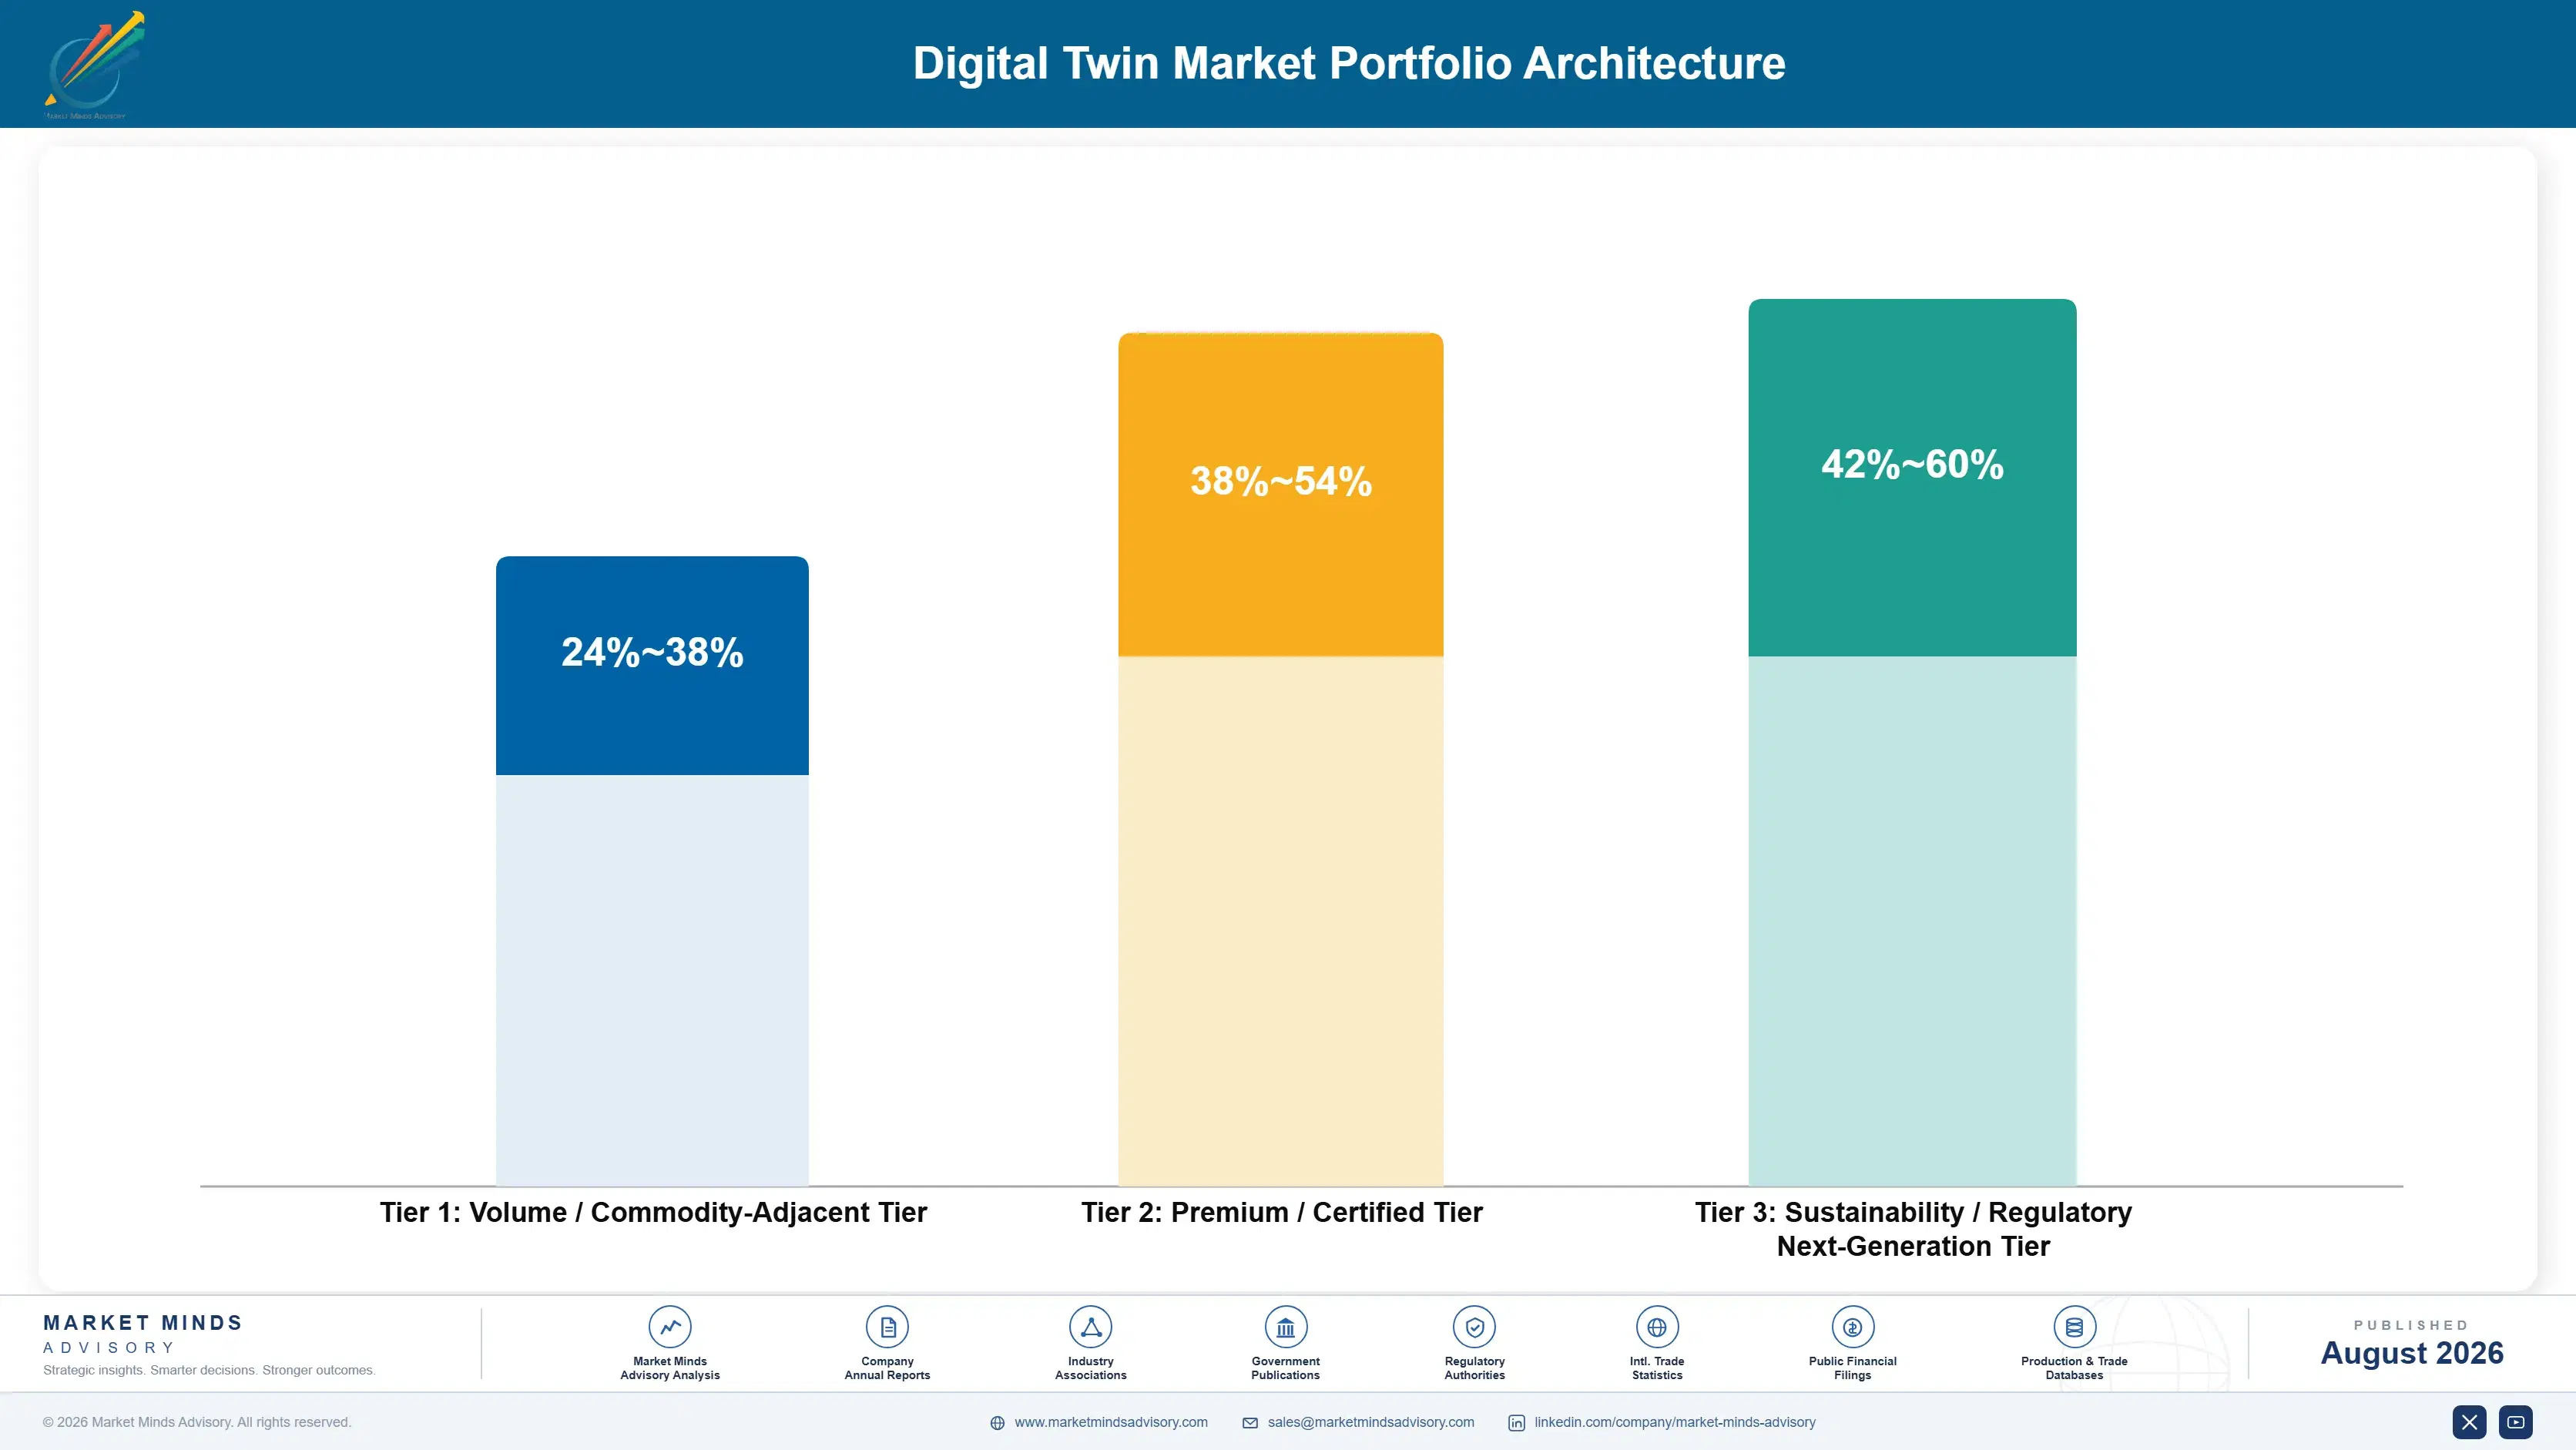
Portfolio Architecture for Margin Defence

The portfolio splits into three tiers with distinct economics. Standardised design-stage simulation software forms the volume tier, increasingly commoditised and competing on price against a widening field of capable vendors. Process and system twins with proven integration track records earn considerably more, since legacy connectivity expertise and documented ROI both resist commoditisation. Artificial intelligence-enabled predictive twins sit differently again, priced against demonstrated cap
The tension runs between defending design-stage simulation revenue, which still funds much of the business today for several major vendors, and investing in process twin and AI capability that increasingly drives growth. Vendors over-indexed on design-stage tools risk missing the process twin transition that has already reshaped where buying committees direct capital. Yet building integration and AI capability requires sustained investment that licensing margins alone do not always fund.

High-value pools concentrate where integration depth, documented ROI, or AI capability limit competition: process twins with proven legacy connectivity, government-funded smart manufacturing deployments requiring programme relationships, and AI-enabled predictive twins with demonstrated accuracy advantage. All three resist price competition that standardised design software increasingly faces from a widening field. Commodity-adjacent visualisation-only tools sold on price alone sit at the other end.

Volume / Commodity-Adjacent Tier

Standardised design-stage simulation and visualisation software sold largely on price against a widening field of capable vendors competing closely on features, licensing cost, platform ease of use, and delivery speed.
Gross Margin: 24-38%

Premium / Certified Tier

Process and system digital twins with proven legacy integration track records, where documented deployment history and measured ROI command sustained pricing power that unproven challengers simply cannot match at any comparable price point.
Gross Margin: 38-54%

Sustainability / Regulatory / Next-Generation Tier

Artificial intelligence-enabled predictive twins and government-funded smart manufacturing deployments sold with demonstrated capability advantage and programme relationships that competitors have not yet fully established or replicated at comparable scale industry-wide.
Gross Margin: 42-60%
digital-twin-market-portfolio-architecture-1787324304352

High-value Sub-segments and Strategic Watch-out

Process Digital Twins

High value and high growth at 16.8%, the fastest category, as manufacturers connect live sensor data to simulation models for measurable operating savings rather than design review alone across most industries. Legacy integration capability, not simulation sophistication, is now the binding growth constraint across most major markets.
Gross Margin: 38-54%

System and Asset Digital Twins

High value with strong growth at 14.2% as utilities and infrastructure operators model complex physical networks for planning and resilience purposes across most developed economies worldwide. Longer public sector sales cycles are offset by considerably larger individual contract values once secured successfully at meaningful scale.
Gross Margin: 40-56%

Product Digital Twins

The volume core by revenue, growing moderately as the original design-stage use case matures while process and system twins increasingly capture new enterprise budget allocation across most industries globally today. Competition on price is most intense in this established category specifically across most established markets.
Gross Margin: 26-40%

Simulation and Physics Modelling Engines

The strategic watch-out, growing slowest as buyers increasingly purchase integrated platforms bundling engines with process and system capability rather than standalone modelling tools across most major markets today worldwide currently overall. Standalone engine sales face growing substitution from bundled platform offerings industry-wide currently and consistently.
Gross Margin: 28-42%

How Platform Relationships Actually Persist

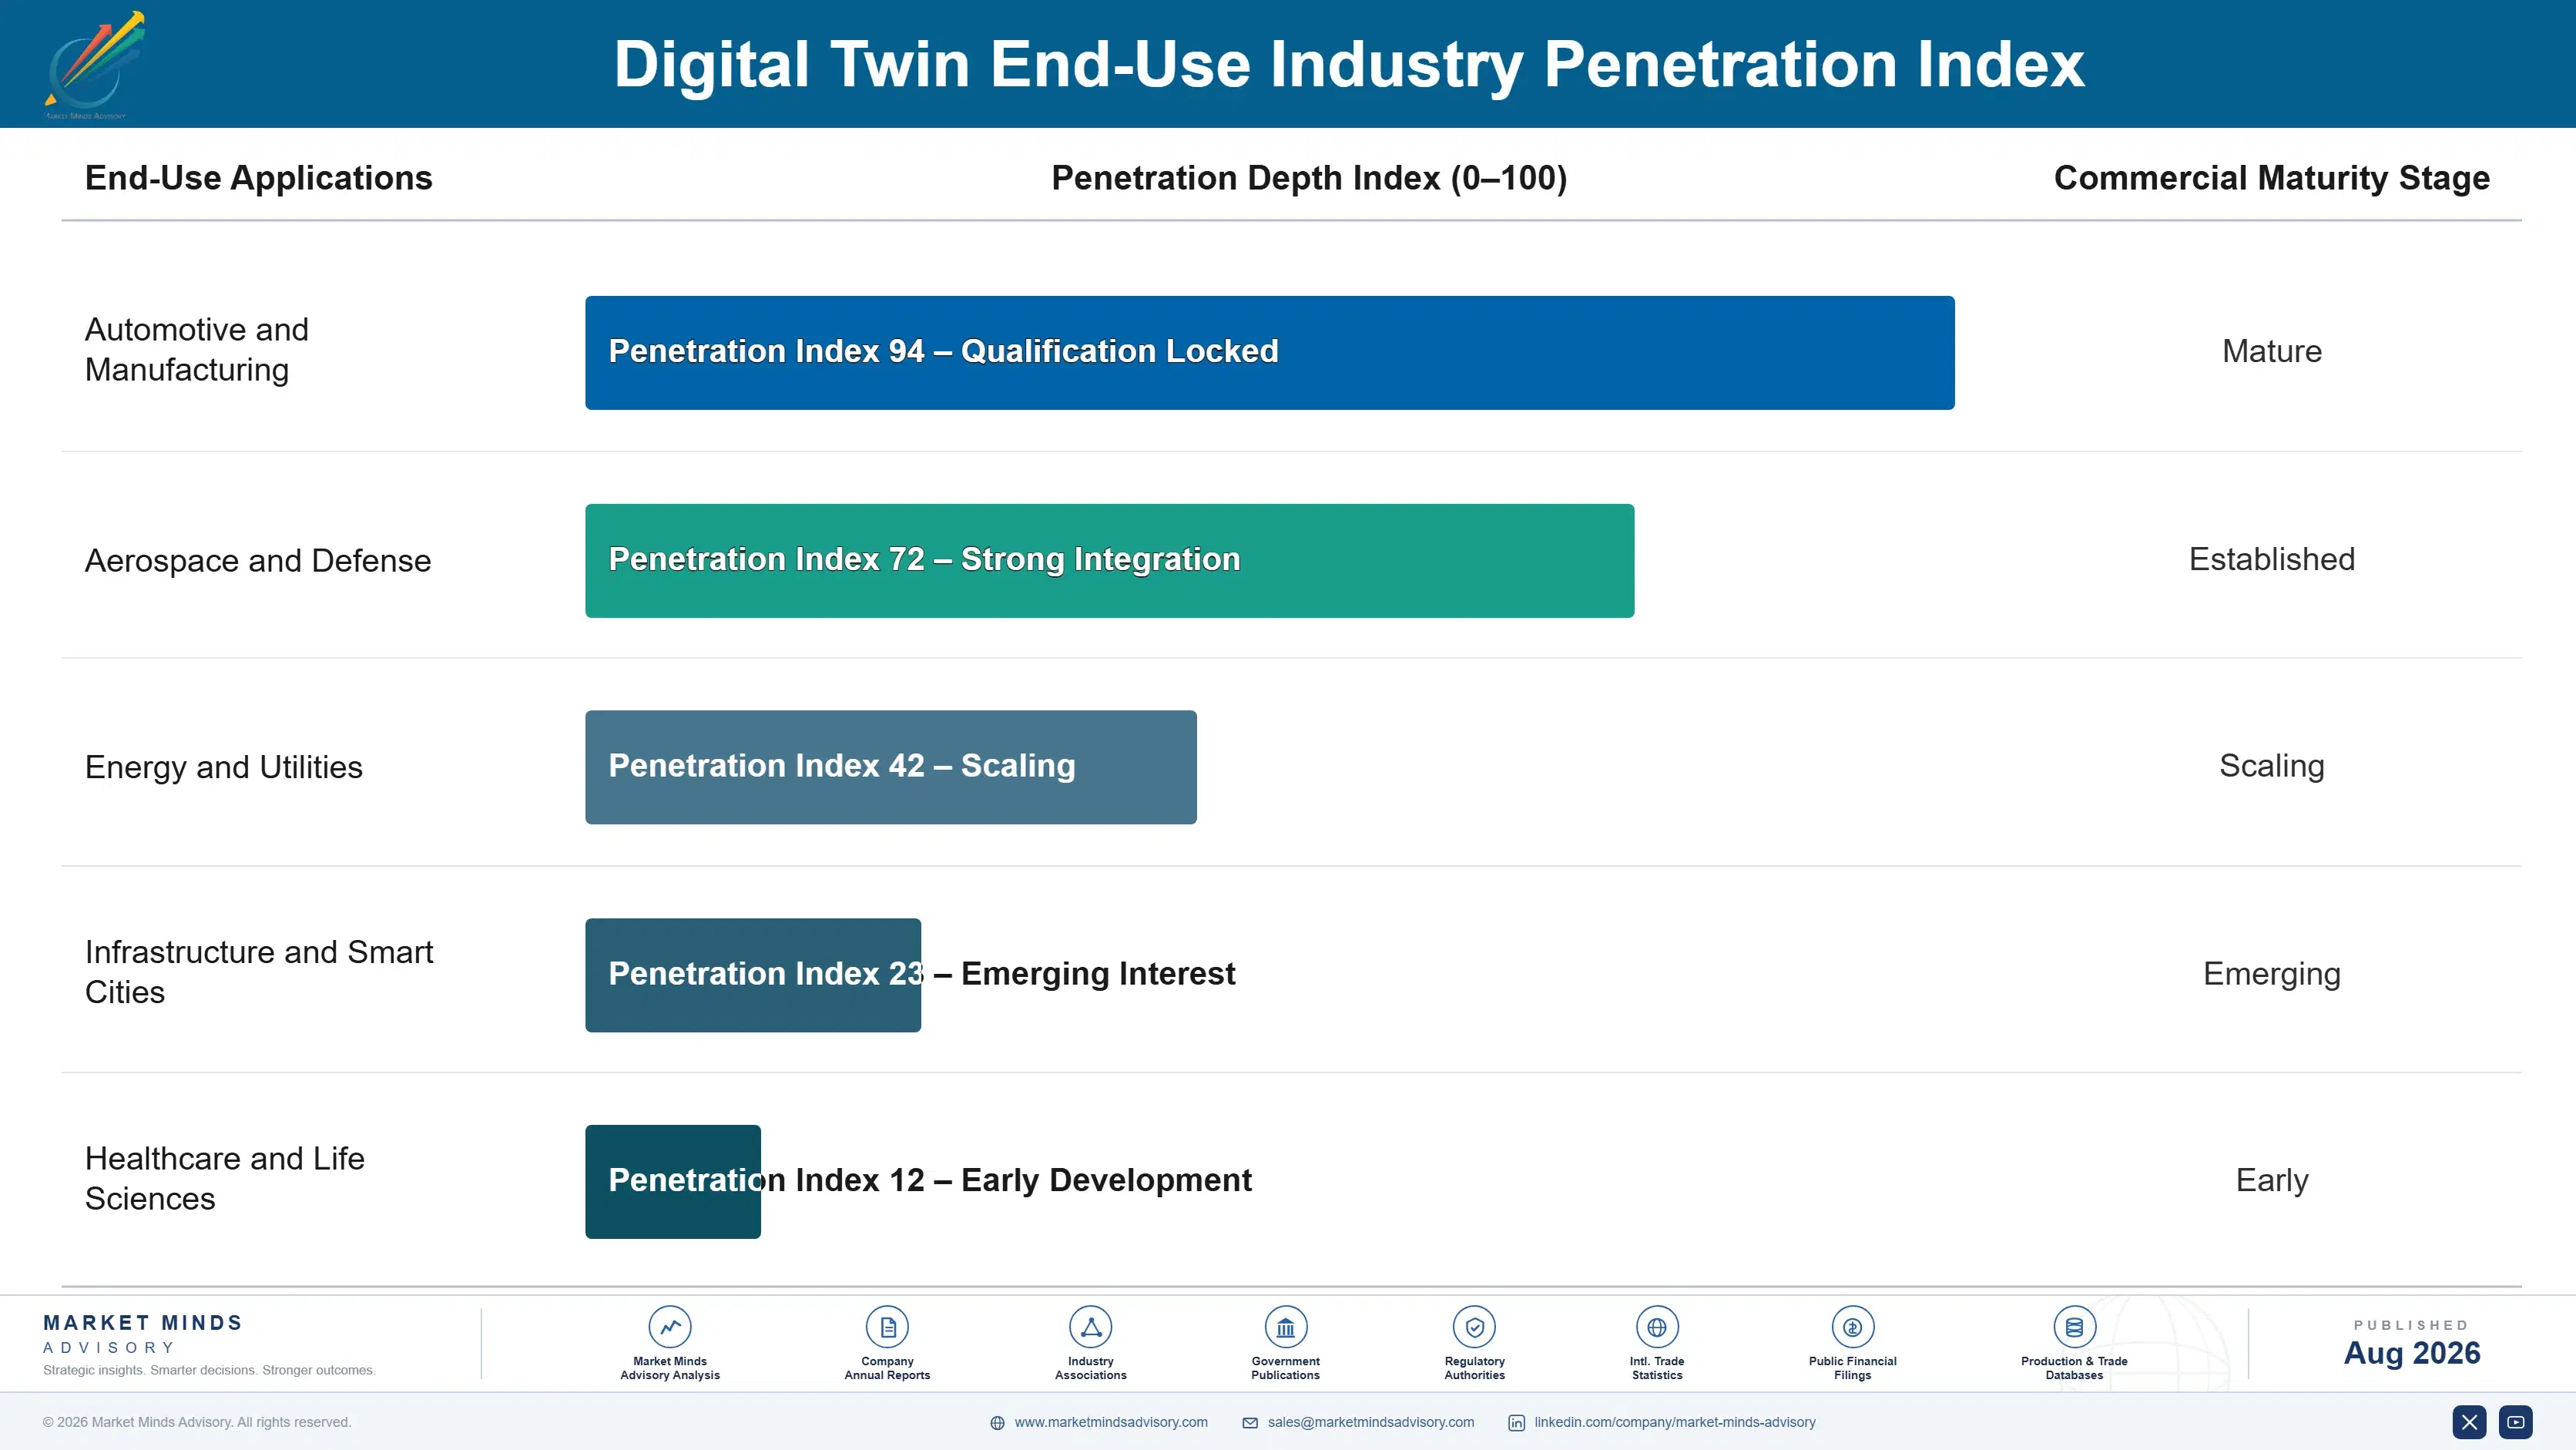
Revenue depends on platform relationships persisting across a manufacturer's multi-year production life, and once an enterprise integrates a twin platform with legacy control systems, switching vendors mid-programme carries reintegration cost that protects the incumbent for years. Process twin deployments, once proven on one production line, generate expansion revenue as manufacturers extend the same platform to additional lines and facilities rather than evaluating new vendors each time. A smal
Adoption depth varies sharply by industry vertical. Automotive and semiconductor manufacturing adopt deepest, since competitive pressure and thin margins make measurable operating savings commercially essential rather than optional. Utilities and infrastructure operators adopt steadily, driven by resilience planning and regulatory reporting requirements. General industrial and smaller manufacturers adopt most cautiously, constrained by integration cost and internal expertise gaps.

Buyer profiles have shifted from IT and engineering departments toward operations leadership who evaluate platform relationships against measured production outcomes rather than design efficiency metrics. Procurement increasingly requires documented return on investment evidence before committing budget, a diligence standard earlier tool purchases rarely required. Younger plant managers also treat digital twins as a default operational tool rather than an experimental technology requiring justification.
digital-twin-market-end-use-penetration-index-1787324304838

Our Call On Digital Twin

These are among the four positions where our research anticipates prominent divergence between winners and laggards over the coming forecast period. Each is grounded in the demand model, the regulatory perimeter, and the announced capacity pipeline.
01 / PROCESS NOW LEADS DESIGN

Operating savings decide budget more than design elegance

Process digital twins already grow at 16.8% against an overall market at 11.4%, because manufacturers increasingly buy against measured operating savings rather than the design-stage review that historically defined the category for most of its early history. Vendors should reorganise product and sales strategy around process twin capability now, since buying committees have shifted decisively toward operations leadership who evaluate platforms on documented plant outcomes. Companies still leading with design-stage simulation pitches are missing where enterprise budget allocation has already moved this cycle.
02 / INTEGRATION IS THE MOAT

Legacy connectivity decides deployability more than features

Integration with legacy plant control systems consumes 25% to 40% of total project cost, and vendors with proven integration track records win deployments that feature-rich but integration-weak competitors simply cannot execute regardless of simulation sophistication. Vendors should staff and market integration expertise as aggressively as simulation capability, since buyers increasingly select on deployment confidence over feature comparison in a category still working through documented reliability at scale. Integration depth compounds into a durable relationship once a plant's legacy systems are successfully connected.
03 / ROI DOCUMENTATION WINS DEALS

Standardised evidence beats internally generated claims

Buying committees frequently cannot compare vendor return on investment claims reliably given inconsistent measurement methodology across the category, and vendors publishing standardised, third-party audited outcome data win specification contests unverified internal claims cannot match at all. This transparency investment shortens sales cycles considerably, since risk-averse committees delay commitment while waiting for evidence quality some competitors already provide upfront today. Vendors should treat measurement standardisation as a competitive investment, not a compliance afterthought, given how directly it shapes buying committee confidence.
04 / AI LAYERING BEATS AI-NATIVE

Domain depth matters more than model sophistication alone

Vendors adding artificial intelligence capability onto established simulation engines are winning specification contests against AI-native entrants lacking the industrial domain depth built over years of legacy protocol integration experience. This approach requires considerably less investment than building simulation capability from scratch, since the physics modelling foundation already exists before any AI layer gets added. Vendors should prioritise AI integration onto proven simulation cores over standalone AI product development, because domain expertise remains the harder capability for a competitor to replicate quickly at comparable scale.

Engagement Snapshot From the Field

A live engagement with an industry participant carrying material or product regulatory and market exposure ahead of a defining policy shift, showing how our research translates into a defensible multi-year portfolio strategy.
MARKET MINDS ADVISORY · CLIENT ENGAGEMENT SUMMARY
Digital Twin Producer Strategic Portfolio Review and Transition Roadmap 2026·Investment Scenario on Digital Twin Exposure Evaluation 2025-26
CLIENT PROFILE
A mid-sized automotive component manufacturer running four production facilities engaged MMA while evaluating digital twin vendors for a first production line deployment. The client reported persistent unplanned downtime costing an estimated USD 8.4 million annually across its facilities and no prior digital twin experience among its engineering or operations teams whatsoever (client-reported, unverified by MMA).
STRATEGIC CHALLENGE
Leadership had received competing proposals from three vendors with widely varying integration timelines, pricing structures, and return on investment claims internal teams lacked the framework to evaluate reliably. Operations leadership favoured the vendor with the most polished demonstration, while engineering raised concerns about integration complexity with the plant's fifteen-year-old control systems. The board wanted an independent evaluation before committing capital.
MMA APPROACH
MMA benchmarked the three candidate vendors on documented integration track records with comparable legacy control systems rather than demonstration quality alone. We modelled realistic deployment timelines and total integration cost based on the client's specific plant control system age and configuration. We then assessed return on investment claims against independently documented outcomes from comparable automotive component manufacturers using each vendor's platform.
KEY FINDINGS
  1. The vendor with the most polished demonstration had the weakest documented integration track record with control systems comparable to the client's fifteen-year-old installed base specifically.
  2. Realistic integration timeline modelling suggested 14 months rather than the 6 months the leading vendor's proposal had originally estimated for full deployment.
  3. The vendor with strongest integration track record modelled a payback period of 16 months against the client's documented downtime cost, within the industry's typical range.
  4. None of the three vendors had published independently audited ROI data, requiring the client to negotiate contractual performance guarantees as a substitute safeguard.
CLIENT PROFILE
A mid-sized automotive component manufacturer running four production facilities engaged MMA while evaluating digital twin vendors for a first production line deployment. The client reported persistent unplanned downtime costing an estimated USD 8.4 million annually across its facilities and no prior digital twin experience among its engineering or operations teams whatsoever (client-reported, unverified by MMA).
STRATEGIC CHALLENGE
Leadership had received competing proposals from three vendors with widely varying integration timelines, pricing structures, and return on investment claims internal teams lacked the framework to evaluate reliably. Operations leadership favoured the vendor with the most polished demonstration, while engineering raised concerns about integration complexity with the plant's fifteen-year-old control systems. The board wanted an independent evaluation before committing capital.
MMA APPROACH
MMA benchmarked the three candidate vendors on documented integration track records with comparable legacy control systems rather than demonstration quality alone. We modelled realistic deployment timelines and total integration cost based on the client's specific plant control system age and configuration. We then assessed return on investment claims against independently documented outcomes from comparable automotive component manufacturers using each vendor's platform.
KEY FINDINGS
  1. The vendor with the most polished demonstration had the weakest documented integration track record with control systems comparable to the client's fifteen-year-old installed base specifically.
  2. Realistic integration timeline modelling suggested 14 months rather than the 6 months the leading vendor's proposal had originally estimated for full deployment.
  3. The vendor with strongest integration track record modelled a payback period of 16 months against the client's documented downtime cost, within the industry's typical range.
  4. None of the three vendors had published independently audited ROI data, requiring the client to negotiate contractual performance guarantees as a substitute safeguard.
RECOMMENDED STRATEGY
Phase 1: Phase 1 (0 to 4 months): Select the vendor with the strongest documented integration track record and negotiate contractual performance guarantees. Phase 2: Phase 2 (4 to 18 months): Execute phased integration and deployment on the first production line with defined milestone checkpoints. Phase 3: Phase 3 (18 to 30 months): Validate measured downtime reduction against contracted guarantees before expanding the programme to additional facilities.
OUTCOME
The client selected the vendor with the strongest documented integration track record rather than the most polished demonstration, and negotiated contractual performance guarantees tied to measured downtime reduction. Deployment tracked close to the realistic fourteen-month timeline MMA had modelled, and the client began planning expansion to a second facility ahead of the original evaluation schedule (client-reported, unverified by MMA).

Frequently Asked Questions

Foundational context covering the market sizes, CAGR, scope, country, region and competition that inform every finding below. This section is provided to cover basics and most often pre-purchase conversations, answered from the MMA Primary Research Dataset.

What is the current size of the Digital Twin Market?

The global digital twin market is valued at USD 14.8 billion in 2025, covering product, process, and system digital twins, platform software, simulation engines, and integration services. Generic CAD software and ERP systems are excluded.

How large will the Digital Twin Market be by 2036?

The market is forecast to reach USD 48.53 billion by 2036 in the base case, about 2.94 times the 2026 level. That represents incremental value of roughly USD 32.04 billion across the decade.

What is the CAGR for the Digital Twin Market 2026 to 2036?

The market grows at an 11.4% CAGR in the base case, with bull and bear scenarios at 12.7% and 10.1%. The spread turns mainly on artificial intelligence adoption pace and legacy system integration cost trends.

Which segment is growing fastest?

Process digital twins grow fastest at 16.8%, about 1.47 times the overall rate, as manufacturers connect live data for real-time optimisation. System and asset digital twins follow at 14.2%.

Who are the major companies in the Digital Twin Market?

Leading companies include Siemens, Dassault Systemes, PTC, ANSYS, and AVEVA. Concentration sits at CR5 of 46%, reflecting how platform breadth and integration depth separate leaders from challengers.

Which country is growing fastest?

South Korea grows fastest at a 15.6% CAGR, as national manufacturing competitiveness programmes fund digital twin adoption directly. China follows on continued domestic platform development.

Report Segmentation Architecture

The full report scope spans multiple orthogonal segmentation dimensions, with cross-tabulated demand data provided for each dimension pair. Coverage extends further to regional breakdowns, trend trajectories, and the competitive detail needed to support segment-level decision-making.

By Digital Twin Type

  • Product Digital Twins
  • Process Digital Twins
  • System and Asset Digital Twins
  • Platform and Integration Software
  • Simulation and Physics Modelling Engines
  • Consulting and Integration Services

By End-Use Industry

  • Automotive and Manufacturing
  • Aerospace and Defense
  • Energy and Utilities
  • Infrastructure and Smart Cities
  • Healthcare and Life Sciences

By Commercial Dimension

  • Platform Licensing
  • Integration and Deployment Services
  • Managed and Hosted Services
  • Training and Support Contracts

By Region

  • North America
  • Western Europe
  • East Asia
  • South Asia and Pacific
  • Latin America
  • Middle East and Africa
  • Eastern Europe

Scope, Methodology, and Coverage

Every figure in this report is reproducible from documented input assumptions. The scope below maps the historical period, the forecast horizon, the segmentation dimensions, and the countries covered, alongside the underlying primary and qualitative methodology.
Historical Period
2020 to 2025
Forecast Period
2026 to 2036
Base Year
2025 (USD billions; MMA Primary Research Dataset, August 2026)
Market Definition
The digital twin market comprises software platforms and services that create and maintain a live, data-connected virtual representation of a physical product, process, or system for simulation, monitoring, and prediction, valued at vendor revenue from platform licensing and directly attached services. It spans product, process, and system digital twins, platform and integration software, simulation and physics modelling engines, and consulting and integration services. Sensor and IoT hardware sold independently, generic CAD authoring software without live data connection, and enterprise resource planning software are excluded.
Quantitative Units
USD billions (current prices); deployed twin instances where applicable
Segmentation Dimensions
By Digital Twin Type; By End-Use Industry; By Commercial Dimension; By Region
Regions Covered
North America, Western Europe, East Asia, South Asia and Pacific, Latin America, Middle East and Africa, Eastern Europe
Countries Covered
USA, China, Germany, France, UK, Japan, South Korea, India, Australia, Canada, Brazil, Mexico, Indonesia, Vietnam, Thailand, Malaysia, UAE, Saudi Arabia, South Africa, Nigeria, Turkey, Poland, Netherlands, Italy, Spain, Sweden, Switzerland, Argentina, Colombia, Singapore, and additional markets relevant to this sector
Key Companies Profiled
Siemens, Dassault Systemes, PTC, ANSYS, AVEVA, Bentley Systems, Microsoft, IBM, GE Digital, Autodesk, Oracle, SAP, Hexagon AB, Rockwell Automation, NVIDIA, Cityzenith, Unity Technologies, Altair Engineering, Schneider Electric, Emerson Electric
Quantitative Methodology
Primary survey, n=3,800 respondents, Q4 2025, six countries; demand-side model with trade association cross-validation
Qualitative Methodology
47 expert interviews, Q4 2025; applied to validate demand model assumptions, identify emerging dynamics, and assess competitive positioning
Report Format
PDF and XLSX data workbook (Word format preview document)
Publisher
Market Minds Advisory
Report Code
MMA-2026-TEC-221
Published
August 2026
Contact
sales@marketmindsadvisory.com | www.marketmindsadvisory.com

Purchase the full Digital Twin Market Report (2026 to 2036).

The full MMA Digital Twin report sizes the market across six digital twin type categories, five end-use industries, four commercial dimensions, and seven regions through 2036. It profiles 20 companies on a consistent digital twin revenue basis, scoring each on integration depth, documented ROI evidence, and artificial intelligence integration maturity. Scenario models quantify how process optimisation adoption, government smart manufacturing funding, and legacy integration cost move both deployment volume and achievable margin by twin category. The report also includes integration cost benchmarking by legacy system type, measured ROI documentation tracking by vendor, and government funding programme tracking across major manufacturing economies.
Six-category and four-dimension market sizing to 2036
Twenty-company benchmark on digital twin revenue basis
Legacy system integration cost benchmarking by system type
Measured ROI documentation and payback tracking by vendor
Government smart manufacturing funding programme tracking
Artificial intelligence integration maturity assessment by platform

Built For The People Who Decide

From boardroom strategy to bench-side execution, this report is read cover-to-cover by leaders shaping the next decade of their industry, turning demand scenarios, market dynamics and valuation benchmarks into decisions.
CXOs/ Presidents/ VPs/ Managers
M&A and Corporate Development
Strategy Teams and R&D Heads
Procurement and Product Directors
Regulatory and Compliance Leaders
Investor Relations and Equity Analysts