Market Minds Advisory
Commercial Vehicles Market

Commercial Vehicles Market: Commercial Vehicles: Freight Cycles Meet an Electrification Mandate

A commercial reading of trucks and buses, where diesel economics still set replacement timing, electrification mandates reshape total cost of ownership, and Chinese and Indian manufacturers push into export volume once reserved for Western OEMs.

Lead Analyst

David Horsley

Published

August 2026

Make Smarter Decisions with Customized Research Insights

Request a free sample report and evaluate market opportunities, growth trends, and competitive dynamics relevant to your business needs.

2025 MARKET VALUE$985.0BMarket Size 2025
2036 FORECAST VALUE$1909MBase Case , 2026 to 2036
CAGR 2026 TO 20366.2 %Bull 7.4% / Bear 4.9%
INCREMENTAL OPPORTUNITY$862.9BNet 10- year value creation
EXPANSION MULTIPLE1.82x2036 value over 2026 base
Strategic Levers
M&A Pipeline
Regional Outlook
Country Rankings
Competitive Intelligence
Segmental Deep-dive
Call-Us : 91 93563 13602

Executive Snapshot and Market Trajectory.

Fleet operators still buy on cost per mile, and diesel still wins that arithmetic in most duty cycles today. Electrification is real but highly selective, concentrated almost entirely where routes are short, predictable, and heavily subsidised by public transit budgets rather than open commercial demand.
The market stands at USD 985.0 billion in 2025 and reaches USD 1,909.0 billion by 2036 at a 6.2% CAGR. Buses and coaches grow fastest at 7.5%, about 1.21 times the overall rate, as transit agencies electrify fixed routes under public funding rather than open-market demand. East Asia holds 28% of value on manufacturing scale, while India posts the quickest national growth at 9.6% on corridor investment.
Concentration is moderate, with the top five holding roughly 42% of shipment volume against a wide field of regional specialists competing worldwide. Two distinct forces reshape competitive standing right now. Chinese and Indian manufacturers are exporting heavy trucks into markets Western OEMs long treated as captive for decades, and total cost of ownership calculations increasingly favour electric drivetrains on short, high-utilisation urban and last-mile routes where charging infrastructure already exists at meaningful and growing scale.
Market Definition
The commercial vehicles market covers the manufacture and sale of light, medium, and heavy-duty trucks, buses, coaches, and vocational or specialty chassis used for freight transport, passenger transit, and municipal or construction service duty. Passenger cars, two-wheelers, off-highway construction and mining equipment, and aftermarket parts sold separately from the vehicle are excluded.
Base Year Value
$985.0B in 2025 (MMA Primary Research Dataset, August 2026)
Forecast Period
2026 to 2036, eleven discrete annual values
CAGR
6.2% base case. Bull 7.4%. Bear 4.9%.
Fastest Growth Segment
Buses and Coaches: 7.5% CAGR
Fastest Growth Country
India: 9.6% CAGR
Fastest Growth Region
South Asia and Pacific: 8.3% CAGR
Largest Region
East Asia: 28% of 2025 global value
Market Leaders
Daimler Truck, Volvo Group, Traton Group, Tata Motors, PACCAR. Source: MMA Analysis based on company annual reports.
Primary Survey
n=3,800 procurement and R&D decision-makers, Q4 2025, six countries
Methodology
Demand-side build-up, cross-validated against public data, 47 expert interviews

Commercial Vehicles Market Forecast Scenarios

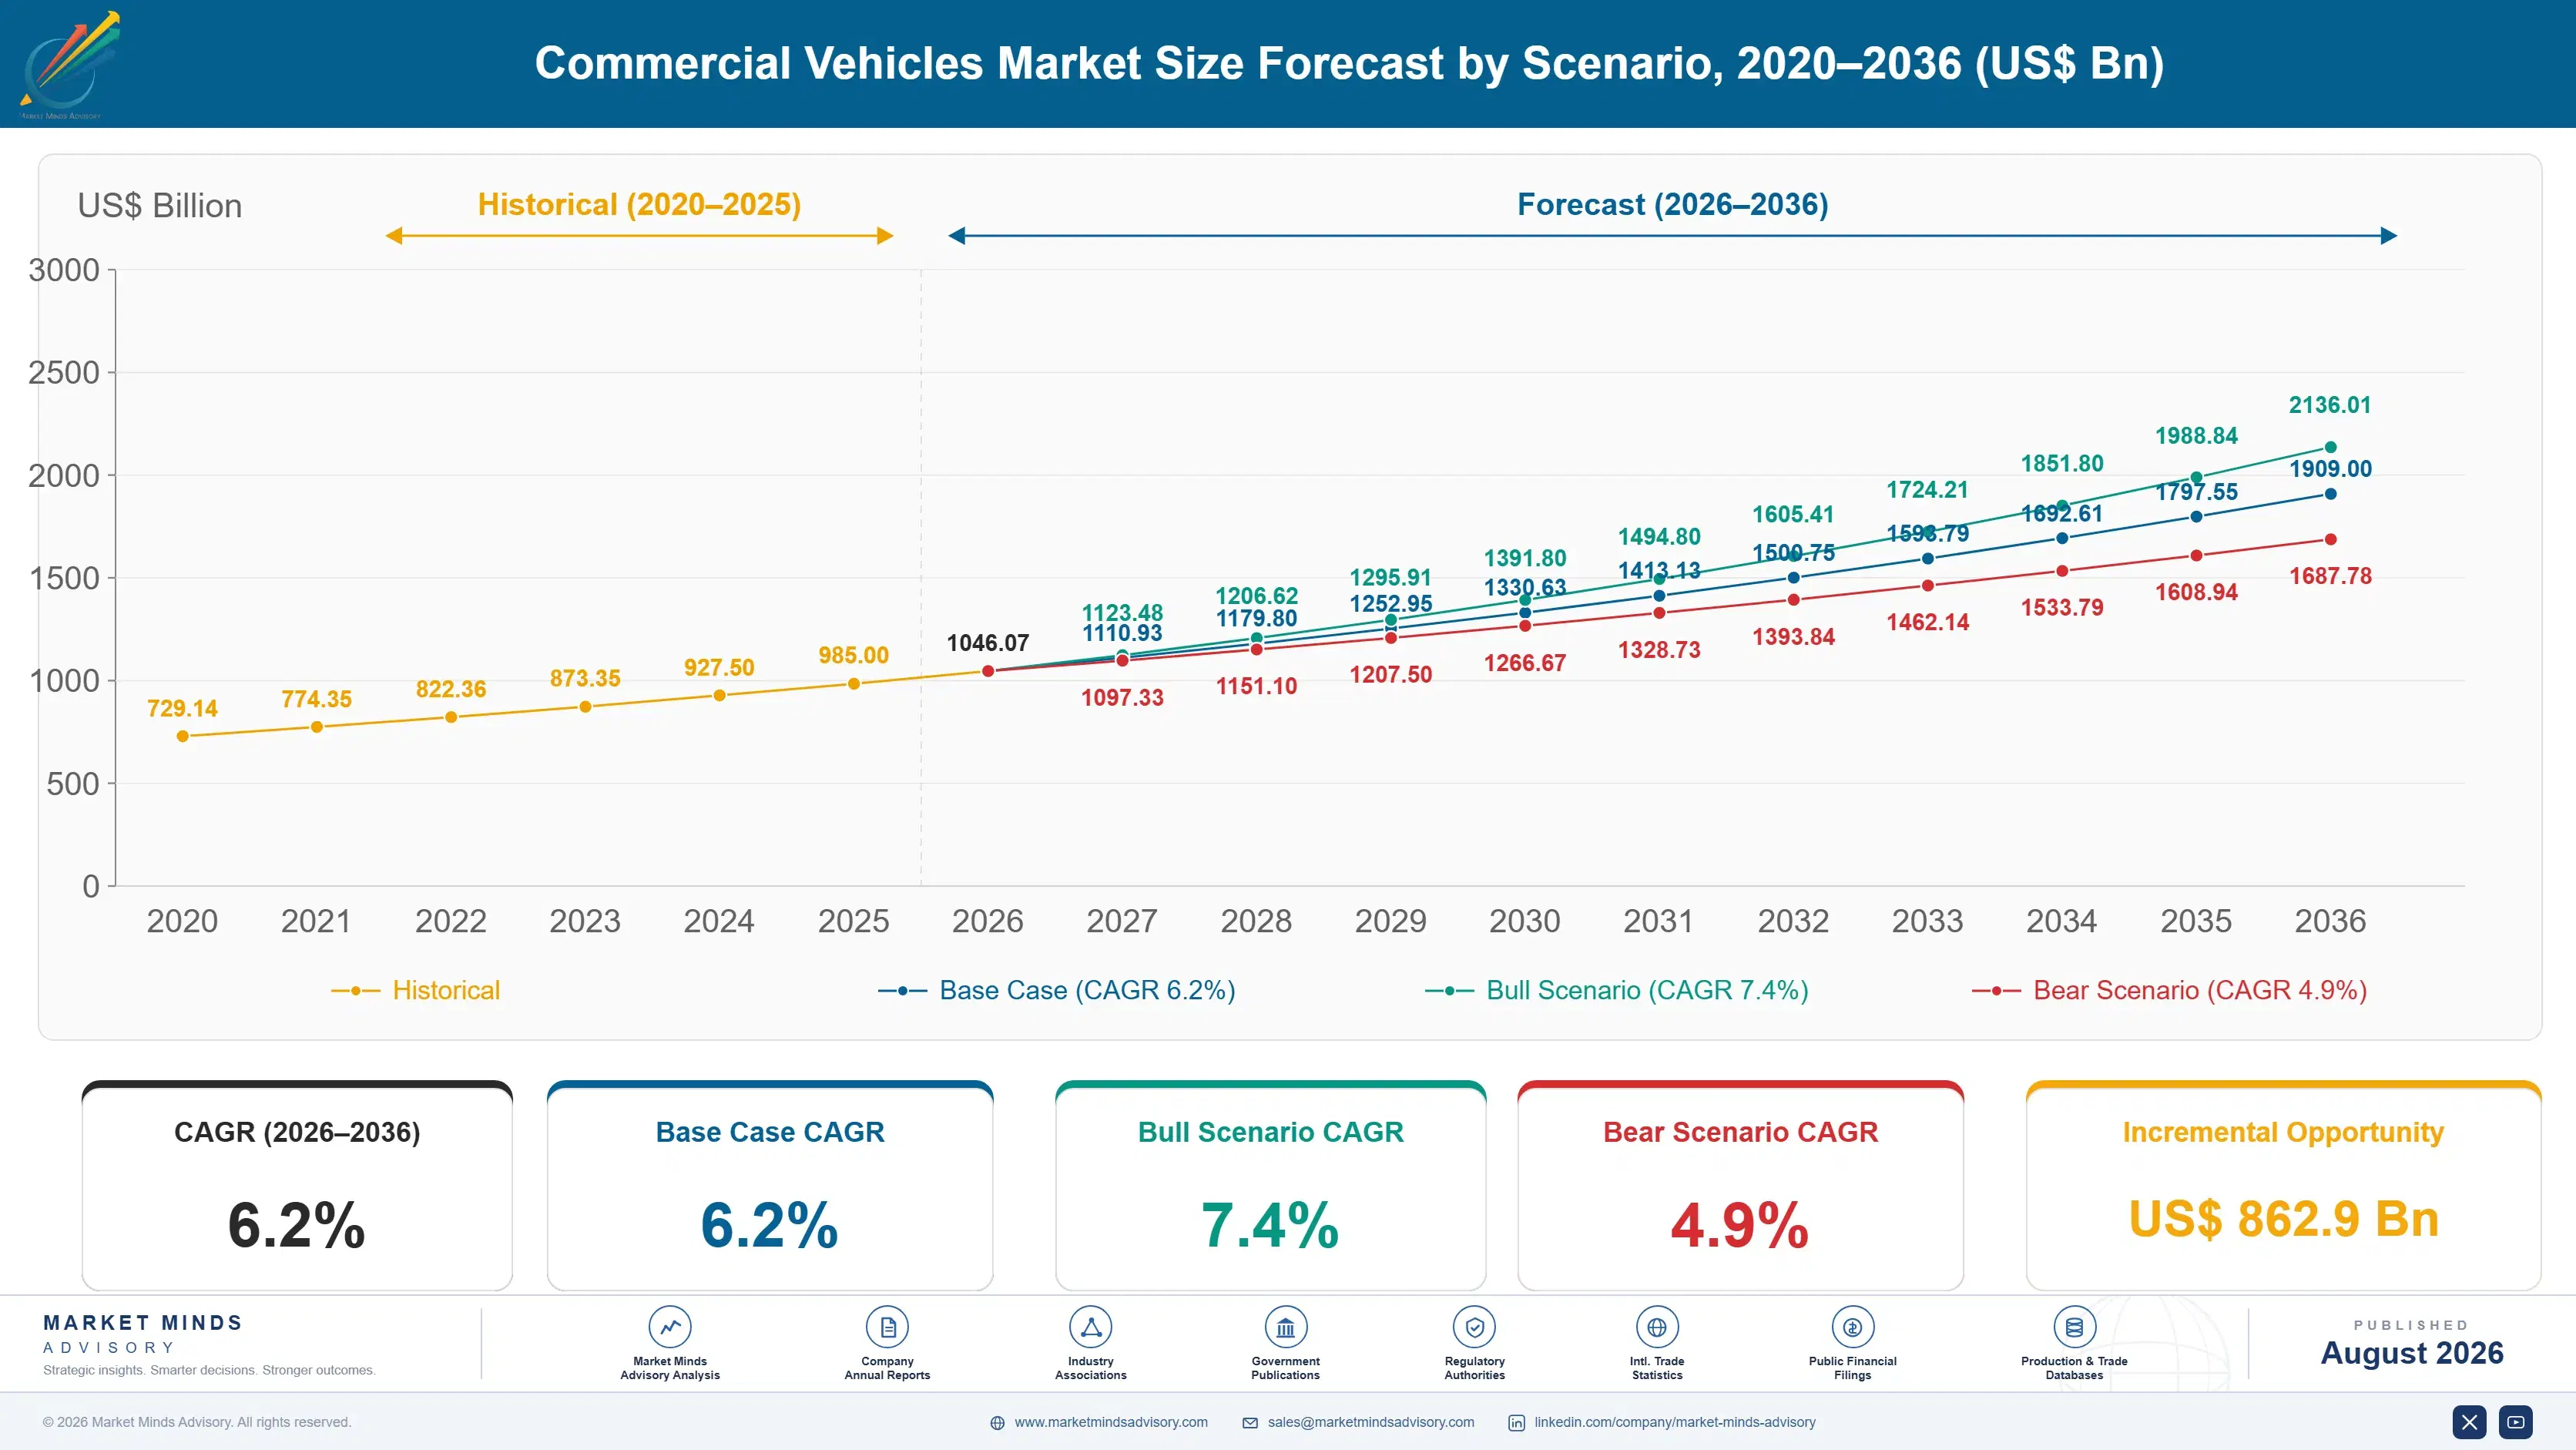
commercial-vehicles-market-size-forecast-scenario-1787324151198
Growth from 2020 to 2025 compounded near 5.1%, disrupted early by pandemic production stoppages and semiconductor shortages that idled assembly lines for months at several major OEMs worldwide. Freight demand recovered considerably faster than manufacturers could rebuild build capacity, which lifted order backlogs and list pricing through 2022 and 2023 before gradually normalising into 2025 as global supply chains slowly stabilised.
Three mechanisms carry the base case to 6.2%. First, freight volume growth tracks industrial production and e-commerce parcel density, which keeps replacement demand steady across mature fleets. Second, emission regulation in Europe, North America, and increasingly China forces earlier retirement of older diesel units regardless of freight economics alone. Third, electrified transit procurement funded through national and municipal decarbonisation programmes adds a demand layer independent of the freight cycle entirely.
The bull case at 7.4% assumes freight volume growth outpaces GDP as e-commerce parcel density keeps rising and electrified transit procurement accelerates broadly across major economies. The bear case at 4.9% assumes a prolonged freight recession compresses fleet replacement timing considerably, and charging infrastructure delays push electrified bus and truck adoption back by several full procurement cycles.

Why Duty Cycle Decides the Powertrain, Not Policy Alone

Three forces set demand. Freight tonnage provides the base, moving with industrial production and consumer goods flow across every economy this market serves. Emission regulation forces a second layer of replacement, since older diesel units become uneconomic to operate well before they are mechanically finished. Electrified transit procurement adds a third layer entirely independent of freight, funded through public budgets rather than fleet economics.
MARKET CONCENTRATIONCR5: 42%Moderately fragmented across regional and global truck manufacturers
AVERAGE SELLING PRICEUSD 32,000 to 185,000Spans light delivery vans through heavy long-haul tractor units
TOP PRODUCING COUNTRYChina: 31% of global unit outputReflects domestic OEM scale and dense component supply base
CAPACITY UTILIZATION72 to 84%Cyclical swings tied closely to freight and construction demand
EXPORT TRADE INTENSITYAbout 19% of units cross a borderChassis platforms increasingly assembled locally through knocked-down component kits
FLEET REPLACEMENT CYCLE7 to 12 yearsVaries by duty severity, emission rules, and residual value
The commercial character still runs on cost per mile. Fuel, driver wages, maintenance, and financing dominate the total cost of ownership calculation, and diesel remains cheaper than electric on most long-haul duty cycles once charging infrastructure and battery weight penalties are counted honestly. Where routes are short and predictable, the calculation flips, which is why urban delivery and fixed-route transit electrify first and long-haul freight lags considerably behind.
The next decade turns on two things. Whether battery cost and charging density fall fast enough to flip the total cost of ownership calculation on regional-haul routes, not just urban ones. And whether Chinese and Indian manufacturers convert domestic scale into durable export share in markets that long assumed Western and Japanese OEMs owned the premium segment permanently.
"Everyone models electrification as a technology adoption curve, and it isn't one. It's a routing problem. A truck that returns to the same depot every night electrifies easily. A truck that doesn't, doesn't, and no battery chemistry improvement changes that math for another decade."
Director, Commercial Transportation and Mobility Practice · MMA Automotive / Com

Market Trends

Total Cost of Ownership Now Decides Urban Fleet Electrification

Fleet buyers increasingly model total cost of ownership rather than sticker price, and on short, high-utilisation urban routes electric trucks and buses now clear that bar in several markets. Battery pack costs fell considerably through the past five years, and depot charging infrastructure amortises well across a return-to-base duty cycle where range anxiety barely applies. Long-haul freight remains a different calculation, since battery weight displaces payload and charging time competes with drive-time regulations limiting driver hours. The result is a bifurcated market: urban and transit electrify on economics, long-haul mainly where regulation forces the transition.
Market Impact: Compliance forces retirement 3 year
Chinese and Indian OEMs Push Export Volume Upmarket

Domestic scale in China and India built manufacturing cost positions that Western and Japanese OEMs cannot easily match on mid-tier trucks, and both countries' manufacturers now export into Southeast Asia, Africa, Latin America, and increasingly Eastern Europe at price points fifteen to twenty-five percent below incumbent offerings. Quality perception, once the binding constraint, has improved enough that fleet buyers in price-sensitive markets accept the trade-off readily. The result is margin pressure on incumbent OEMs in export markets they treated as stable, and a competitive threat building years ahead of most strategic plans.
Market Impact: Last-mile fleet demand adds 4% annu

Market Opportunities and Growth Drivers

Emission Regulation Forces Fleet Turnover Ahead of Schedule

Euro 7, China VI, and tightening United States nitrogen oxide standards each force earlier retirement of older diesel units regardless of whether they remain mechanically sound, since compliance retrofits frequently cost more than the residual vehicle value justifies. Fleet operators consequently replace vehicles on a regulatory clock rather than a maintenance one across an increasing share of major markets. The effect compounds where low-emission zones restrict older vehicles from city centres, removing residual value that previously extended vehicle life by several years. Manufacturers plan production mix around this regulatory turnover as much as around freight growth.
Market Impact: Corridor charging gaps delay 5 year

E-Commerce Parcel Density Sustains Last-Mile Fleet Growth

Parcel volume per capita has kept rising across developed and emerging markets alike, and last-mile delivery fleets have become a distinct commercial vehicle category with its own duty cycle, financing structure, and increasingly electric powertrain preference. Logistics operators favour smaller, purpose-built delivery vans over repurposed passenger platforms, which has created a genuine new vehicle segment rather than incremental demand on existing ones. Depot-based charging infrastructure investment by major logistics operators has, in turn, made electric powertrains the default specification for new last-mile orders in several developed markets. This driver operates largely independent of the broader freight cycle.
Market Impact: Lead times run 6 weeks longer

Market Restraints and Challenges

Charging Infrastructure Gaps Stall Regional-Haul Electrification

Depot charging works for return-to-base routes, but regional-haul freight requires charging density along corridors most markets have not built, and the capital cost of high-power truck charging sits beyond what most logistics operators or utilities have committed to date. The root cause is a coordination failure: charging providers wait for fleet demand, and fleets wait for charging certainty, and neither moves first. Commercially this stalls electrification where freight volume is largest, since regional-haul carries a disproportionate share of total tonne-kilometres. Manufacturers and utilities are exploring joint corridor investment to break the deadlock.
Market Impact: TCO parity reaches 60% of routes

Semiconductor and Component Supply Volatility Persists

The 2021 to 2023 semiconductor shortage exposed how concentrated commercial vehicle electronics supply chains had become, and while acute shortages have eased, lead times on specific power electronics and sensor components remain longer and less predictable than pre-pandemic norms. The root cause is that automotive-grade semiconductor demand competes for the same fabrication capacity as consumer electronics and data centre chips, none of which prioritise truck production schedules. Commercially this forces OEMs to hold higher safety stock and occasionally idle lines, raising working capital cost. Manufacturers are responding with dual-sourcing strategies and longer-term supply contracts.
Market Impact: Export share gains 8 points regiona
3 additional market trends, 3 additional growth drivers, and 4 additional restraints and challenges are covered in the full report. Contact sales@marketmindsadvisory.com to access the complete intelligence.

Segment CAGR and Growth Architecture

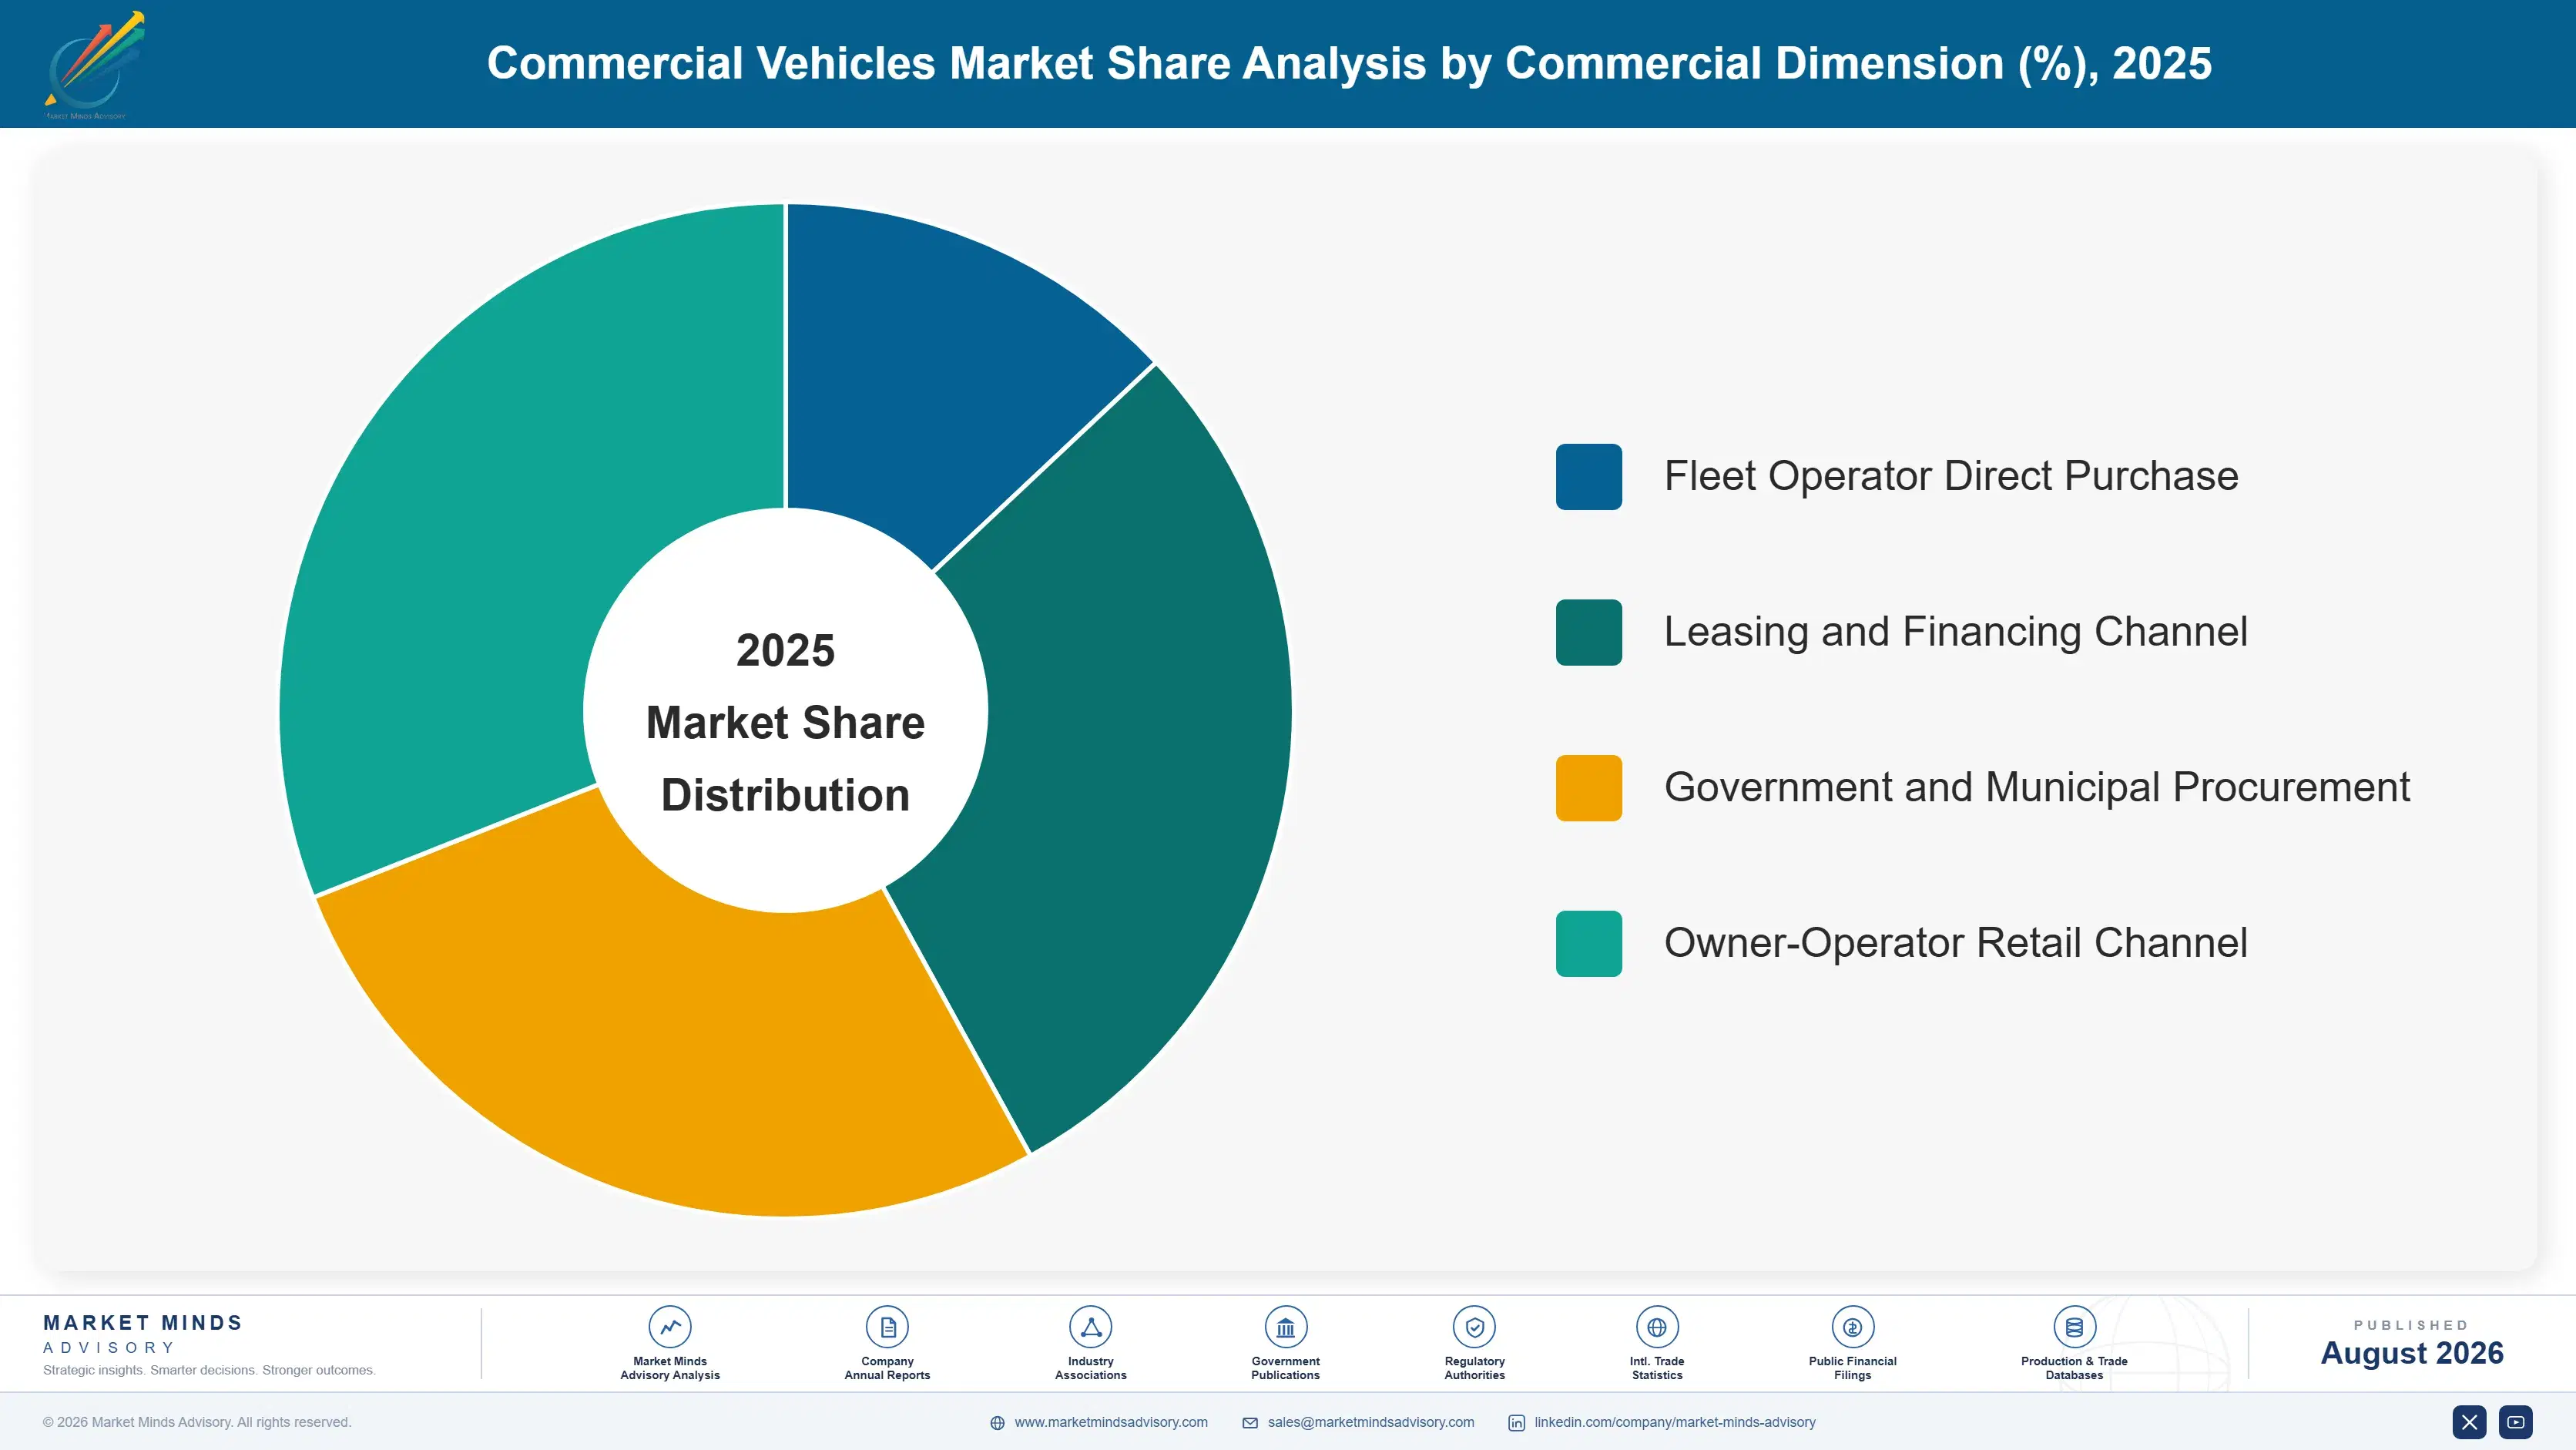
Segmentation follows vehicle class, a single product logic describing gross vehicle weight rating and body configuration rather than powertrain type or ownership model. Each class carries distinct duty cycles, financing structures, and regulatory treatment, so commercial position tracks class rather than end-use industry or distribution channel, both of which appear separately within the framework below.
commercial-vehicles-market-market-share-analysis-1787324152085

Buses and Coaches

Buses and coaches grow fastest at 7.5%, about 1.21 times the overall 6.2% rate, driven overwhelmingly by public transit electrification programmes rather than open commercial demand. National and municipal decarbonisation budgets fund fixed-route electric bus procurement across Europe, China, and increasingly India and Latin America, and the return-to-depot duty cycle suits current battery technology well. Intercity coach demand grows more slowly and remains largely diesel, since range and refuelling speed still favour combustion on long, variable routes. Chinese manufacturers including BYD and Yutong hold strong positions in electric bus supply globally, having built manufacturing scale years ahead of Western competitors. Procurement is lumpy, tied to budget cycles and grant funding availability rather than steady replacement demand.
CAGR 7.5%

Vocational and Specialty Vehicles

Vocational and specialty vehicles, including concrete mixers, refuse collection trucks, fire apparatus, and utility service chassis, grow at 6.9%, the second-fastest class, tracking infrastructure investment and municipal service budgets more closely than general freight volume. Construction activity in emerging markets and ageing municipal fleet replacement in developed ones both sustain demand independent of the broader freight cycle entirely. These vehicles carry longer specification lead times and considerably higher customisation content than standard trucks, which supports stronger margins and closer OEM-to-fitter relationships over the vehicle life. Electrification is emerging here too, particularly in refuse collection where routes are short and predictable, though adoption still lags buses by several years given the specialised body equipment involved in each build.
CAGR 6.9%
Full segment breakdown across 5 segments available in the complete report.

Regional Architecture and Country Demand Map

Manufacturing scale and regulatory timing set this distribution more than freight volume alone. East Asia leads on production capacity, North America and Western Europe on average vehicle value, while South Asia and Pacific posts the fastest growth on freight corridor investment and fleet formalisation across previously informal transport sectors.

North America

Freight economics dominate North American demand more directly than almost anywhere else, with long-haul trucking carrying a disproportionate share of tonne-kilometres across a continental network with limited rail penetration in certain corridors. United States Environmental Protection Agency nitrogen oxide rules and California Air Resources Board mandates are forcing earlier fleet turnover than freight economics alone would justify. Electrification is concentrated in urban delivery and transit, while long-haul remains almost entirely diesel given charging corridor gaps across interstate routes. PACCAR, Daimler Truck, and Navistar hold strong domestic manufacturing positions built over decades. Growth of 5.6% reflects steady freight volume and regulation-driven replacement rather than any surge. Financing structures here remain sophisticated, with leasing penetration well above most regions.
Share: 26% | CAGR: 5.6% (2026 to 2036)

Western Europe

Regulation shapes this market more directly than freight volume, with Euro 7 emission standards and low-emission urban zones forcing fleet decisions well ahead of vehicle age alone. Western Europe holds 20% of value, and public transit electrification is furthest advanced here of any region, with several capital cities running substantially electrified bus fleets already. Traton Group brands including Scania and MAN, alongside Volvo Group, dominate domestic heavy truck production and export considerably beyond the region. Freight volume growth is modest given mature industrial output, so replacement cycles rather than fleet expansion drive most unit demand. Growth of 4.6%, the slowest of the seven, reflects that maturity directly. Cross-border freight harmonisation within the bloc still supports standardised specification.
Share: 20% | CAGR: 4.6% (2026 to 2036)
Regional intelligence for 5 additional markets available in the complete report: East Asia, South Asia and Pacific, Latin America, Middle East and Africa, Eastern Europe. Contact sales@marketmindsadvisory.com.
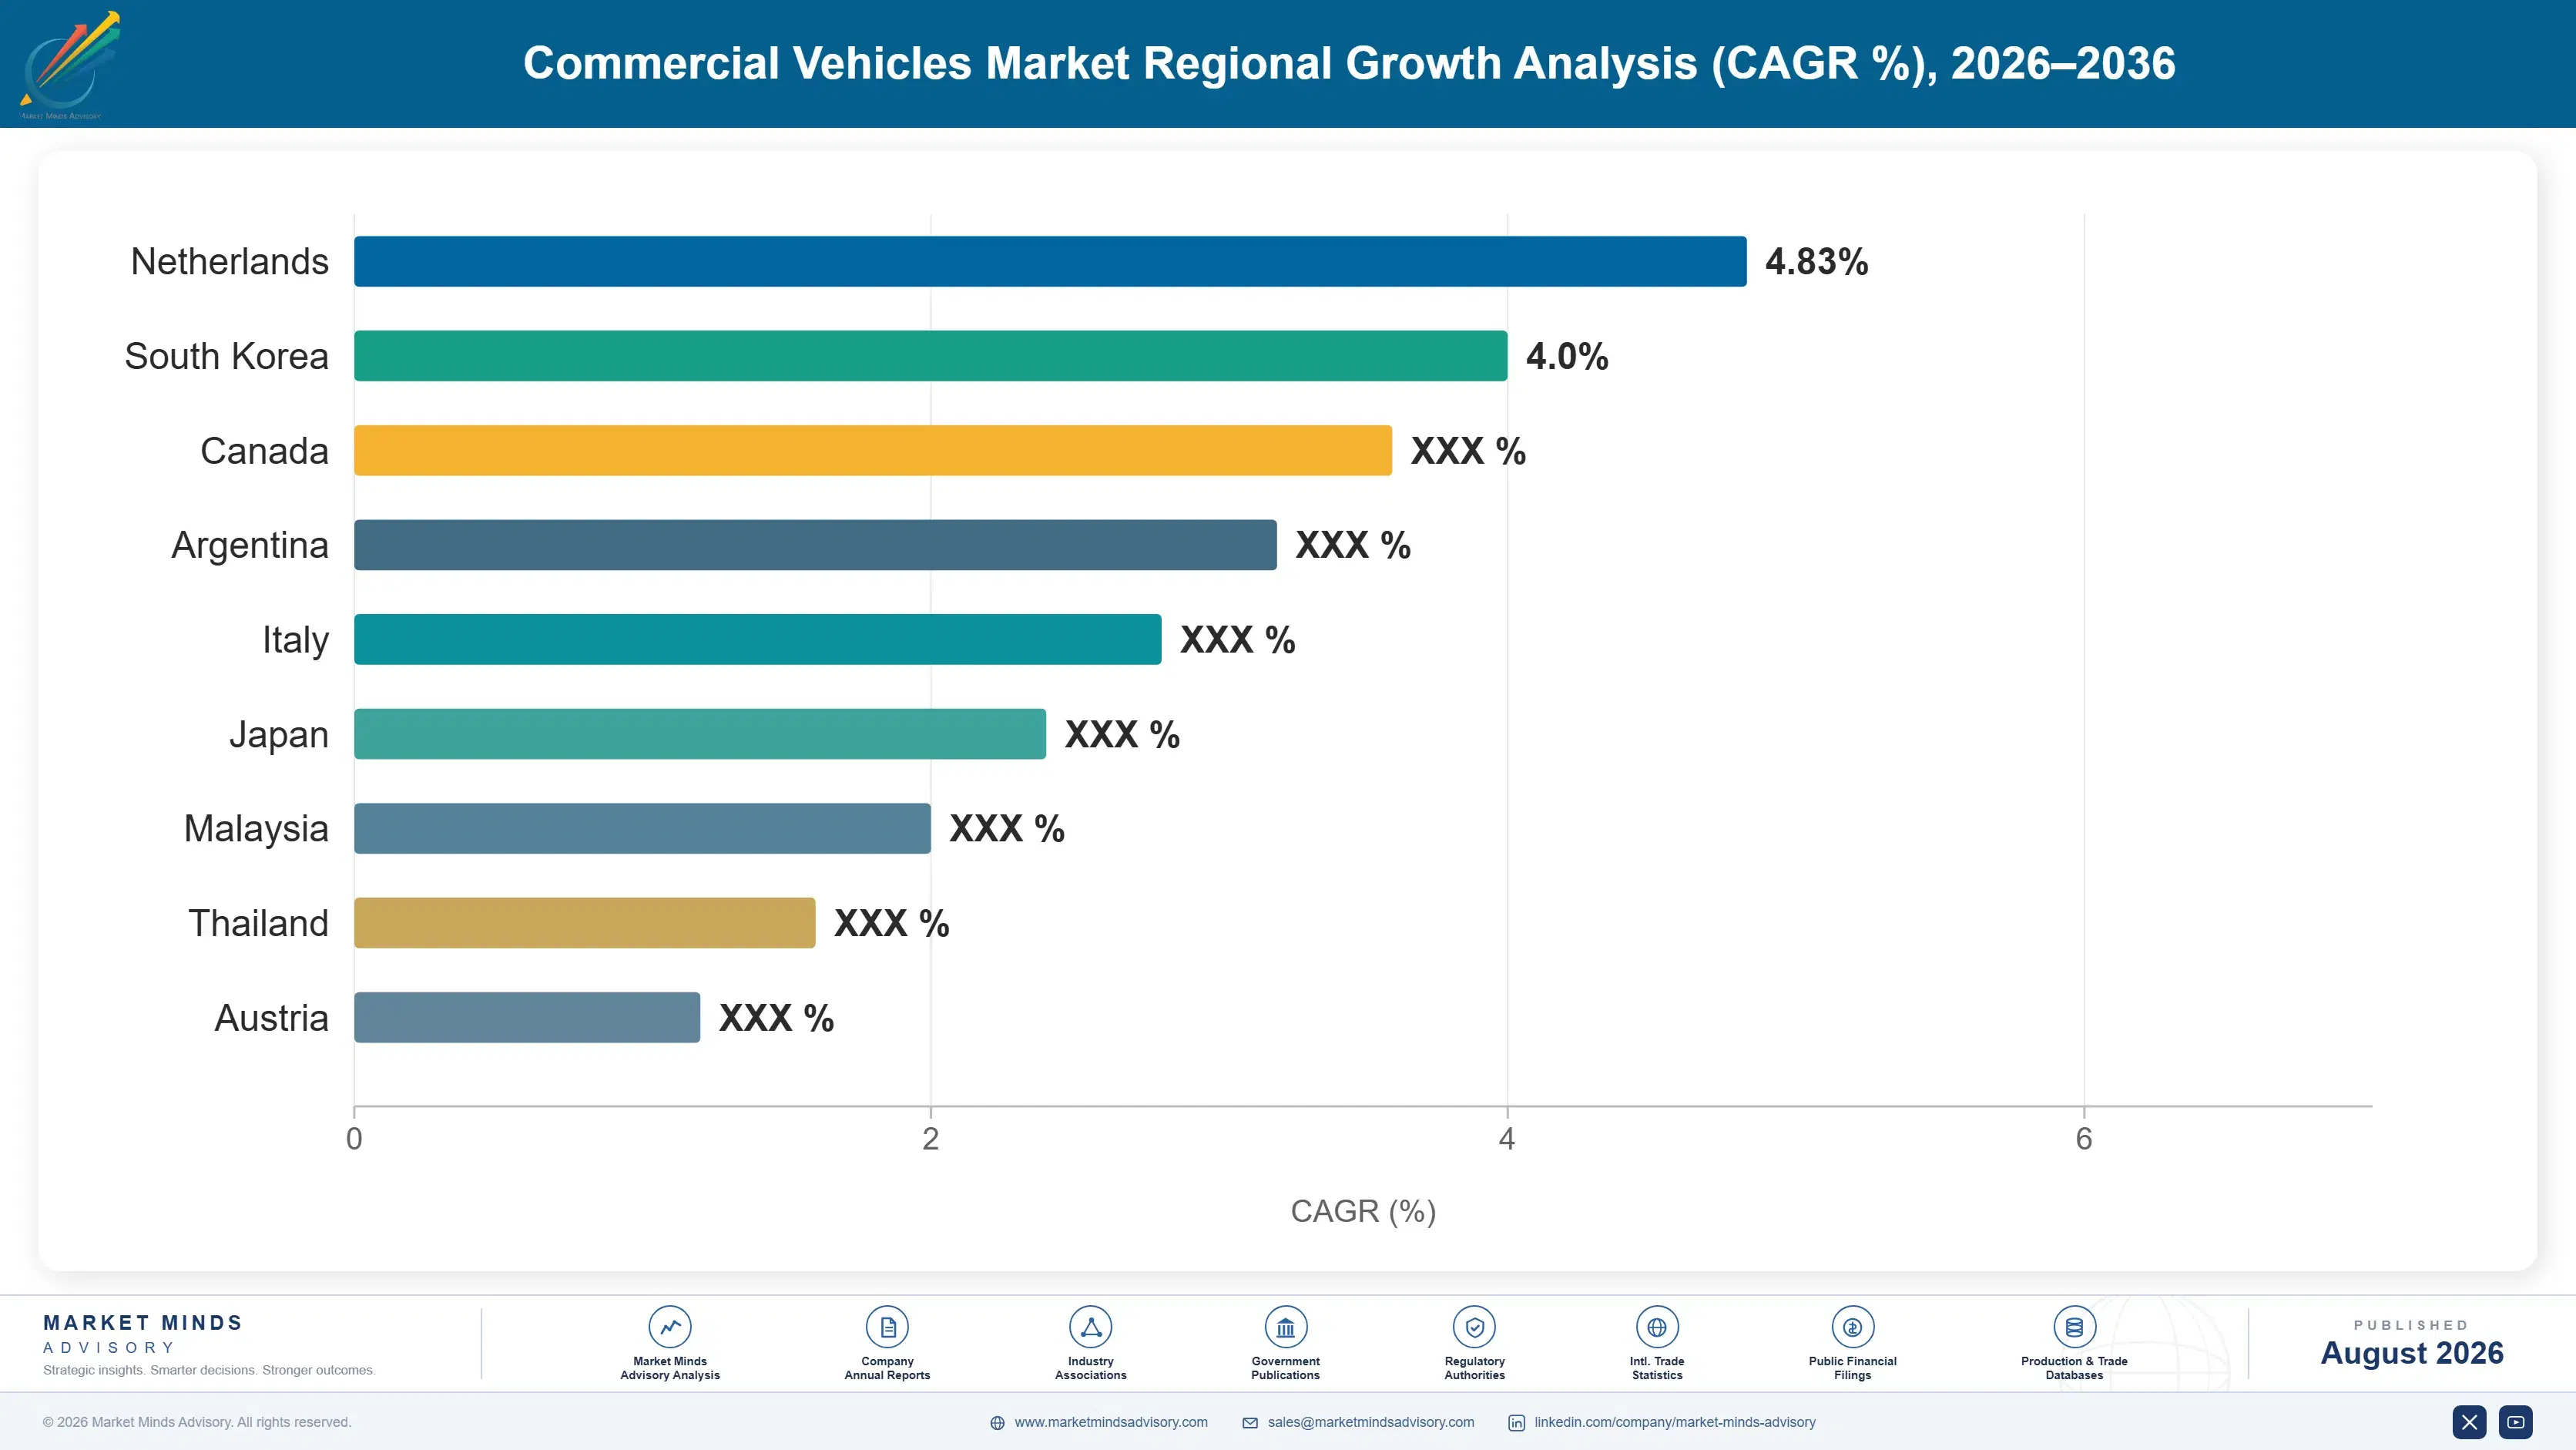
commercial-vehicles-market-country-cagr-analysis-1787324152959

Where Commercial Vehicle Margin Actually Concentrates

Competing on vehicle price alone concentrates margin in exactly the segment carrying the thinnest returns across the entire global industry today. The four moves below shift value toward positions that duty cycle economics and regulation actively protect: electrified urban fleets, vocational specification depth, export manufacturing scale, and financing attached directly to the vehicle sale itself.

Prioritise Electrified Platforms for Return-to-Depot Duty Cycles

Total cost of ownership already favours electric powertrains on urban delivery and fixed-route transit, where charging infrastructure amortises well and range anxiety barely applies, yet many manufacturers still allocate electrified platform investment evenly across duty cycles regardless of which ones actually clear the economic bar today. Concentrating engineering and manufacturing capacity on depot-based applications captures share where the transition is already commercially rational, rather than waiting for battery chemistry to solve long-haul economics on its own timeline. Urban electric total cost of ownership parity has reached roughly 60% of qualifying routes in leading markets already.
Market Impact: Urban electric parity now reaches 6

Deepen Vocational and Specialty Specification Capability

Vocational vehicles grow at 6.9% against a 6.2% overall market and carry meaningfully higher margin than standard freight trucks because specification complexity and body-builder relationships create switching costs a commodity chassis never generates on its own. Manufacturers with strong upfitter networks and factory-ready specification options capture disproportionate value relative to unit volume, since municipal and construction buyers consistently pay for reliability and customisation over marginal price differences alone. Building closer relationships with body-equipment manufacturers, rather than treating them as an afterthought sales channel, extends the specification lead considerably over time.
Market Impact: Vocational segment growth runs 0.7

Convert Domestic Manufacturing Scale Into Export Volume

Chinese and Indian manufacturers have already demonstrated that domestic production scale translates into export price advantages of 15 to 25 percent against incumbent Western and Japanese offerings, and that gap is unlikely to close quickly given the capital cost of matching that scale elsewhere. Manufacturers sitting on underutilised domestic capacity should prioritise export market entry now, while quality perception gaps are still closing rather than closed, since the pricing advantage compounds further once a brand becomes established in a new market. Waiting simply concedes the advantage to whichever competitor moves first and fastest.
Market Impact: Export pricing runs 15 to 25% below

Attach Financing and Uptime Guarantees to the Sale

Fleet buyers increasingly value predictable total cost of ownership over vehicle price alone, and manufacturers offering integrated financing, maintenance contracts, and uptime guarantees capture recurring revenue that a one-time vehicle sale never generates while also deepening the customer relationship against competitive displacement at the next replacement cycle entirely. This model works best where telematics data already exists to substantiate uptime commitments credibly to a fleet buyer. PACCAR and Daimler Truck have both expanded financial services revenue to roughly 8 to 12 percent of total segment profit across recent reporting periods.
Market Impact: Financial services add 8 to 12% of

Who Controls the Margin Pool

Concentration is moderate: the top five hold roughly 42% of global shipment volume, with a long tail of regional specialists competing effectively in specific vehicle classes and geographies. The gap between leaders and challengers is manufacturing scale and dealer network depth rather than product technology, which is widely distributed. All participants here are assessed on global commercial vehicle shipment volume as disclosed in annual filings, held consistently throughout this section.
Competition runs along four lines. First, manufacturing cost position, where Chinese and Indian scale increasingly beats Western and Japanese incumbents on mid-tier product. Second, dealer and service network depth, which determines uptime and remains difficult to replicate quickly. Third, electrified platform readiness for urban and transit applications. Fourth, financing and uptime guarantee capability attached to the vehicle sale itself.

Pressure is building from two directions. Chinese and Indian manufacturers are exporting into markets Western OEMs treated as stable for decades, while Chinese electric bus manufacturers have already built global leadership in that specific segment ahead of most competitors' strategic timelines. Rankings should favour manufacturers with genuine export manufacturing scale and electrified depot-duty platforms over those defending premium positioning in segments now facing credible low-cost competition.
commercial-vehicles-market-company-positioning-matrix-1787324153828

Competitive Moat and Risk Dimensions

DAIMLER TRUCK

Moat: Global dealer network and scale

Daimler Truck operates the largest global dealer and service network in the industry, spanning Freightliner, Mercedes-Benz Trucks, and Mitsubishi Fuso brands across multiple continents. That density supports uptime guarantees competitors struggle to match at comparable scale. Manufacturing footprint across North America, Europe, and Asia provides genuine geographic diversification against any single regional downturn.
DAIMLER TRUCK

Risk: Export competition from Asian entrants

Chinese and Indian manufacturers are entering export markets Daimler Truck has held for decades at price points fifteen to twenty-five percent below its offerings. Its cost structure, built around Western labour and component sourcing, cannot match that gap without meaningful restructuring. Electrification investment across three separate brand platforms also spreads capital thinner than a more consolidated competitor would need.
VOLVO GROUP

Moat: Electrified platform engineering depth

Volvo Group has invested in electrified truck and bus platforms earlier and more consistently than most peers, building genuine engineering depth in battery integration and charging partnerships. Its construction equipment and marine engine divisions provide diversification and cross-technology transfer that single-segment competitors lack entirely. European regulatory relationships built over decades support early positioning on emerging emission standards.
VOLVO GROUP

Risk: European cost base under pressure

European manufacturing costs sit well above Chinese and Indian levels, and Volvo Group's premium positioning depends on brand and reliability perception holding against improving Asian quality. Slower European freight growth, a consequence of the region's mature industrial base, constrains organic expansion at home. Export markets increasingly see Chinese competition on price and electric bus technology.

Players Tracked

Prominent Players

Daimler Truck
Volvo Group
Traton Group
Tata Motors
PACCAR

Other Key Players

Isuzu Motors
Hino Motors
Dongfeng Motor Corporation
FAW Jiefang
Ashok Leyland
Navistar International
Iveco Group
Hyundai Motor Company
Mahindra and Mahindra
CNH Industrial
BYD Company
Foton Motor
Force Motors
Sinotruk
VDL Groep

Recent Developments

FEBRUARY 2025

Daimler Truck expands electric truck production capacity in North America

Daimler Truck announced expanded production capacity for its electric Freightliner eCascadia and eM2 models at its North Carolina facility, responding to fleet orders concentrated in depot-based regional and urban delivery applications. This was an organic capacity expansion rather than an acquisition, reflecting confidence in near-term electrification demand.
Signal: Capacity investment concentrates on duty c
JUNE 2024

Traton Group and Hyundai Motor sign heavy truck technology cooperation agreement

Traton Group and Hyundai Motor Company signed a cooperation agreement covering shared component development and potential joint procurement across heavy truck platforms. This was a technology and procurement cooperation agreement rather than a merger or equity transaction, aimed at spreading development cost across a larger combined production base.
Signal: Even well-resourced incumbents now seek sh
NOVEMBER 2024

Tata Motors completes acquisition of additional commercial vehicle component capacity

Tata Motors completed the acquisition of a component manufacturing facility to support expanding domestic and export truck production, strengthening backward integration into axle and transmission manufacturing capability. This was a genuine acquisition rather than a joint venture, supporting cost position ahead of planned export volume growth.
Signal: Backward integration into components is ho

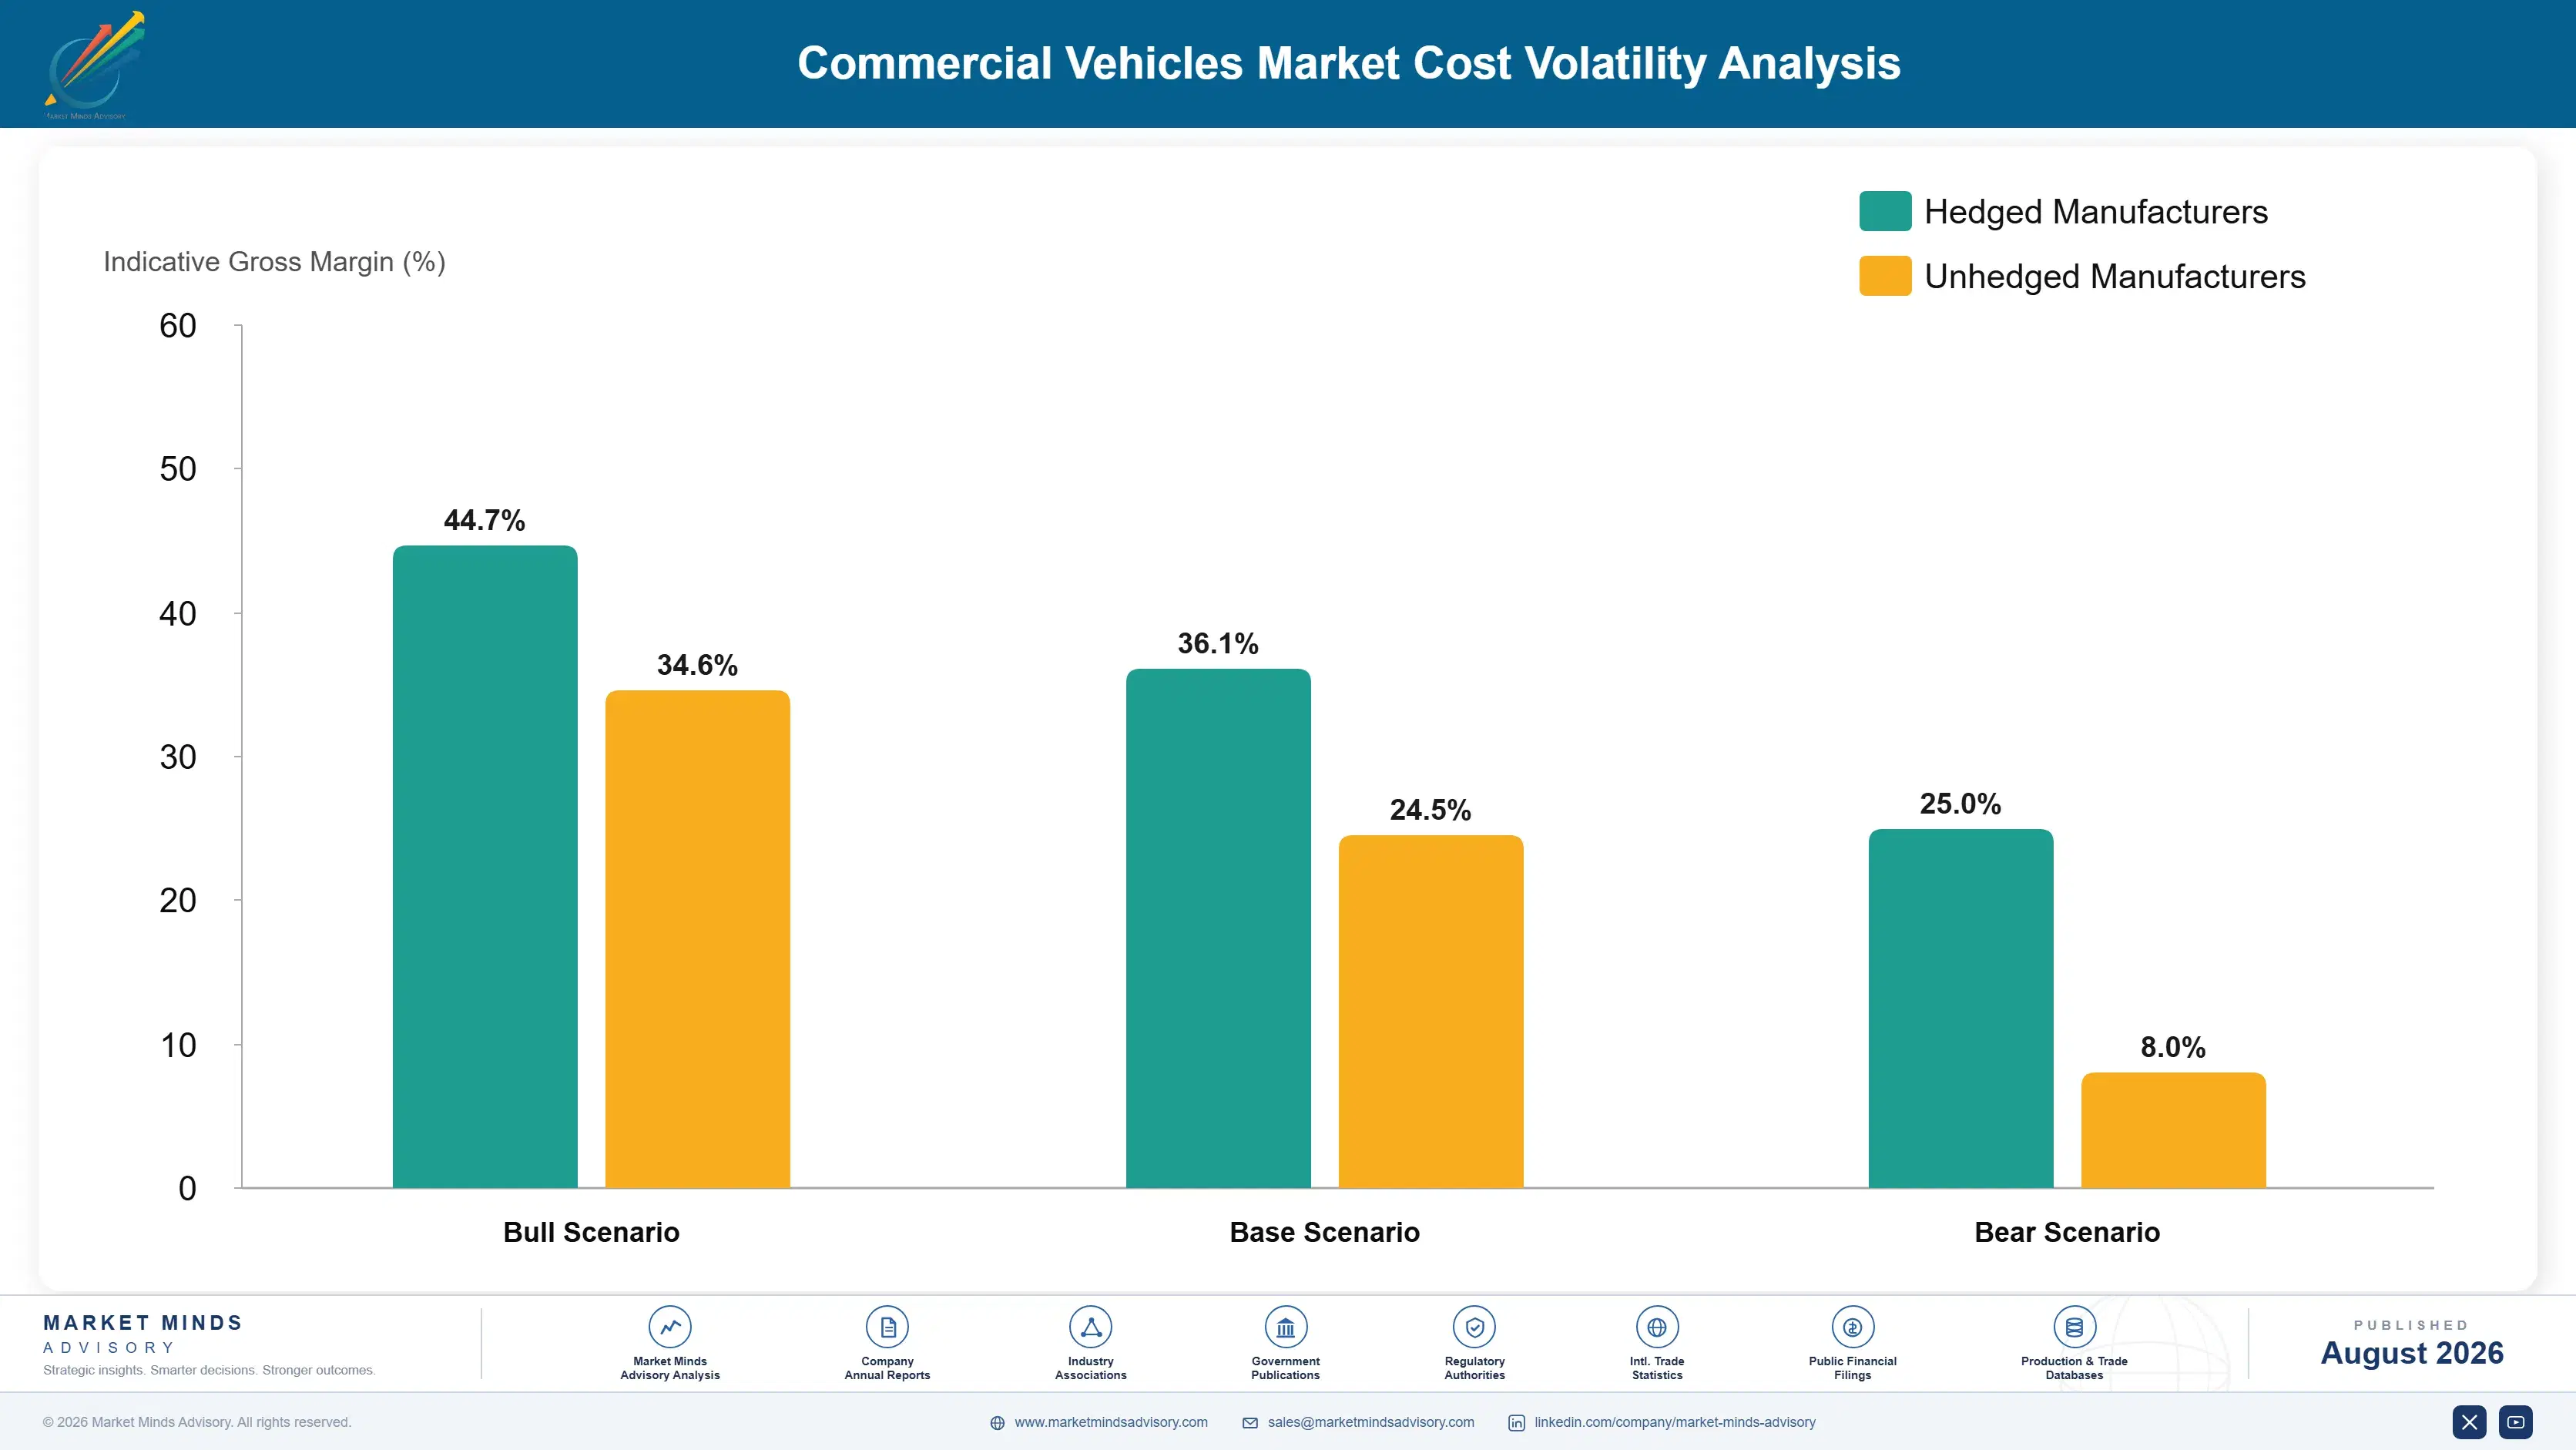
Steel, Powertrain Components, and Battery Cells

Steel and powertrain components dominate commercial vehicle cost structure, accounting for 55% to 65% of cost of goods sold depending on vehicle class and powertrain type. Steel sourcing runs through global commodity markets, while diesel powertrain components including engines and transmissions concentrate among a handful of specialist suppliers. Battery cells, an increasingly material cost line, source predominantly from Chinese and Korean cell manufacturers regardless of assembly location.
Steel price volatility through 2021 and 2022 illustrated the exposure clearly, with global hot-rolled coil prices more than doubling briefly before easing through 2023, per World Steel Association data. Manufacturers with long-term supply contracts absorbed less of that swing than spot-market buyers, and several OEMs disclosed meaningful gross margin compression in annual reports covering that period. Battery cell pricing moved in the opposite direction, falling steadily as manufacturing scale in China expanded.

Exposure separates clearly by manufacturing integration and scale. Large OEMs with long-term steel and component contracts absorb volatility better than smaller regional manufacturers buying on shorter terms or spot markets. Battery cell dependence on Chinese and Korean suppliers exposes every electrified platform manufacturer equally regardless of assembly location, a genuine vulnerability the industry has only begun addressing.
commercial-vehicles-market-cost-volatility-analysis-1787324154146

Secure long-term steel and component supply contracts

Spot-market steel buying exposed smaller manufacturers to margin compression that larger competitors with long-term contracts avoided considerably throughout the recent volatility cycle. Multi-year agreements with price adjustment mechanisms smooth that volatility across the production cycle. The trade-off is reduced flexibility to benefit when prices fall, which larger manufacturers readily accept in exchange for planning certainty.

Invest directly in battery cell supply relationships

Dependence on Chinese and Korean cell manufacturers exposes every electrified platform to geopolitical and currency risk regardless of vehicle assembly location. Direct investment or joint ventures with cell manufacturers, following the pattern several passenger vehicle makers have set, secures supply and pricing certainty. The capital commitment is substantial and only justifies itself at meaningful electrified volume.

Build backward integration into axle and transmission manufacturing

Powertrain components concentrate among a few specialist suppliers, which limits negotiating leverage for manufacturers buying rather than making them in-house. Backward integration, as Tata Motors has pursued recently, secures supply and captures margin previously paid out to a third party entirely. This requires manufacturing scale sufficient to justify the capital investment involved upfront over time.

Portfolio Architecture for Margin Defence

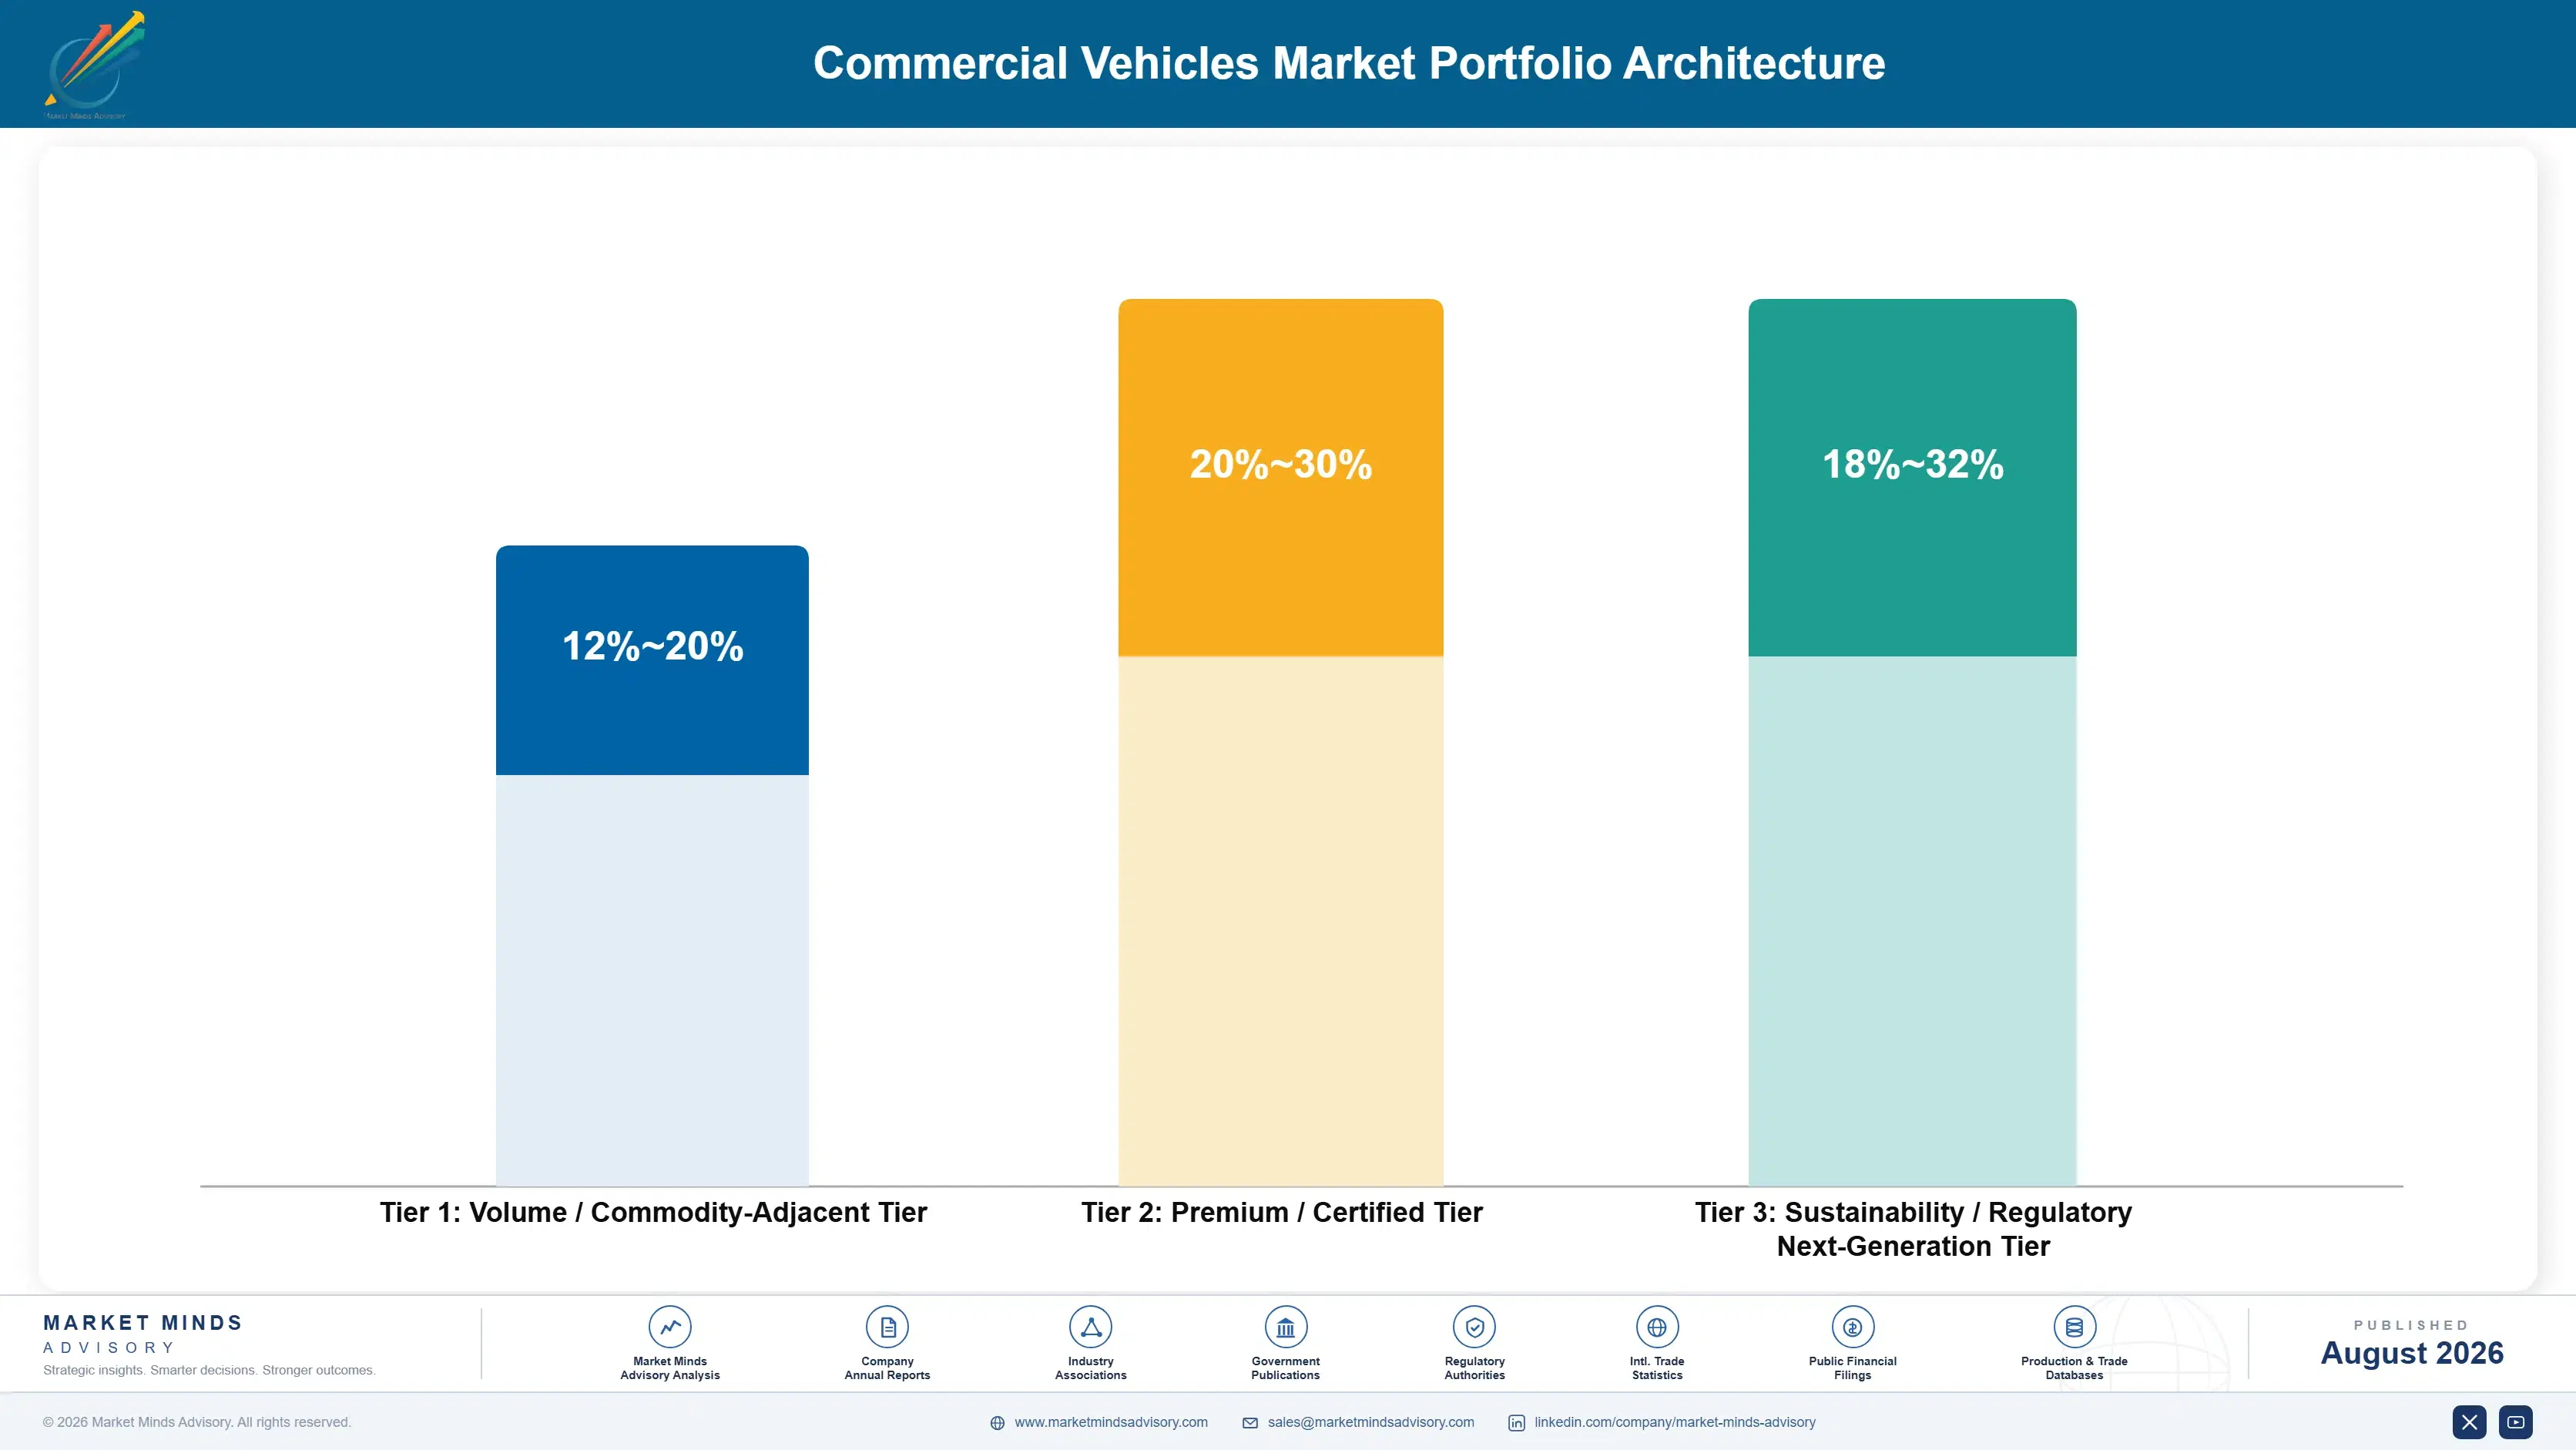
The portfolio splits into three tiers with distinct economics. Standard freight trucks form the volume tier, competing heavily on price and financing terms with margin set largely by manufacturing scale. Vocational and specialty vehicles earn considerably more because specification complexity and body-builder relationships create switching costs a commodity chassis never generates. Electrified platforms sit differently again, priced against total cost of ownership rather than against a diesel eq
The tension runs between volume manufacturing that funds the business today and electrified and export investment that positions it for the next decade. A manufacturer defending diesel volume too long cedes urban electrified share to competitors moving faster, while one over-investing in electrification ahead of duty-cycle economics burns capital before the market catches up. Companies managing this well sequence investment by duty cycle rather than by fleet-wide mandate.

High-value pools concentrate where specification complexity, regulation, or duty-cycle economics limit competition: vocational vehicles with deep body-builder integration, urban and transit electrified platforms where total cost of ownership already favours them, and financing or uptime services attached to the vehicle sale. Standard long-haul diesel trucks sit at the other end, competing almost entirely on price and manufacturing scale against every credible global producer.

Volume / Commodity-Adjacent Tier

Standard light, medium, and heavy-duty freight trucks competing primarily on price, financing terms, and dealer network depth. Margin is set largely by manufacturing scale and steel and component sourcing efficiency.
Gross Margin: 12-20%

Premium / Certified Tier

Vocational and specialty vehicles with body-builder integration, alongside premium long-haul tractors carrying advanced driver assistance and fuel-efficiency technology packages that command genuine price premiums from fleet buyers seeking lower total operating cost over the ownership period.
Gross Margin: 20-30%

Sustainability / Regulatory / Next-Generation Tier

Electrified urban and transit platforms, hydrogen fuel cell demonstration programmes, and integrated financing or uptime service contracts attached to vehicle sales, priced against total cost of ownership rather than a diesel equivalent directly.
Gross Margin: 18-32%
commercial-vehicles-market-portfolio-architecture-1787324154988

High-value Sub-segments and Strategic Watch-out

Buses and Coaches

High value and high growth at 7.5%, the fastest class in the market, driven almost entirely by public transit electrification funding rather than open commercial demand. Chinese manufacturers hold strong positions in electric bus supply, built years ahead of most Western competitors, though procurement remains lumpy across budget cycles.
Gross Margin: 20-30%

Vocational and Specialty Vehicles

High value with strong growth at 6.9%, second fastest, tracking infrastructure investment and municipal service budgets more closely than general freight volume. Specification complexity and body-builder relationships support margin well above standard freight trucks, and switching costs remain considerable once a fitter relationship is established.
Gross Margin: 20-30%

Heavy-Duty Trucks

The volume core by revenue, growing near 4.6% as long-haul freight volume tracks industrial production and consumer demand steadily across mature and emerging markets alike. Diesel remains dominant given persistent charging corridor gaps, though tightening emission regulation forces earlier replacement cycles across an increasing share of major fleets.
Gross Margin: 12-20%

Medium-Duty Trucks

The strategic watch-out, growing near 5.2% and squeezed between light commercial vehicle electrification pressure from below and heavy-duty platform consolidation pressure from above. Regional distribution demand sustains some volume, though intense competitive pressure keeps margin persistently thin across nearly every major regional market worldwide today.
Gross Margin: 12-20%

How Fleet Replacement Revenue Actually Concentrates

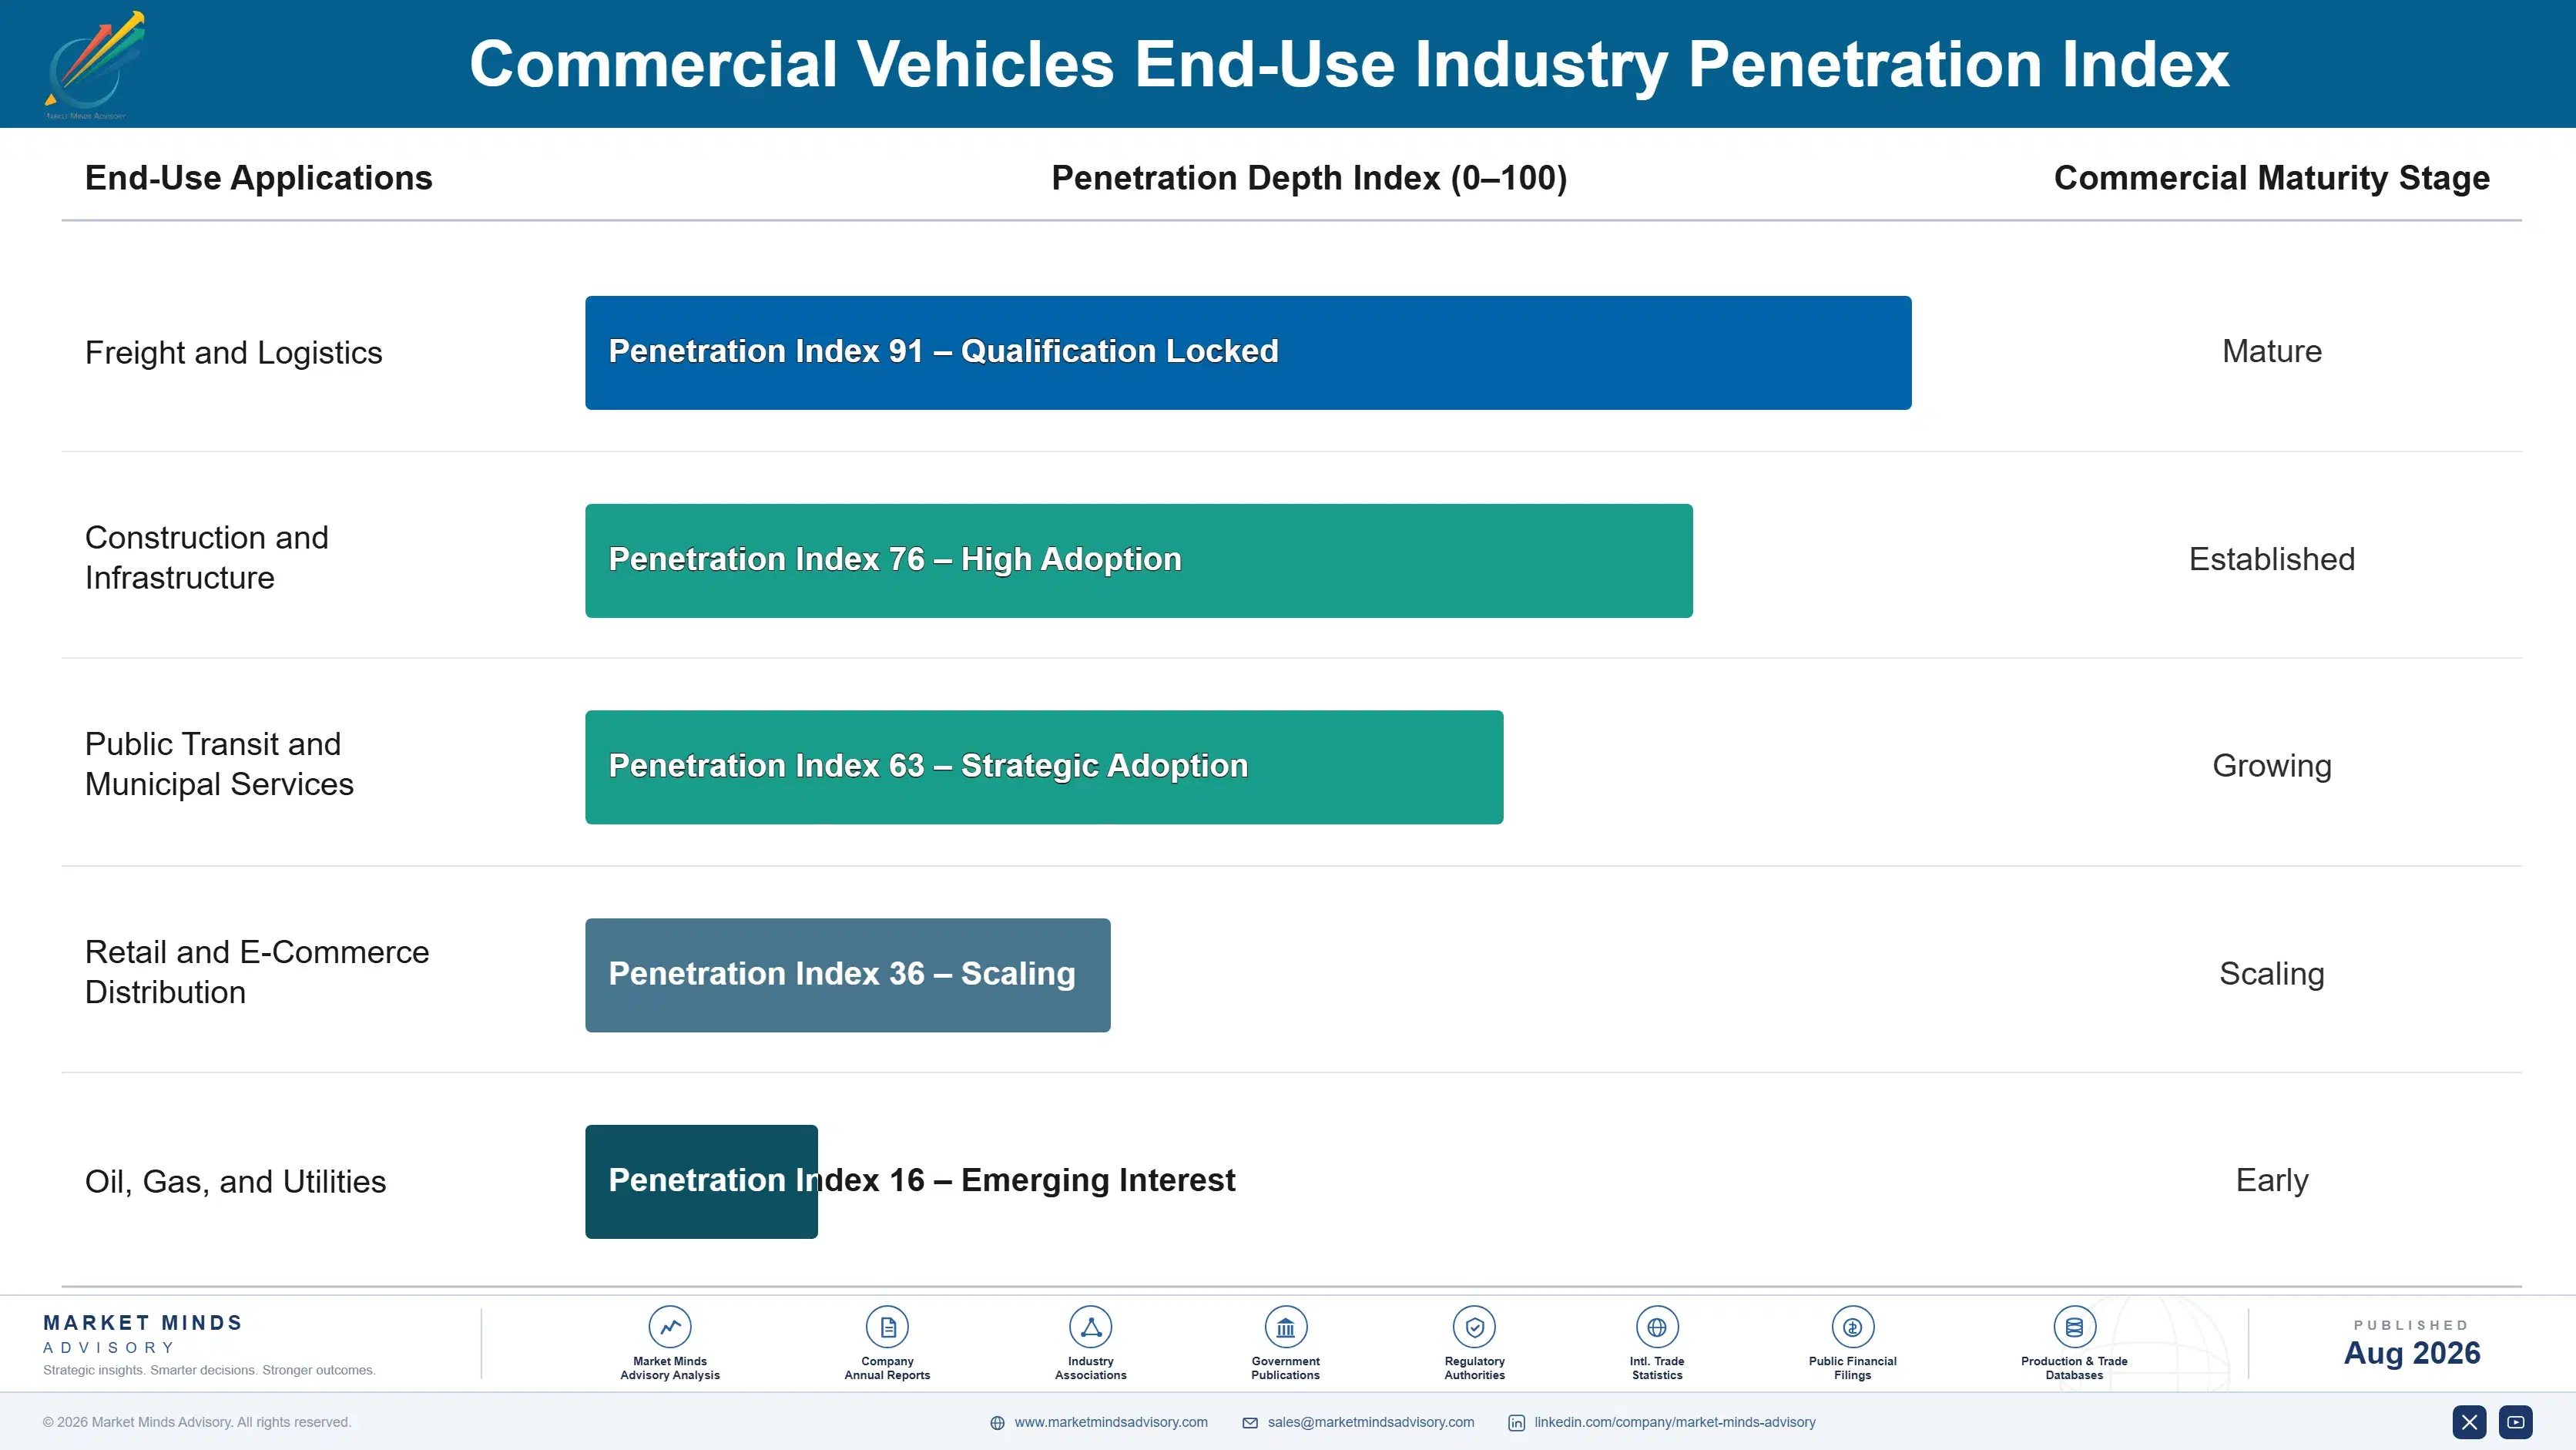
Revenue depends on replacement cycles rather than fleet expansion in most mature markets, and a vehicle sold today generates parts, service, and financing revenue for seven to twelve years afterward. That tail revenue often exceeds the original vehicle margin over the ownership period, which makes dealer network depth more valuable than unit volume alone would suggest. Losing a service relationship costs more than losing a single vehicle sale.
Adoption depth varies sharply by end-use vertical. Municipal and transit buyers commit to electrified platforms once budget and grant funding align, and switching back to diesel rarely happens once infrastructure is built. Long-haul operators remain the most conservative, since duty cycle economics have not flipped for most routes yet. Construction and vocational buyers sit in between, adopting selectively where routes suit current battery range.

Buyer profiles have shifted from owner-operators toward fleet procurement committees who model total cost of ownership formally rather than by instinct. Sustainability mandates within large logistics and retail companies increasingly influence fleet specification even where the buyer itself is a third-party carrier. Younger fleet managers also weigh telematics and uptime data more heavily than predecessors did, which favours manufacturers with genuine digital service capability.
commercial-vehicles-market-end-use-penetration-index-1787324155818

Our Call on Commercial Vehicles

These are among the four positions where our research anticipates prominent divergence between winners and laggards over the coming forecast period. Each is grounded in the demand model, the regulatory perimeter, and the announced capacity pipeline.
01 / DUTY CYCLE DECIDES POWERTRAIN

Route pattern matters more than any policy mandate

Total cost of ownership already favours electric powertrains on urban and transit routes, where charging infrastructure amortises well and range anxiety barely applies to a return-to-depot duty cycle. Long-haul freight remains a different calculation entirely, since battery weight displaces payload and charging time competes directly with regulated driver hours across most jurisdictions. Manufacturers should allocate electrified platform investment by duty cycle economics rather than by fleet-wide mandate, since the segments already clearing the total cost bar deserve the capital first.
02 / EXPORT SCALE THREATENS INCUMBENTS

Chinese and Indian manufacturing cost advantage is durable

Chinese and Indian manufacturers have already built domestic scale that translates into export pricing fifteen to twenty-five percent below incumbent Western and Japanese offerings, and that gap will not close quickly given the capital required to match it elsewhere. Quality perception, once the binding constraint, has improved enough that price-sensitive markets now accept the trade-off readily and at real scale. Incumbents should prioritise vocational specification depth and financing services where scale-based competition matters far less than relationship and customisation depth.
03 / REGULATION SETS REPLACEMENT TIMING

Emission rules now override maintenance economics

Euro 7, China VI, and tightening United States nitrogen oxide standards force earlier vehicle retirement regardless of mechanical condition, since compliance retrofits frequently cost considerably more than residual value justifies across most fleet categories today. Low-emission urban zones compound the effect by removing secondary market value that once extended vehicle life considerably. Manufacturers should plan production mix around this regulatory clock as carefully as around organic freight growth, since replacement demand increasingly follows policy calendars rather than fleet age alone.
04 / SERVICE REVENUE OUTWEIGHS SALE

The vehicle sale funds a decade of recurring revenue

A vehicle sold today generates parts, service, and financing revenue for seven to twelve years afterward, often exceeding the original sale margin across that entire ownership period by a genuinely wide margin. Dealer network depth and digital service capability consequently matter more than unit volume alone would suggest to a casual observer. Manufacturers should invest in telematics-enabled service and financing offerings that deepen the customer relationship, since losing a service relationship costs considerably more than losing one single vehicle sale.

Engagement Snapshot From the Field

A live engagement with an industry participant carrying material or product regulatory and market exposure ahead of a defining policy shift, showing how our research translates into a defensible multi-year portfolio strategy.
MARKET MINDS ADVISORY · CLIENT ENGAGEMENT SUMMARY
Commercial Vehicles Producer Strategic Portfolio Review and Transition Roadmap 2026·Investment Scenario on Commercial Vehicles Exposure Evaluation 2025-26
CLIENT PROFILE
A regional freight and logistics operator running a mixed fleet of roughly 1,400 trucks across last-mile, regional-haul, and long-haul routes engaged MMA to evaluate fleet electrification timing ahead of a board review. The client reported fleet operating cost near USD 210 million annually, with fuel and maintenance together representing the largest controllable expense category across the whole fleet (client-reported, unverified by MMA).
STRATEGIC CHALLENGE
Corporate sustainability commitments pushed toward fleet-wide electrification targets set without route-level total cost of ownership analysis. Operations leadership suspected the blanket target would destroy value on long-haul routes while under-investing in last-mile applications where electrification already made economic sense. The board wanted a route-differentiated strategy rather than a uniform mandate applied without regard to duty cycle.
MMA APPROACH
MMA modelled total cost of ownership route by route, segmenting the fleet by duty cycle, charging infrastructure availability, and route distance rather than treating the fleet as a single electrification decision. We benchmarked charging corridor investment plans against the client's regional-haul lanes specifically. We then sequenced a phased electrification plan aligned to where the economics already favoured the transition.
KEY FINDINGS
  1. Last-mile routes representing 35% of the fleet already cleared total cost of ownership parity, while corporate targets had allocated electrification budget evenly across all route types (client-reported, unverified by MMA).
  2. Regional-haul routes lacked charging corridor infrastructure sufficient to support conversion within the planned five-year target window without a considerable additional capital investment commitment.
  3. Long-haul routes, roughly 20% of the fleet, would not reach total cost of ownership parity for at least eight to ten years absent a major battery cost breakthrough.
  4. Reallocating planned electrification capital toward last-mile and select regional-haul lanes improved projected five-year fleet operating savings by roughly 18% (client-reported, unverified by MMA).
CLIENT PROFILE
A regional freight and logistics operator running a mixed fleet of roughly 1,400 trucks across last-mile, regional-haul, and long-haul routes engaged MMA to evaluate fleet electrification timing ahead of a board review. The client reported fleet operating cost near USD 210 million annually, with fuel and maintenance together representing the largest controllable expense category across the whole fleet (client-reported, unverified by MMA).
STRATEGIC CHALLENGE
Corporate sustainability commitments pushed toward fleet-wide electrification targets set without route-level total cost of ownership analysis. Operations leadership suspected the blanket target would destroy value on long-haul routes while under-investing in last-mile applications where electrification already made economic sense. The board wanted a route-differentiated strategy rather than a uniform mandate applied without regard to duty cycle.
MMA APPROACH
MMA modelled total cost of ownership route by route, segmenting the fleet by duty cycle, charging infrastructure availability, and route distance rather than treating the fleet as a single electrification decision. We benchmarked charging corridor investment plans against the client's regional-haul lanes specifically. We then sequenced a phased electrification plan aligned to where the economics already favoured the transition.
KEY FINDINGS
  1. Last-mile routes representing 35% of the fleet already cleared total cost of ownership parity, while corporate targets had allocated electrification budget evenly across all route types (client-reported, unverified by MMA).
  2. Regional-haul routes lacked charging corridor infrastructure sufficient to support conversion within the planned five-year target window without a considerable additional capital investment commitment.
  3. Long-haul routes, roughly 20% of the fleet, would not reach total cost of ownership parity for at least eight to ten years absent a major battery cost breakthrough.
  4. Reallocating planned electrification capital toward last-mile and select regional-haul lanes improved projected five-year fleet operating savings by roughly 18% (client-reported, unverified by MMA).
RECOMMENDED STRATEGY
Phase 1: Phase 1 (0 to 12 months): Electrify last-mile routes already clearing total cost of ownership parity, funded by capital reallocated from long-haul. Phase 2: Phase 2 (12 to 30 months): Partner with charging providers on regional-haul corridor investment ahead of broader fleet conversion planning. Phase 3: Phase 3 (30 to 60 months): Revisit long-haul electrification timing against battery cost trends and corridor infrastructure build-out progress made.
OUTCOME
The client redirected its electrification budget toward routes where total cost of ownership already favoured the transition, improving projected five-year operating savings meaningfully against the original uniform plan. The board adopted route-level total cost of ownership analysis as standard practice for future fleet capital decisions (client-reported, unverified by MMA).

Frequently Asked Questions

Foundational context covering the market sizes, CAGR, scope, country, region and competition that inform every finding below. This section is provided to cover basics and most often pre-purchase conversations, answered from the MMA Primary Research Dataset.

What is the current size of the Commercial Vehicles Market?

The global commercial vehicles market is valued at USD 985.0 billion in 2025, covering light, medium, and heavy-duty trucks, buses, coaches, and vocational chassis. Passenger cars and off-highway equipment are excluded.

How large will the Commercial Vehicles Market be by 2036?

The market is forecast to reach USD 1,909.0 billion by 2036 in the base case, about 1.82 times the 2026 level. That represents incremental value of roughly USD 862.93 billion across the decade.

What is the CAGR for the Commercial Vehicles Market 2026 to 2036?

The market grows at a 6.2% CAGR in the base case, with bull and bear scenarios at 7.4% and 4.9%. The spread turns mainly on electrification pace and freight cycle strength.

Which segment is growing fastest?

Buses and coaches grow fastest at 7.5%, about 1.21 times the overall rate, driven by public transit electrification funding. Vocational and specialty vehicles follow at 6.9%.

Who are the major companies in the Commercial Vehicles Market?

Leading companies include Daimler Truck, Volvo Group, Traton Group, Tata Motors, and PACCAR. Concentration is moderate, with the top five holding roughly 42% of global shipment volume.

Which country is growing fastest?

India grows fastest at a 9.6% CAGR, driven by freight corridor investment and logistics formalisation under tax reform. Southeast Asian markets follow on similar formalisation trends.

Report Segmentation Architecture

The full report scope spans multiple orthogonal segmentation dimensions, with cross-tabulated demand data provided for each dimension pair. Coverage extends further to regional breakdowns, trend trajectories, and the competitive detail needed to support segment-level decision-making.

By Vehicle Class

  • Light Commercial Vehicles
  • Medium-Duty Trucks
  • Heavy-Duty Trucks
  • Buses and Coaches
  • Vocational and Specialty Vehicles

By End-Use Industry

  • Freight and Logistics
  • Construction and Infrastructure
  • Public Transit and Municipal Services
  • Retail and E-Commerce Distribution
  • Oil, Gas, and Utilities

By Commercial Dimension

  • Fleet Operator Direct Purchase
  • Leasing and Financing Channel
  • Government and Municipal Procurement
  • Owner-Operator Retail Channel

By Region

  • North America
  • Western Europe
  • East Asia
  • South Asia and Pacific
  • Latin America
  • Middle East and Africa
  • Eastern Europe

Scope, Methodology, and Coverage

Every figure in this report is reproducible from documented input assumptions. The scope below maps the historical period, the forecast horizon, the segmentation dimensions, and the countries covered, alongside the underlying primary and qualitative methodology.
Historical Period
2020 to 2025
Forecast Period
2026 to 2036
Base Year
2025 (USD billions; MMA Primary Research Dataset, August 2026)
Market Definition
The commercial vehicles market comprises the manufacture and sale of light, medium, and heavy-duty trucks, buses, coaches, and vocational or specialty chassis used for freight transport, passenger transit, and municipal or construction service duty, valued at manufacturer revenue for new vehicle units. Passenger cars, two-wheelers and three-wheelers, off-highway construction and mining equipment, aftermarket parts and accessories sold separately, and used vehicle resale transactions are excluded.
Quantitative Units
USD billions (current prices); unit shipment volume where applicable
Segmentation Dimensions
By Vehicle Class; By End-Use Industry; By Commercial Dimension; By Region
Regions Covered
North America, Western Europe, East Asia, South Asia and Pacific, Latin America, Middle East and Africa, Eastern Europe
Countries Covered
USA, China, Germany, France, UK, Japan, South Korea, India, Australia, Canada, Brazil, Mexico, Indonesia, Vietnam, Thailand, Malaysia, UAE, Saudi Arabia, South Africa, Nigeria, Turkey, Poland, Netherlands, Italy, Spain, Sweden, Switzerland, Argentina, Colombia, Singapore, and additional markets relevant to this sector
Key Companies Profiled
Daimler Truck, Volvo Group, Traton Group, Tata Motors, PACCAR, Isuzu Motors, Hino Motors, Dongfeng Motor Corporation, FAW Jiefang, Ashok Leyland, Navistar International, Iveco Group, Hyundai Motor Company, Mahindra and Mahindra, CNH Industrial, BYD Company, Foton Motor, Force Motors, Sinotruk, VDL Groep
Quantitative Methodology
Primary survey, n=3,800 respondents, Q4 2025, six countries; demand-side model with trade association cross-validation
Qualitative Methodology
47 expert interviews, Q4 2025; applied to validate demand model assumptions, identify emerging dynamics, and assess competitive positioning
Report Format
PDF and XLSX data workbook (Word format preview document)
Publisher
Market Minds Advisory
Report Code
MMA-2026-AUT-101
Published
August 2026
Contact
sales@marketmindsadvisory.com | www.marketmindsadvisory.com

Purchase the full Commercial Vehicles Market Report (2026 to 2036).

The full MMA Commercial Vehicles report sizes the market across five vehicle classes, five end-use industries, four commercial channels, and seven regions through 2036. It profiles 20 companies on a consistent global shipment volume basis, scoring each on manufacturing cost position, electrified platform readiness, dealer network depth, and export competitiveness. Scenario models quantify how total cost of ownership shifts, emission regulation timing, and export manufacturing scale move both unit demand and achievable margin by vehicle class. The report also includes route-level electrification economics, charging corridor investment tracking, and export competitiveness benchmarking for OEM strategy and fleet procurement teams.
Five-class and four-channel market sizing to 2036
Twenty-company benchmark on global shipment volume basis
Route-level total cost of ownership electrification modelling
Emission regulation timing and fleet turnover impact analysis
Export competitiveness benchmarking by manufacturing origin
Charging and service infrastructure investment tracking

Built For The People Who Decide

From boardroom strategy to bench-side execution, this report is read cover-to-cover by leaders shaping the next decade of their industry, turning demand scenarios, market dynamics and valuation benchmarks into decisions.
CXOs/ Presidents/ VPs/ Managers
M&A and Corporate Development
Strategy Teams and R&D Heads
Procurement and Product Directors
Regulatory and Compliance Leaders
Investor Relations and Equity Analysts