Market Minds Advisory
China Clay Market

China Clay Market: An Industry Whose Main Customer Walked Away

Paper once took around three fifths of this mineral and now takes under a third, and the producers holding the brightest deposits optimised them for exactly the market that disappeared.

Lead Analyst

Bilal Shaikh

Published

August 2026

Make Smarter Decisions with Customized Research Insights

Request a free sample report and evaluate market opportunities, growth trends, and competitive dynamics relevant to your business needs.

2025 MARKET VALUE$4.6BMarket Size 2025
2036 FORECAST VALUE$6.9BBase Case , 2026 to 2036
CAGR 2026 TO 20363.8 %Bull 5.0% / Bear 2.6%
INCREMENTAL OPPORTUNITY$2.2BNet 10- year value creation
EXPANSION MULTIPLE1.45x2036 value over 2026 base
Strategic Levers
M&A Pipeline
Regional Outlook
Country Rankings
Competitive Intelligence
Segmental Deep-dive
Call-Us : 91 93563 13602

Executive Snapshot and Market Trajectory

Paper coating and filling once consumed around three fifths of world kaolin and now takes 31%. The producers who developed the brightest and finest deposits did so for exactly that application, and they have spent two decades redistributing volume into markets that buy different grades at different prices.
Growth runs at 3.8% and modified grades lead it. Calcined and surface-modified kaolin grows at 5.7%, exactly 1.50 times the market rate, because processing adds properties that raw brightness cannot and reaches polymer and coatings applications that pay for function. East Asia holds 35%, far outside band, since Chinese ceramic production and kaolin reserves both concentrate there. Ceramic and refractory demand tracks construction rather than publishing entirely.
Concentration is very low at 38% across the top five measured on processed tonnage supplied, and deposit ownership rather than processing capability explains it. Brightness ceilings are set by geology at around 92 on the standard scale, and no beneficiation plant raises a deposit above what the ore actually contains. Freight carries roughly 27% of landed cost for a low value bulk mineral. A producer competes inside a radius rather than across a market.
Market Definition
This market covers processed kaolin supplied for industrial applications, spanning paper coating and filling grades, ceramic and refractory grades, paint and coatings extender grades, rubber and polymer filler grades, and calcined and surface-modified grades. Crude unprocessed clay sold at the pit, ball clay and other plastic clays, bentonite, talc and other industrial minerals, finished ceramic and paper products, and kaolin-derived alumina or zeolite chemical products fall outside scope.
Base Year Value
$4.6B in 2025 (MMA Primary Research Dataset, August 2026)
Forecast Period
2026 to 2036, eleven discrete annual values
CAGR
3.8% base case. Bull 5.0%. Bear 2.6%.
Fastest Growth Segment
Calcined and Surface-Modified Grades: 5.7% CAGR
Fastest Growth Country
India: 6.4% CAGR
Fastest Growth Region
South Asia and Pacific: 5.9% CAGR
Largest Region
East Asia: 35% of 2025 global value
Market Leaders
Imerys, Sibelco, KaMin, Thiele Kaolin, BASF. Source: MMA Analysis based on company annual reports.
Primary Survey
n=3,800 procurement and R&D decision-makers, Q4 2025, six countries
Methodology
Demand-side build-up, cross-validated against public data, 47 expert interviews

China Clay Market Forecast Scenarios

china-clay-market-size-forecast-scenario-1787302689308
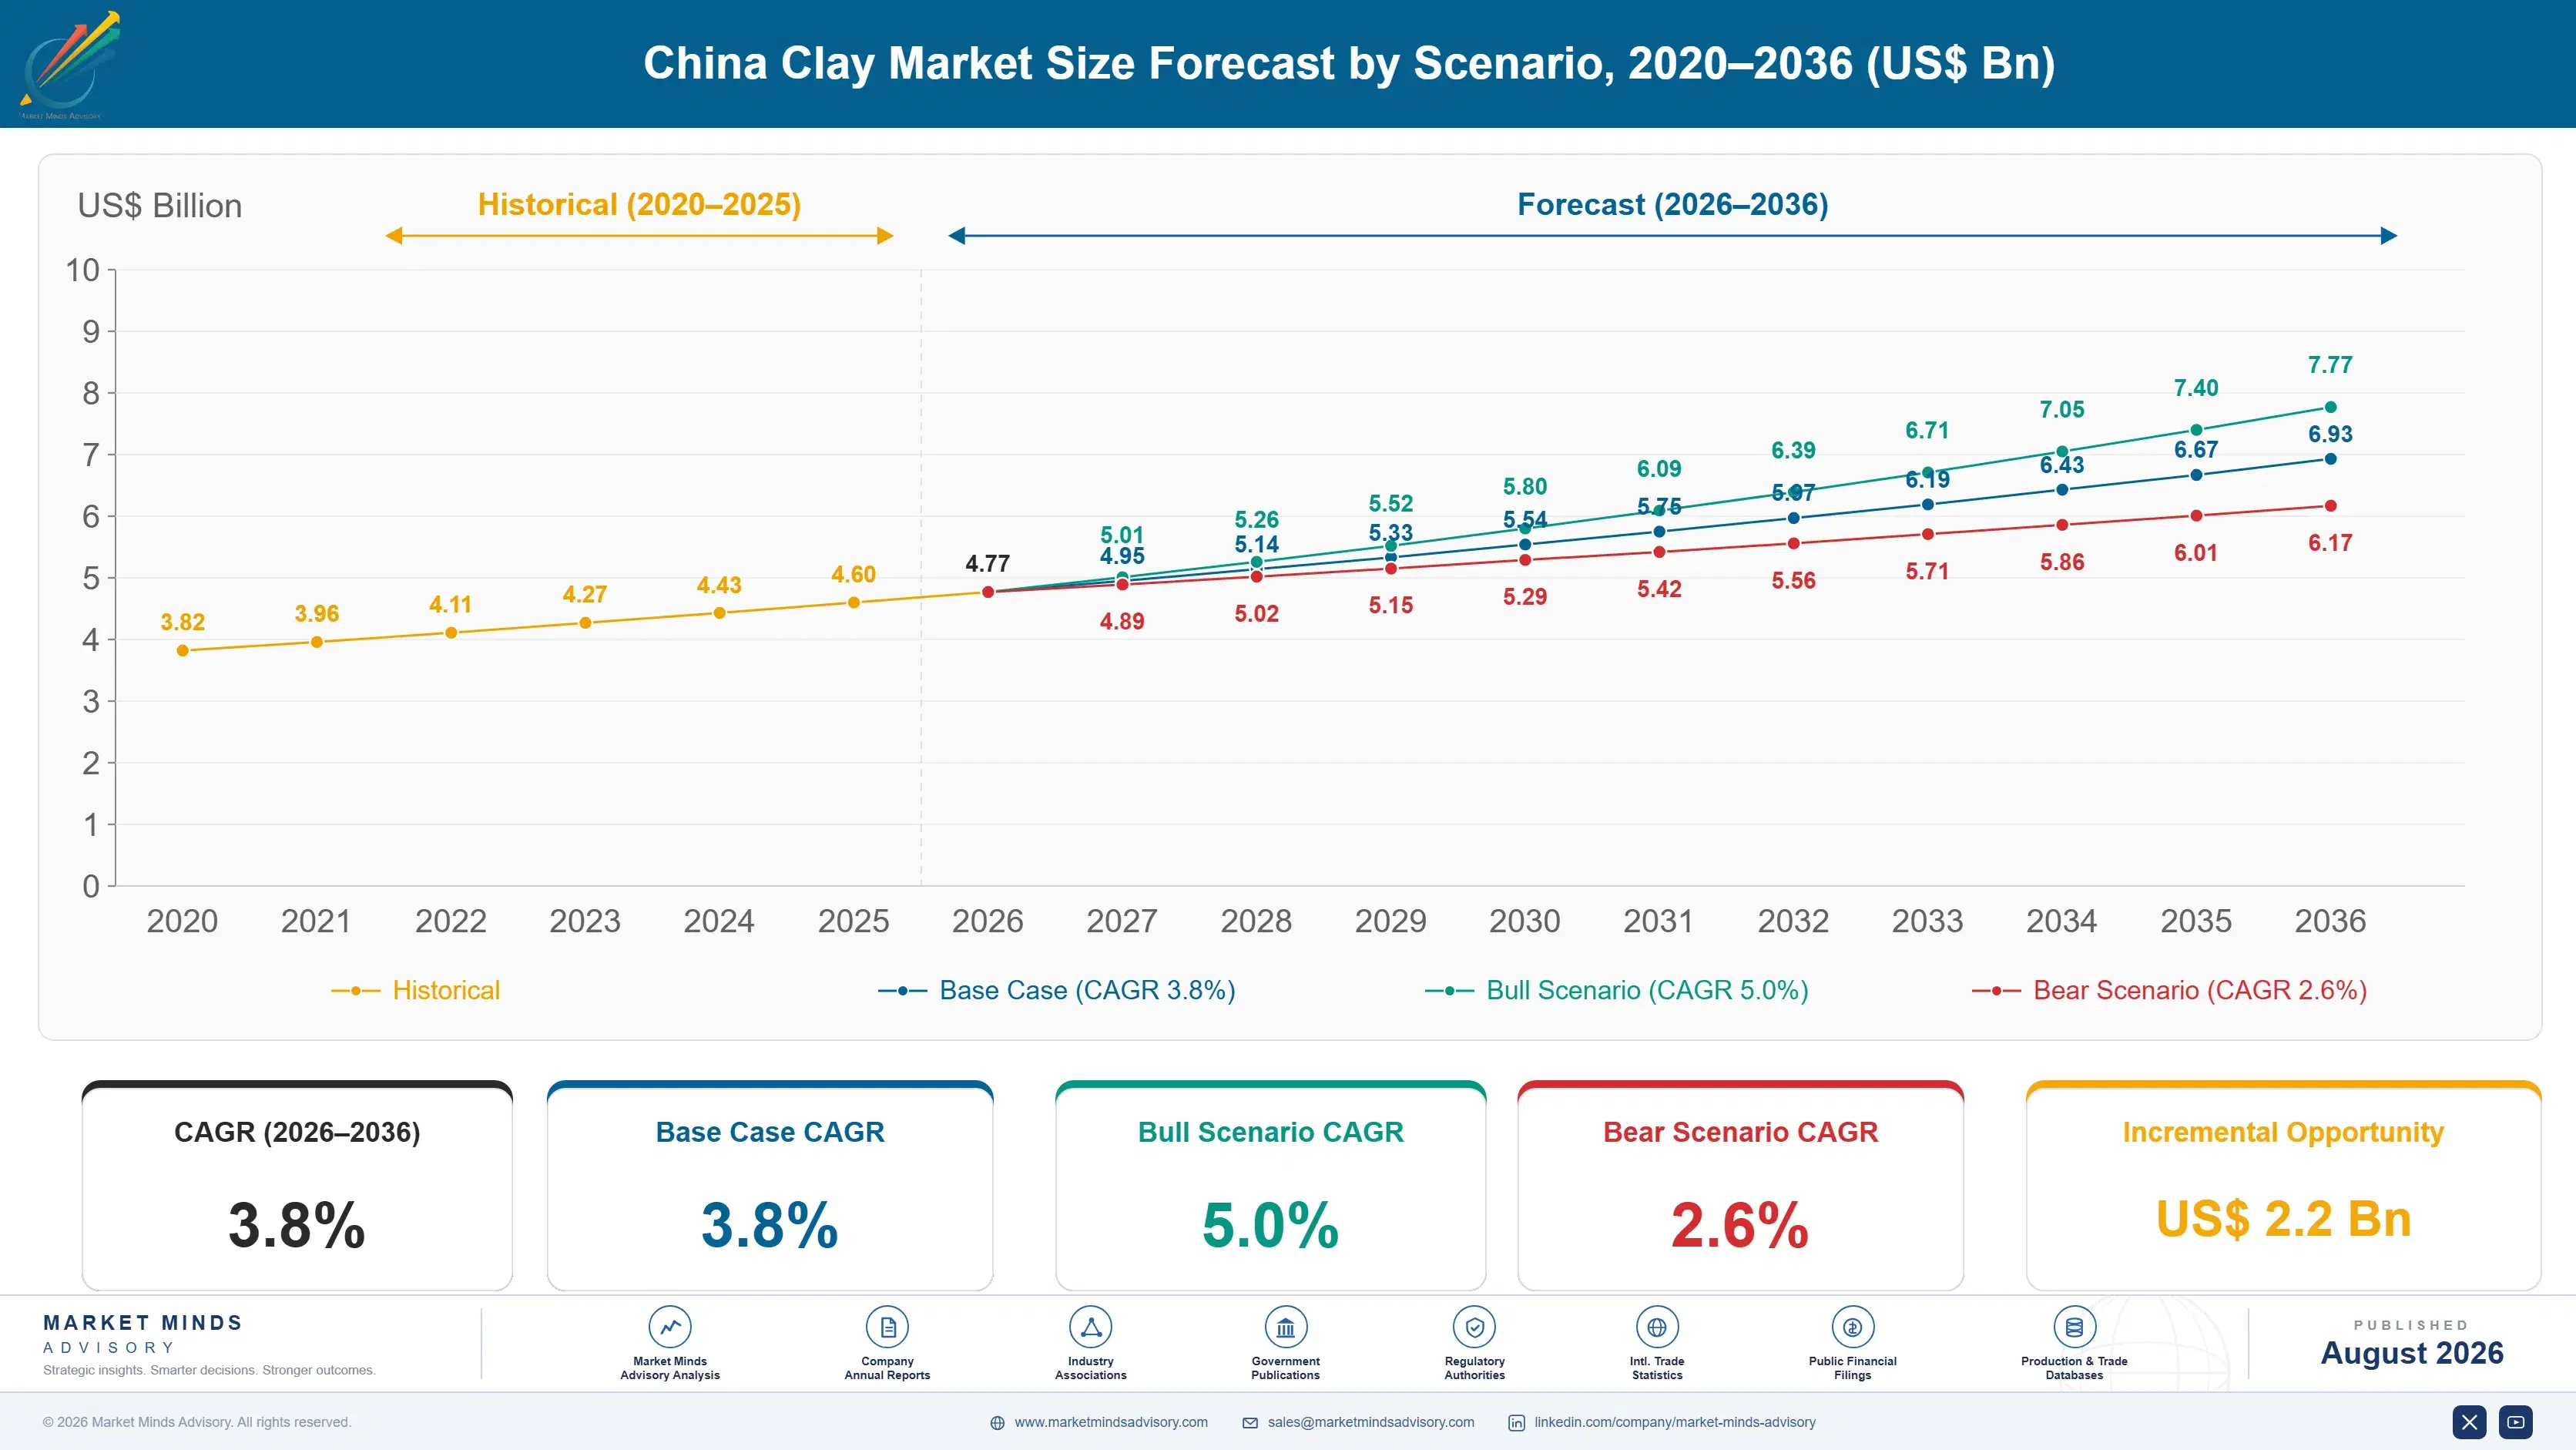
The 2020 to 2025 period ran at 3.0% and the composition kept shifting underneath a modest headline. Graphic paper demand continued its long decline while packaging grades grew, which moved kaolin volume between paper applications rather than out of them entirely. Ceramic demand recovered strongly from 2021 on construction activity, and calcined grades grew throughout on polymer and coatings substitution against costlier fillers.
Three mechanisms carry the 3.8% base case. Ceramic and sanitaryware production is the largest, since construction across Asia and the Middle East consumes whiteware at volumes graphic paper never replaces. Calcined and modified grades are the second, at 5.7%, displacing titanium dioxide and precipitated silica on cost. And fibreglass and refractory demand is the third, growing with construction and industrial capacity. Rubber and polymer filler demand sits beneath all three, growing slowly and steadily.
The 5.0% bull case rests on calcined kaolin taking substantially more titanium dioxide substitution in coatings, where the price differential is wide and formulators have been slow to reformulate. The 2.6% bear case is graphic paper decline accelerating alongside a construction downturn, since ceramics and paper together still carry the majority of tonnage and both would fall at once.

Geology Sets The Ceiling

This industry lost its principal customer slowly enough to adjust and not slowly enough to adjust well. Paper coating and filling took around three fifths of world kaolin two decades ago and now takes 31%, and the deposits developed to serve it were selected for brightness and fine particle size that ceramics, polymers, and coatings value far less. The best assets were optimised for the shrinking market.
TOP FIVE CONCENTRATION38%Fragmented, since deposit ownership rather than processing decides participation
PAPER SHARE OF DEMAND31%Down from around three fifths two decades ago entirely
FREIGHT SHARE OF COST27%Of delivered cost for a low value bulk mineral
DEPOSIT BRIGHTNESS CEILING92On the standard scale, set by geology not processing
BENEFICIATION YIELD42%Of crude ore emerging as saleable processed product afterwards
PROVEN RESERVE LIFE34 yearsAcross the highest quality deposits currently in commercial production
Geology rather than processing sets what any producer can sell. Brightness ceilings around 92 on the standard scale are a property of the deposit, and beneficiation removes iron, titanium, and coarse fractions without ever raising the ore above what it contains. Yields near 42% mean most of what is mined never reaches a customer, which makes reserve quality the single most valuable thing a producer owns.
Freight closes the picture. Kaolin is a low value bulk mineral where delivery accounts for roughly 27% of landed cost, so a producer competes inside a radius rather than across a market. Concentration at 38% follows from deposit geography and freight together, and no amount of consolidation changes where the clay physically is.
"Every kaolin producer we have ever advised believes its problem is processing. It is almost never processing. It is that the deposit will not go brighter and the customer that wanted bright clay stopped buying it."
Director, Industrial Minerals and Performance Fillers Practice · MMA Chemicals a

Market Trends

Calcined Grades Substitute For Costlier White Pigments

Calcining kaolin above 1,000 degrees changes its optical behaviour and particle morphology enough to replace part of the titanium dioxide in paints and part of the precipitated silica in polymers, and those grades grow at 5.7% against 3.8% for the market. The price differential against titanium dioxide is wide enough to fund reformulation work several times over. Formulators have nonetheless been slow, since reformulating a paint is not a purchasing decision. Producers who send application chemists into customer laboratories convert accounts that price lists never move. That work is expensive. It is also the only thing that works.
Market Impact: Beneficiation yields near 42%
Paper Decline Redistributes Volume Rather Than Removing It

Graphic paper demand keeps falling while packaging grades grow, so kaolin volume moves between paper applications rather than leaving the industry outright, and paper still takes 31% of demand. Packaging grades are coarser and less bright than coating grades, which suits some deposits and strands others. Producers whose reserves were selected for high brightness are supplying a market that no longer pays for it. Ground calcium carbonate has been taking filler share on delivered cost for two decades and has not finished. Nothing about kaolin's cost position reverses that. Packaging growth partly offsets it.
Market Impact: Brightness ceilings reach around 92

Market Opportunities and Growth Drivers

Ceramic Production Absorbs Volume Paper Released

Whiteware, sanitaryware, tableware, and tile production across Asia and the Middle East consume kaolin at volumes that construction activity rather than media consumption determines. Ceramic grades tolerate lower brightness and coarser particle size than paper coating ever did, which opens deposits that could never serve the paper market. That has redrawn which producers compete for what, and several regional deposits became commercially viable for the first time. Ceramic body formulations specify a named clay from a named deposit and rarely change afterwards. Substituting means reformulating and retesting a whole body. Those positions hold for years.
Market Impact: Brightness caps at around 92

Fibreglass And Refractory Demand Tracks Industrial Building

Kaolin supplies alumina and silica into fibreglass batch and refractory formulations, and that demand grows with construction insulation, wind blade production, and industrial furnace building simultaneously. Specification here is chemical rather than optical, which again favours deposits that paper never valued. Volumes are meaningful and pricing sits below coating grades, so the mix effect on revenue is weaker than the tonnage effect suggests. Wind blade production and building insulation both add fibreglass demand independent of any construction cycle. That partly diversifies an otherwise construction-linked base. Volumes remain modest against ceramics.
Market Impact: Freight carries 27% of landed cost

Market Restraints and Challenges

Deposit Quality Cannot Be Improved By Processing

Brightness ceilings around 92 and particle size distribution are properties of the ore body, and the root cause is that beneficiation removes contaminants and fractions without ever adding anything the deposit did not contain. Commercial impact is that a producer cannot reposition into a higher grade market by investing in its plant. Mitigation runs through acquiring better reserves, calcination and surface modification that add properties chemically, and blending across deposits where logistics permit. Producers marketing on aspiration rather than assay discover this expensively and repeatedly. The assay does not negotiate. Nor does the calciner change it.
Market Impact: Calcined grades grow at 5.7%

Freight Economics Confine Producers To A Radius

Delivery carries roughly 27% of landed cost and the root cause is simply that kaolin is a heavy, low value mineral where transport can exceed the value of the material moved. Commercial impact is that concentration sits at 38% and no consolidation changes where deposits physically are. Mitigation runs through slurry pipelines and rail loading where volumes justify them, regional processing near consuming industries, and prioritising higher value grades where freight is proportionally smaller. Shipping crude or semi-processed material for regional finishing reaches customers finished product economics exclude. Very few producers structure supply that way.
Market Impact: Paper now takes 31% of demand
4 additional market trends, 3 additional growth drivers, and 2 additional restraints and challenges are covered in the full report. Contact sales@marketmindsadvisory.com to access the complete intelligence.

Segment CAGR and Growth Architecture

Segmentation follows the processed grade and the property it is sold on, because brightness, particle size, and surface chemistry determine which application a deposit can serve and what the material earns. Deposit region and mining method both cut across every grade rather than separating them cleanly, which makes either weaker as a primary dimension.
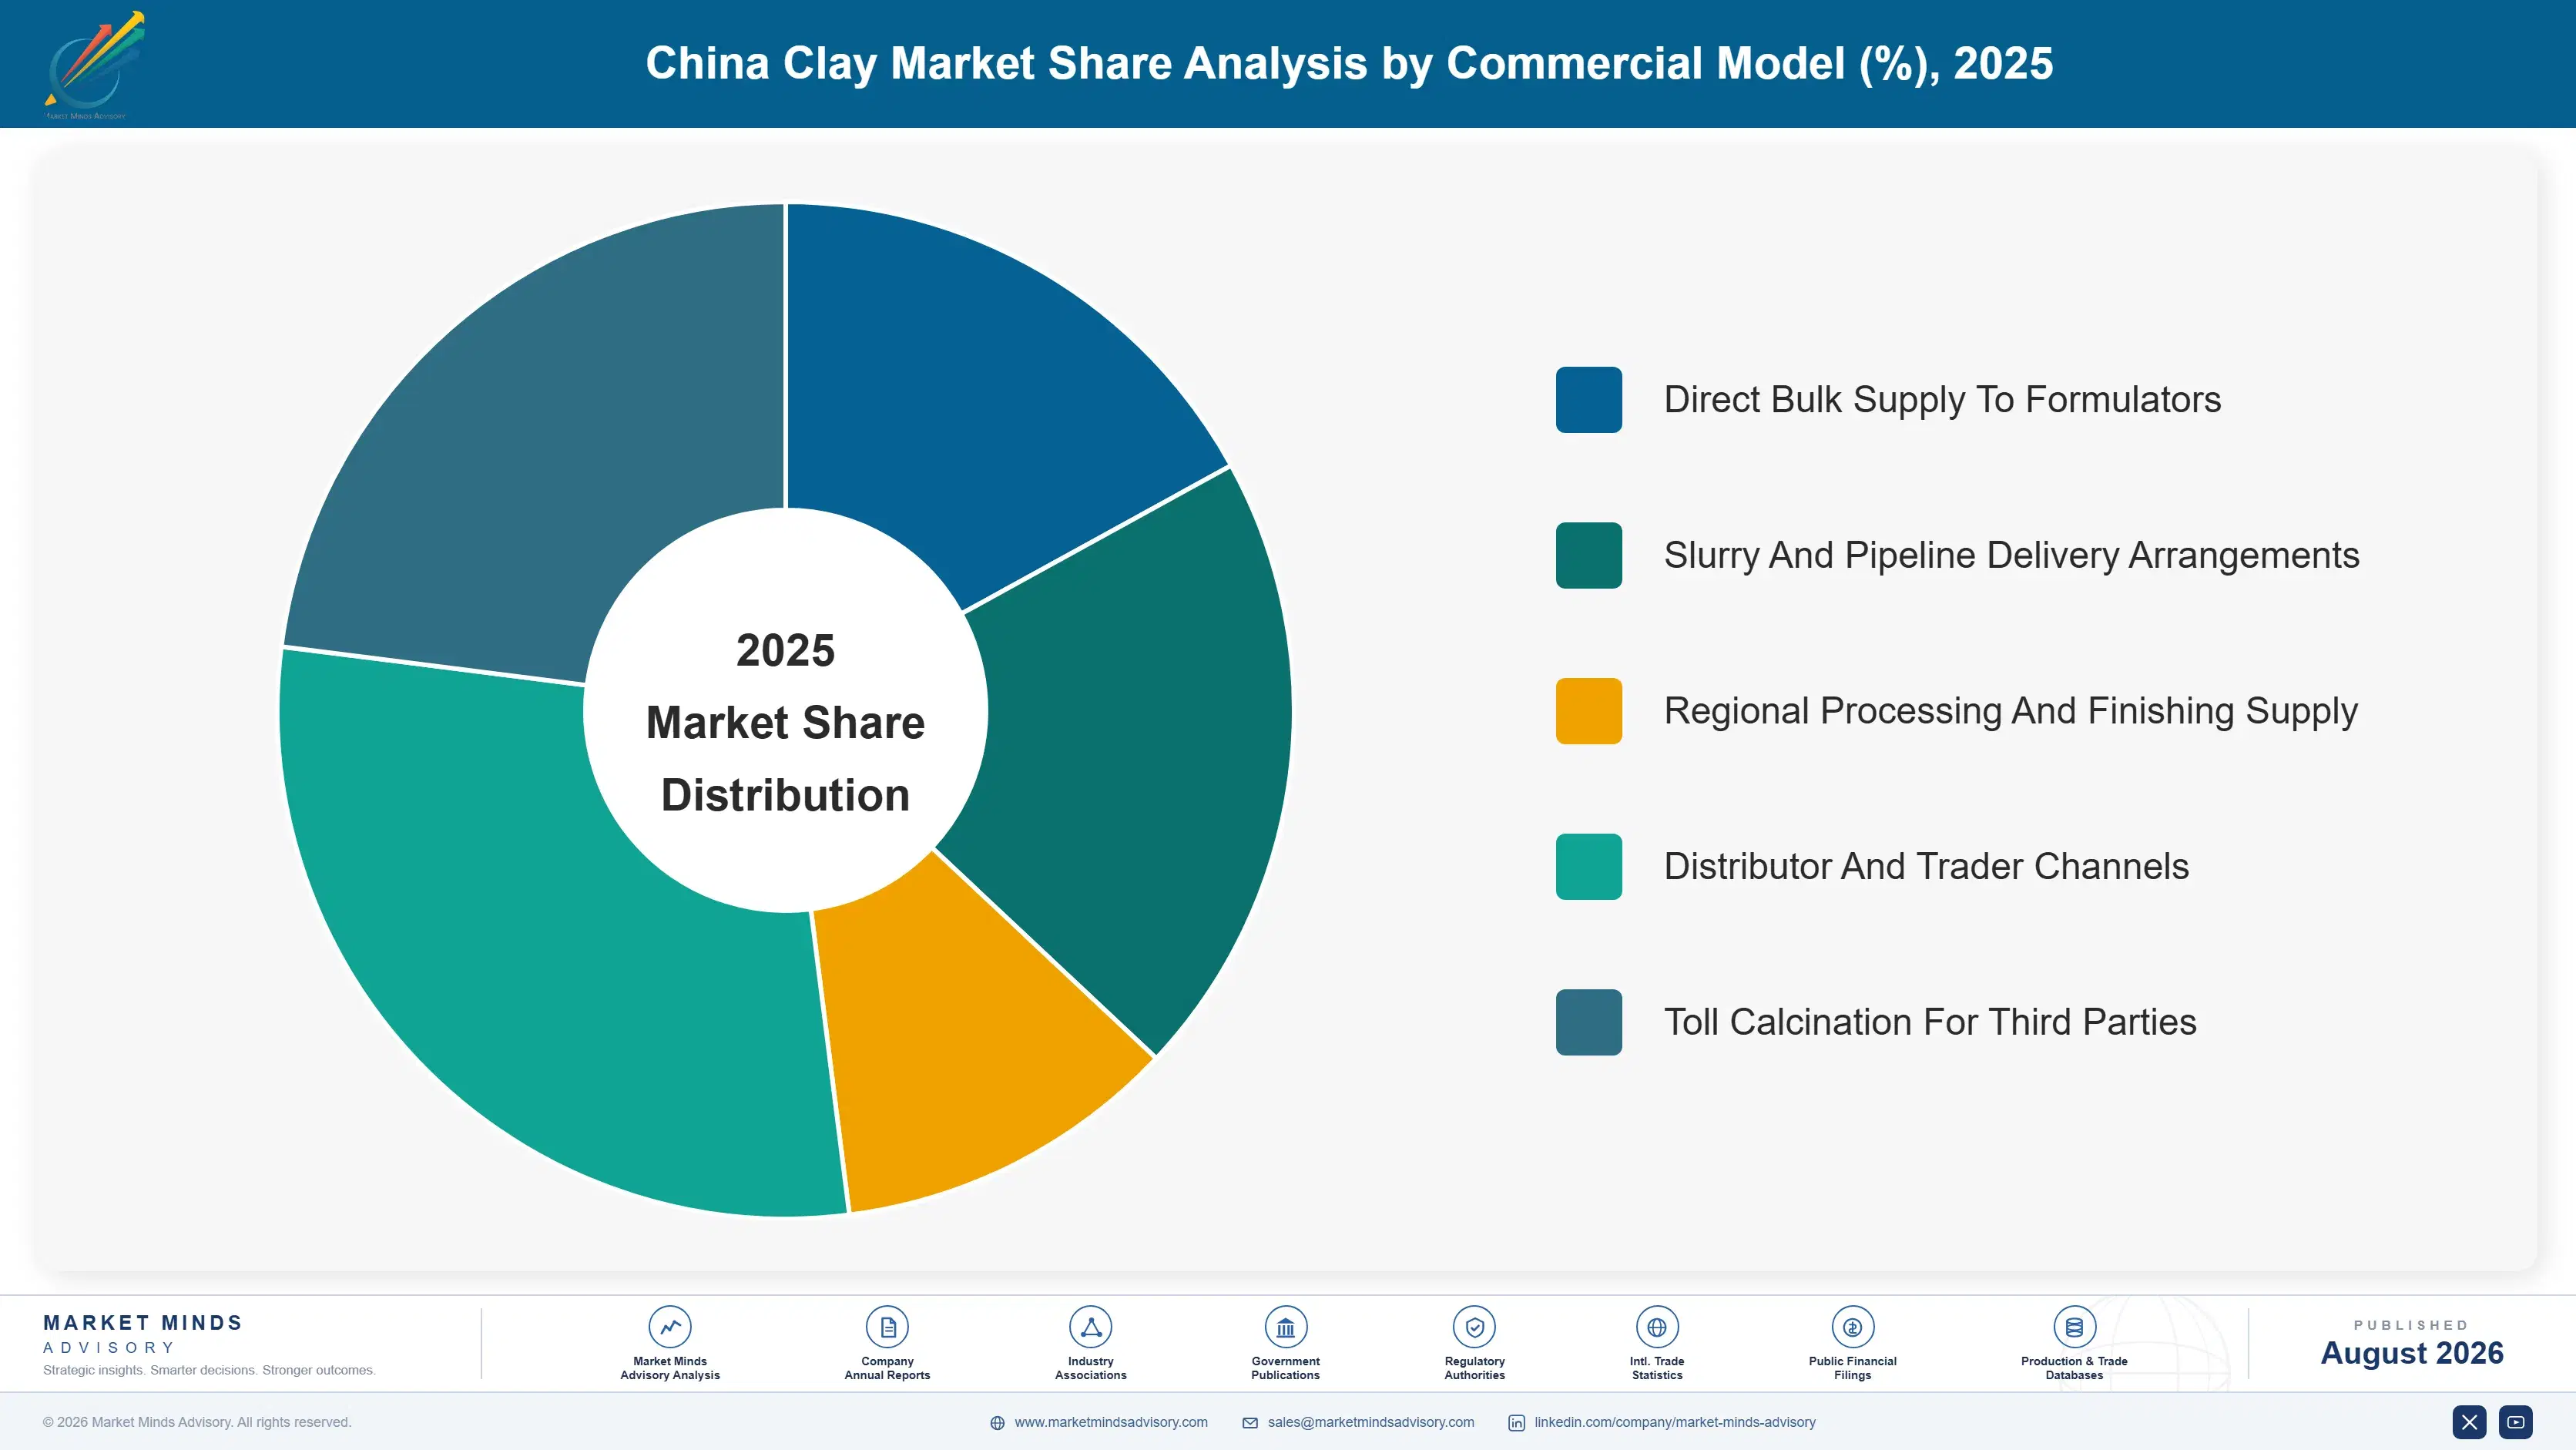
china-clay-market-market-share-analysis-1787302689847

Calcined And Surface-Modified Grades

The fastest grade at 5.7%, exactly 1.50 times the market rate, produced by heating kaolin above 1,000 degrees or treating it with silanes and other surface chemistry to add opacity, hardness, or polymer compatibility. This is the only route by which a producer improves what its deposit offers rather than accepting it, which makes it the most strategically important part of the business regardless of current tonnage. Titanium dioxide and precipitated silica substitution drives most of the demand, and the price differential funds reformulation work comfortably. Formulators have nonetheless been slow to reformulate, since changing a paint is a technical project rather than a purchase. Application chemists move that faster than pricing does.
CAGR 5.7%

Ceramic And Refractory Grades

Second fastest at 4.6%, supplying whiteware, sanitaryware, tableware, tile bodies, and refractory formulations where plasticity, fired colour, and chemical composition matter more than optical brightness. Specification tolerances are wider than paper coating ever permitted, which has made deposits commercially viable that could never have served the paper market at any price. Construction activity rather than media consumption drives the volume, and Asian and Middle Eastern building cycles now determine far more of this industry's fortunes than publishing does. Ceramic body formulations specify a named clay from a named deposit, and substitution means reformulating the whole body. Those positions hold for years once established. Very few are contested on price alone.
CAGR 4.6%
Full segment breakdown across 5 segments available in the complete report.

Regional Architecture and Country Demand Map

East Asia leads at 35%, far outside band, because Chinese ceramic production and kaolin reserves both concentrate there. North America and Western Europe hold historic paper-grade deposits. India grows fastest. Five regional shares sit outside their framework bands. Deposit geology and ceramic production explain them.

East Asia

Thirty-five percent, far outside the framework band, and justified because Chinese ceramic tile, sanitaryware, and tableware production exceeds the rest of the world combined while substantial kaolin reserves sit inside the same country. Deposit quality varies widely and much of it suits ceramics rather than paper coating, which matches regional demand almost perfectly. Freight economics keep supply and consumption inside the region. Growth at 4.6% runs above the market rate on construction and calcined grade demand together. Ceramic body formulations here specify domestic clays almost exclusively, which makes imported material a marginal supplement rather than a competitor. Freight settles that question completely. Imported material supplements rather than competes with domestic supply anywhere.
Share: 35% | CAGR: 4.6% (2026 to 2036)

North America

Eighteen percent, far below the framework band, and the Georgia deposits that defined the world paper coating market for decades are the clearest illustration of this industry's problem. Those reserves were developed for brightness and fine particle size that graphic paper valued and ceramics do not, and demand for exactly that specification has fallen furthest. Producers there have moved toward calcined and specialty grades. Growth at 2.8% sits below the market rate, reflecting that transition rather than reserve exhaustion. Calcination capacity built on those Georgia reserves now reaches paint and polymer applications that the original paper business never touched. That transition is the region's main story. Nothing else has replaced the lost volume.
Share: 18% | CAGR: 2.8% (2026 to 2036)
Regional intelligence for 5 additional markets available in the complete report: Western Europe, South Asia and Pacific, Latin America, Eastern Europe, Middle East and Africa. Contact sales@marketmindsadvisory.com.
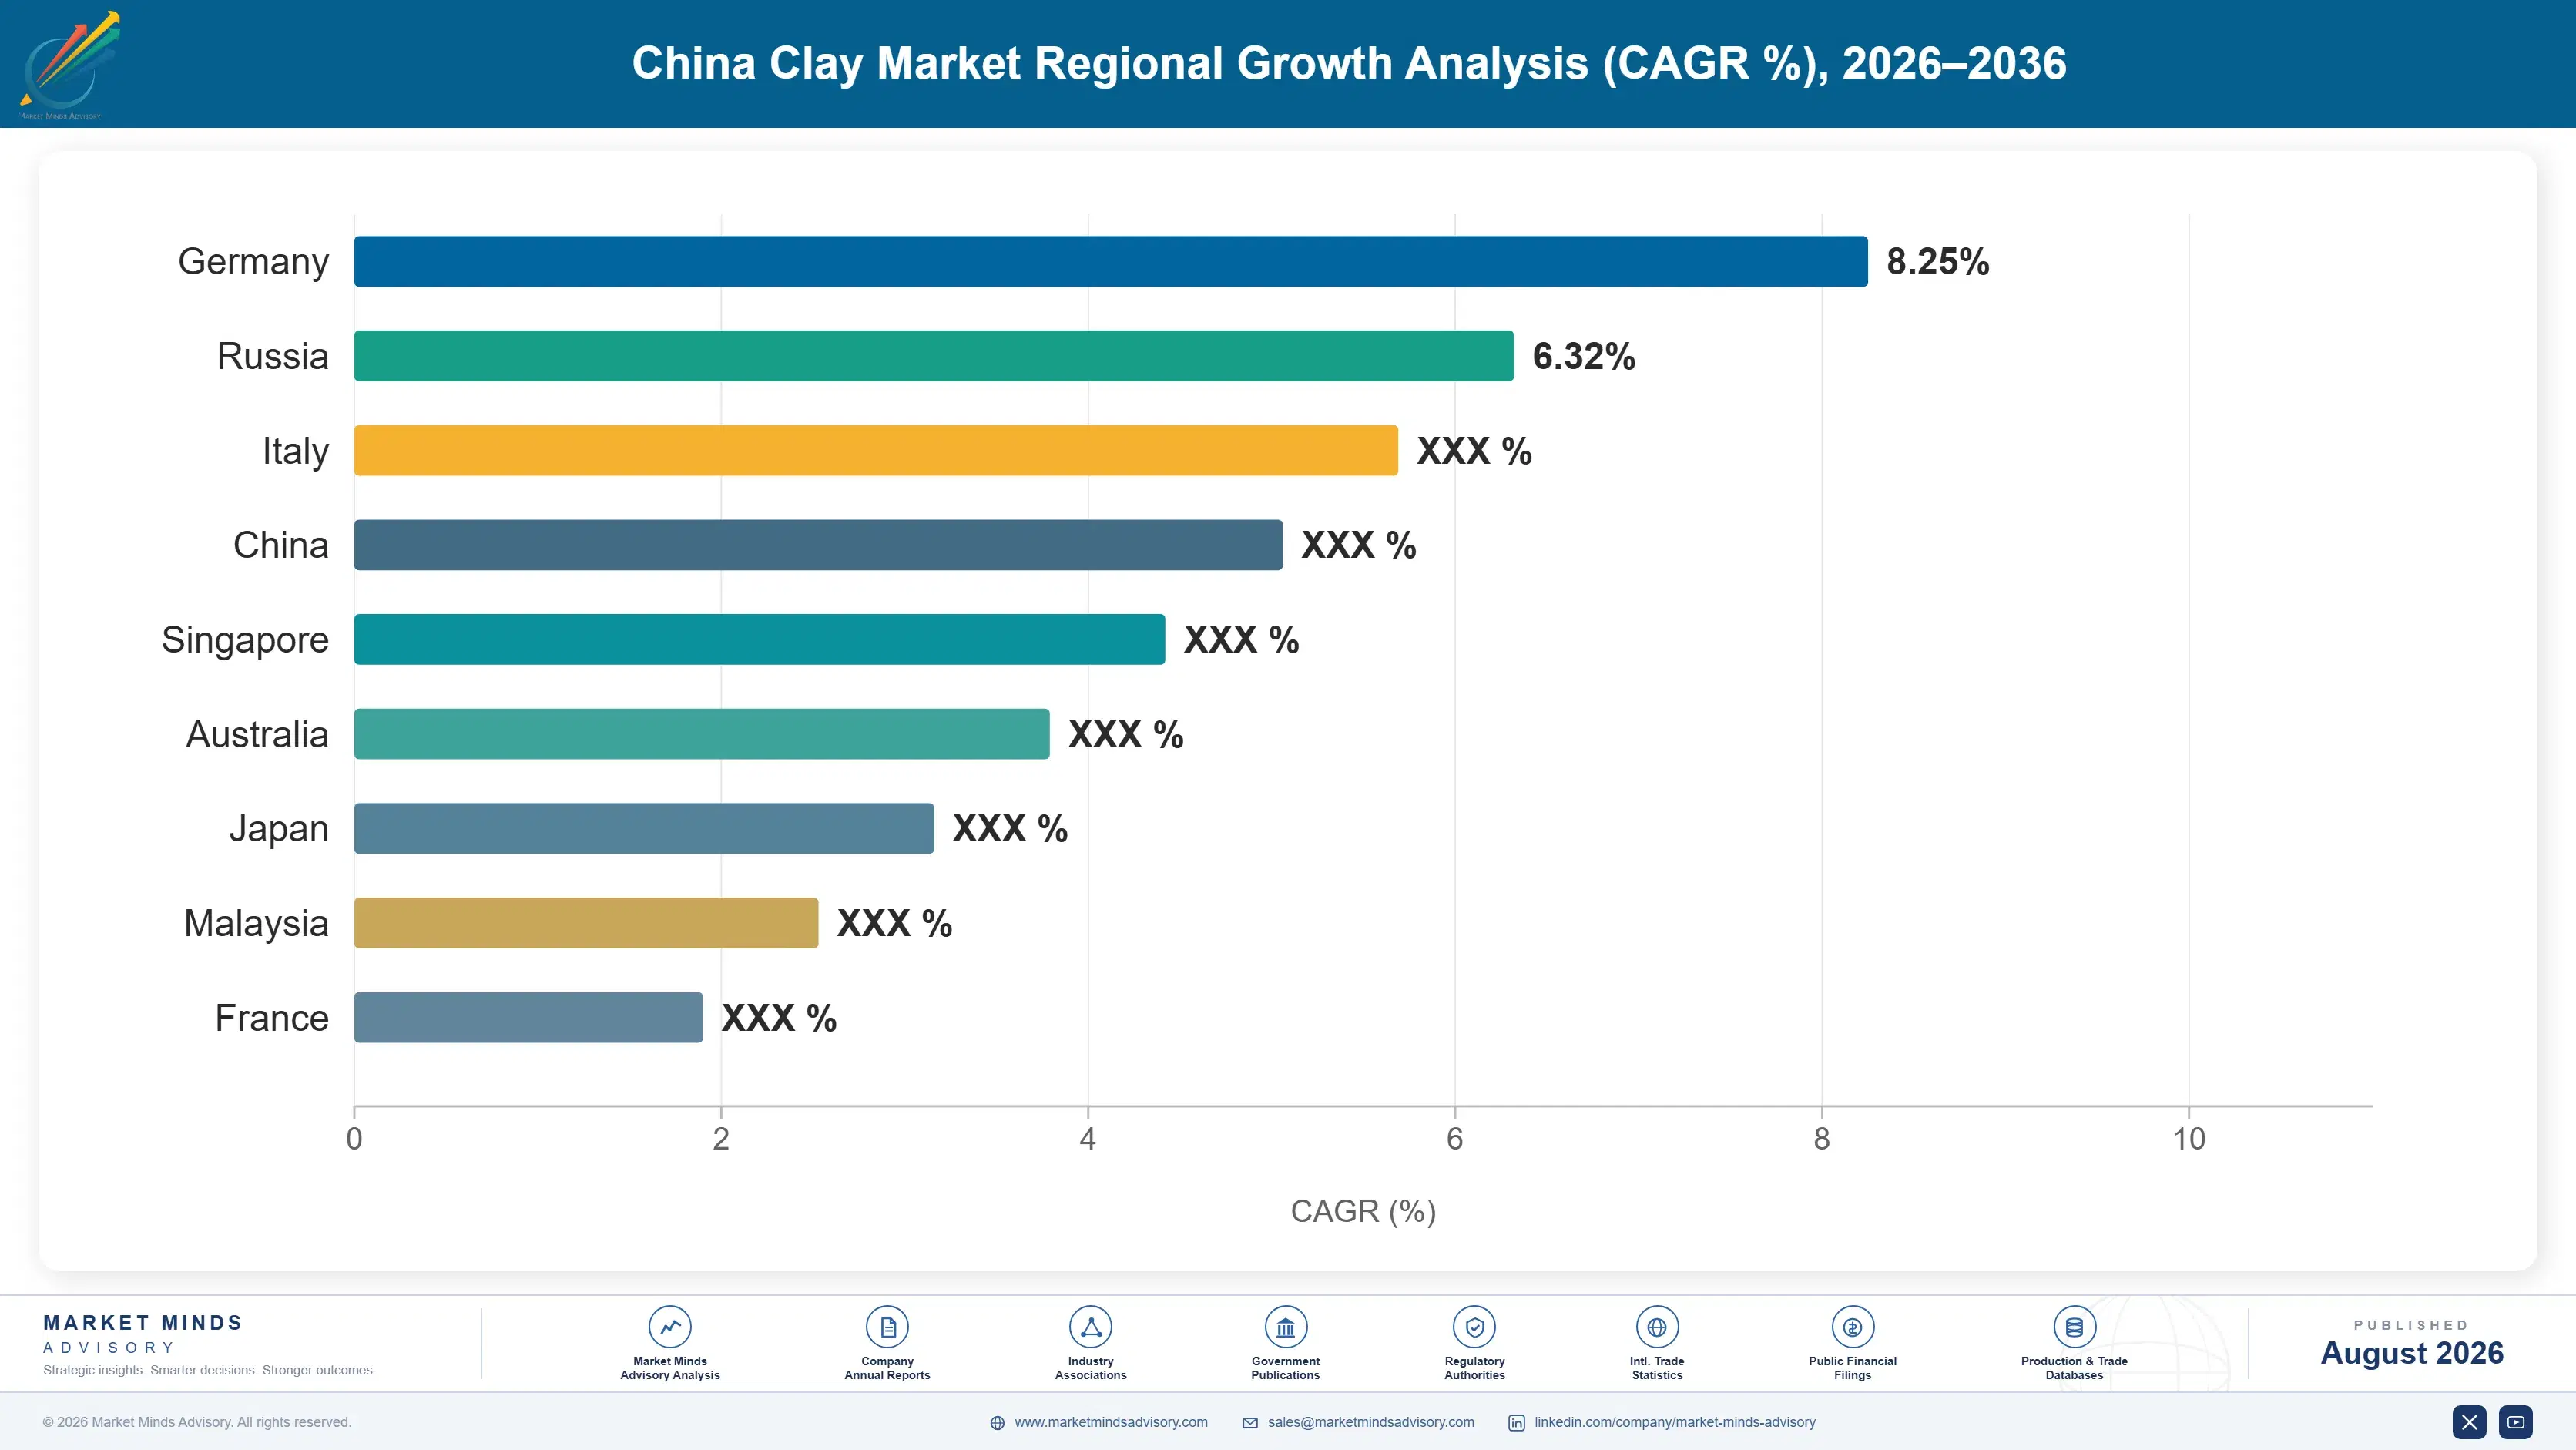
china-clay-market-country-cagr-analysis-1787302690360

Reserves, Calcination And Freight Radius

Paper has fallen to 31% of demand, brightness caps near 92 by geology, freight carries 27% of landed cost, and calcined grades grow at 5.7%. Value comes from reserve quality, from processing that adds properties chemically, and from siting inside consuming regions. Beneficiation investment answers none of it. Geology sets the starting point. Nothing changes it.

Invest In Calcination Rather Than Beneficiation Capacity

Beneficiation removes contaminants and never raises a deposit above what the ore contains, so a producer whose brightness caps near 92 cannot buy its way into a higher grade market through plant investment. Calcination and surface modification add properties chemically and grow at 5.7% against 3.8% for the market. That is the only route by which a producer improves what its geology gave it, and most capital still goes elsewhere. Beneficiation yields near 42% and raising that modestly does nothing for brightness at all. Producers keep confusing the two investments.
Market Impact: Calcined grades grow at 5.7% every

Reposition Reserves Toward Ceramic And Chemical Specification

Paper coating has fallen from around three fifths of demand to 31%, and deposits selected for brightness and fine particle size are serving a market that no longer pays for either property. Ceramic, refractory, and fibreglass grades tolerate far wider specification and grow with construction rather than with publishing. Producers still marketing on brightness are describing a property their largest remaining customers do not price. Ceramic specification tolerance is wide enough to open deposits paper coating could never have used. That has redrawn who competes for what. Several regional deposits became viable.
Market Impact: Paper has now fallen to 31% of dema

Site Processing Inside The Consuming Region

Freight carries roughly 27% of landed cost for a low value bulk mineral, which means a producer competes inside a radius rather than across any market and concentration sits at just 38% as a result. Shipping crude or semi-processed material for regional finishing reaches customers that finished product economics exclude entirely. Very few producers structure supply that way, and those that do reach demand nobody else can serve. Concentration at 38% follows from deposit geography and freight together rather than from any capital shortage. Nothing about consolidation changes it. The clay stays where it is.
Market Impact: Freight carries 27% of the total la

Fund Formulator Reformulation Work Directly Yourself

The price differential between calcined kaolin and titanium dioxide is wide enough to fund reformulation several times over, and formulators have still been slow because reformulating a paint is a technical project rather than a purchasing decision. Producers who send application chemists into customer laboratories convert accounts that price lists never move. That work is expensive and it is the only mechanism that has reliably taken share from titanium dioxide. Calcined kaolin sells at a fraction of titanium dioxide pricing and the gap has Calcined kaolin sells at roughly 20% of titanium dioxide pricing per tonne.
Market Impact: Beneficiation yields run near 42% o

Who Controls the Margin Pool

Concentration is very low at 38% across the top five measured on processed tonnage supplied, and deposit geography combined with freight economics explains almost all of it. A producer competes inside a radius set by a low value bulk mineral's transport cost, and no consolidation moves clay closer to a customer. The leader to challenger gap is widest in calcined and surface-modified grades and narrowest in ceramic body clays where specification tolerance
Competitive activity runs on three fronts. Reserve quality is the first and the least changeable, since brightness and particle size are geological properties that no plant investment alters. Calcination and surface modification capability is the second, where growth and the only real escape from deposit limitations both sit. And regional processing presence is the third, because freight decides reachable demand.

Pressure arrives from two directions. Ground calcium carbonate has taken paper filler share on delivered cost for two decades and continues to. And Chinese and Indian producers serve regional ceramic demand at costs Western producers cannot approach. Rankings shift on reserve acquisition rather than on any commercial activity. Neither pressure reaches calcined and surface-modified grades, where the property sold comes from processing rather than from any deposit.
china-clay-market-company-positioning-matrix-1787302690880

Competitive Moat and Risk Dimensions

IMERYS

Moat: Reserve breadth across deposit regions

Kaolin reserves across several deposit regions with different quality characteristics let a producer serve paper, ceramic, and specialty applications from geology suited to each rather than forcing one deposit toward markets it fits badly. Freight economics make that geographic spread a commercial asset rather than merely operational scale. Calcination capability across those sites compounds it further.
IMERYS

Risk: Paper grade reserve value declining

Reserves developed for paper coating brightness are optimised for an application that has fallen from around three fifths of demand to 31% and continues declining. That quality commands no premium in ceramics or refractories. Repositioning those assets requires calcination investment or acceptance of considerably lower realised pricing per tonne.
SIBELCO

Moat: Ceramic proximity and specification depth

Deposits and processing sited close to European and Asian ceramic industries convert freight economics into a defended position that distant producers cannot contest on cost. Long specification relationships with tile, sanitaryware, and porcelain producers make the material part of a body formulation rather than an interchangeable input. Both advantages hold regardless of what happens in paper.
SIBELCO

Risk: Ceramic demand follows construction cycles

Ceramic and sanitaryware production tracks construction activity, which moves in cycles considerably sharper than the industrial demand that other kaolin grades serve. A ceramic-weighted position carries that volatility without the paper base that once smoothed it. Calcined and specialty grades would diversify it and require investment away from the core position.

Players Tracked

Prominent Players

Imerys
Sibelco
KaMin
Thiele Kaolin
BASF

Other Key Players

Quarzwerke
LB Minerals
Ashapura Group
English Indian Clays
20 Microns
Kaolin AD
Active Minerals International
Burgess Pigment
Wilkinson Kaolin Associates
Sedlecky Kaolin
Minerals Technologies
Lasselsberger
Vale
Maoming Kaolin
Longyan Kaolin

Recent Developments

FEBRUARY 2025

Producer converts paper grade capacity to calcined production

A kaolin producer converted processing capacity previously dedicated to paper coating grades into calcination for paint and polymer applications, redirecting output from a declining application toward one growing faster than the market. The conversion was internal capital reallocation rather than any acquisition or plant closure.
Signal: Calcination is the only route by which a p
MAY 2025

Coatings formulator qualifies calcined kaolin against titanium dioxide

An architectural coatings manufacturer completed reformulation work replacing a portion of its titanium dioxide with calcined kaolin, following application laboratory support funded by the mineral producer rather than by itself. The qualification was a technical development outcome rather than any commercial or supply arrangement change.
Signal: Reformulation work rather than any publish
SEPTEMBER 2025

Producer acquires regional deposit near ceramic cluster

An industrial minerals group acquired a kaolin deposit adjacent to a growing Asian ceramic manufacturing cluster, buying freight position rather than reserve quality since the ore suits ceramic bodies rather than any brighter application. The transaction was an acquisition rather than a joint venture or supply arrangement.
Signal: Reserve acquisition now buys a freight pos

Mining, Drying and Freight

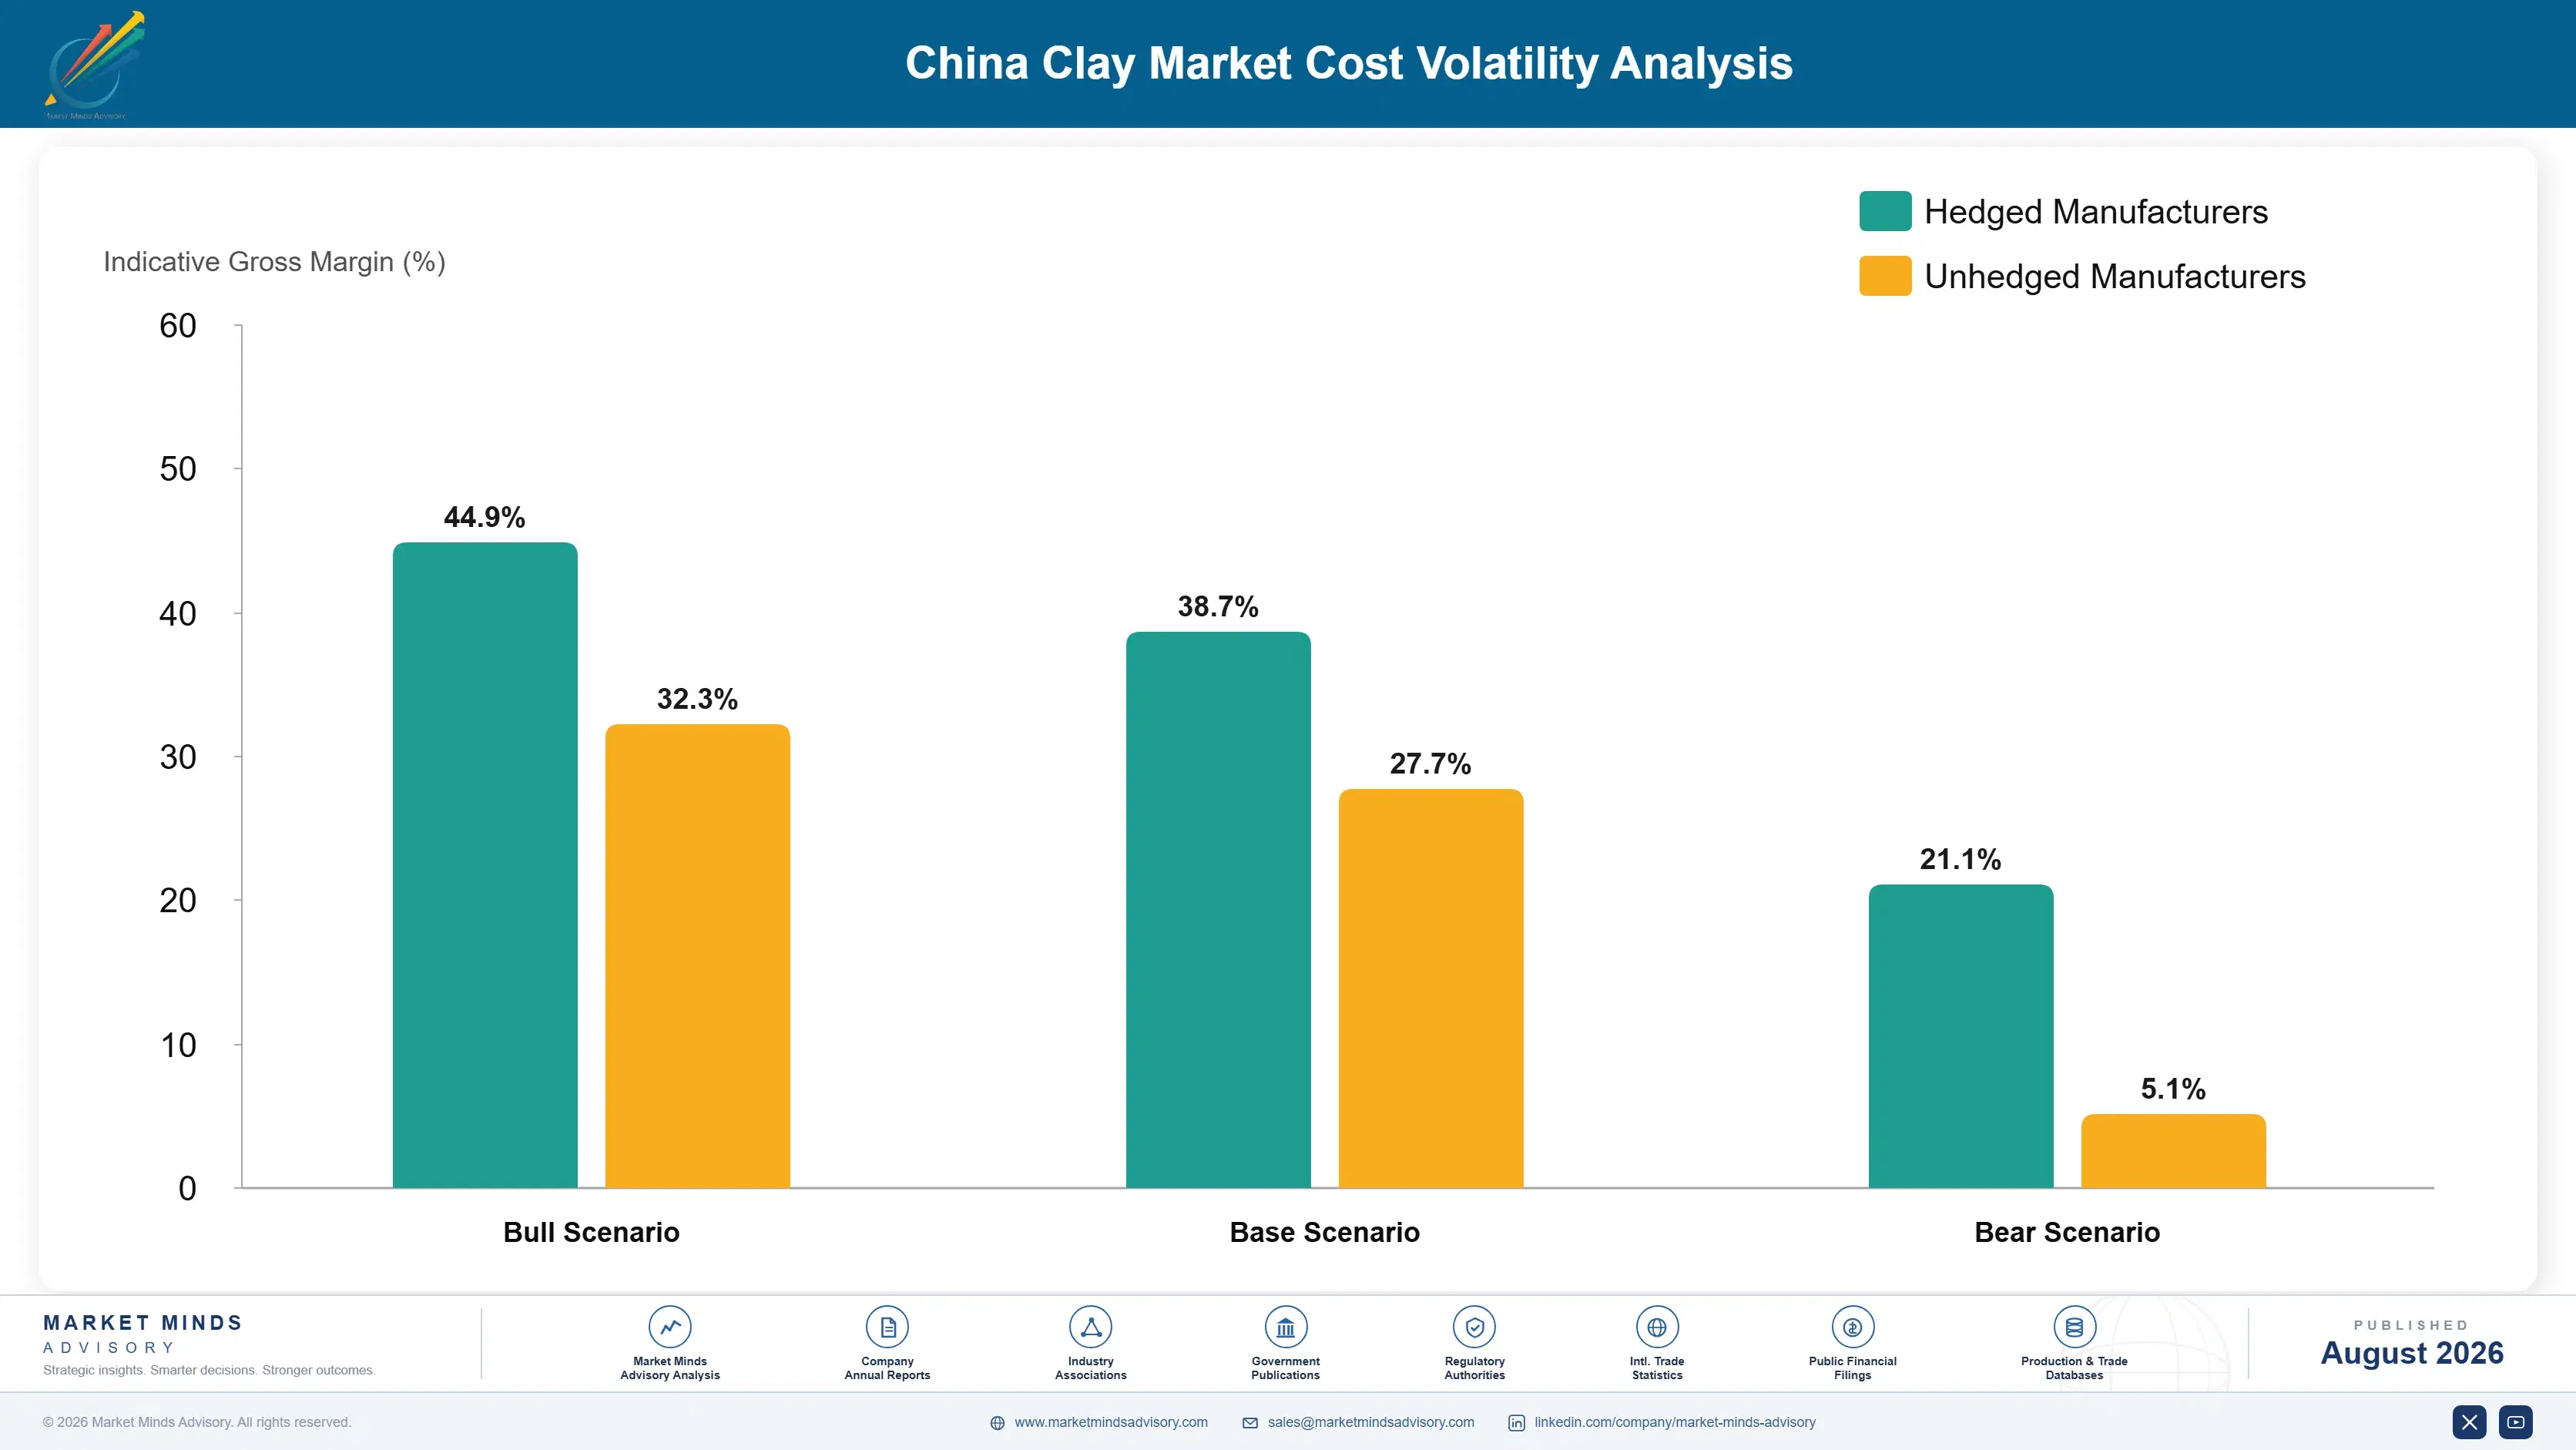
Delivered cost divides between mining, hauling, and beneficiation at roughly 31%, thermal drying and calcination energy near 22%, outbound freight around 27%, reclamation, permitting, and site overhead about 12%, and packaging, quality control, and general overhead the balance. Freight and thermal energy together exceed half the delivered cost, which is unusual even among bulk industrial minerals and explains most competitive behaviour here.
Industrial gas and electricity prices rose sharply through 2022 across Europe and parts of Asia, and several industrial minerals producers disclosed energy cost pressure and capacity curtailment in filings covering that year, with IEA data tracking the underlying movement. Freight rates moved separately and violently across the same period. Neither could be recovered quickly, since kaolin pricing is set against ground calcium carbonate and other substitutes rather than against cost.

The competitive disadvantage mechanism runs through drying energy rather than through mining cost. Ore extraction costs broadly similar amounts for comparable deposits, while removing water from a mineral slurry is energy intensive and industrial energy prices differ by a factor of two or more between regions. Producers in high energy cost locations carry a disadvantage on every tonne, and freight economics prevent them relocating the work anywhere cheaper.
china-clay-market-cost-volatility-analysis-1787302691074

Recover thermal energy across drying and calcination stages

Thermal drying and calcination carry roughly 22% of delivered cost, and calciner exhaust runs at temperatures genuinely useful for the drying stages ahead of it. Producers venting that heat are purchasing energy they have already generated once. The engineering is straightforward and the payback depends almost entirely on regional energy pricing, which is exactly where the disadvantage sits.

Ship at higher solids or by slurry pipeline where volumes justify

Outbound freight carries around 27% of delivered cost and every percentage point of water shipped is paid for at full freight rates. Higher solids slurry, filter cake, and dedicated pipelines each reduce that, and pipelines are viable only at volumes very few producers reach. Route density and rail loading achieve part of the same effect at considerably lower capital cost.

Match grade routing to the deposit rather than to demand

Beneficiation yields near 42%, and forcing an ore toward a specification it fits badly wastes recoverable product while producing material that will not command its target price anyway. Routing each deposit toward the grades its geology actually supports raises effective yield and realised value together. Producers marketing on aspiration rather than assay consistently discover this the expensive way.

Portfolio Architecture for Margin Defence

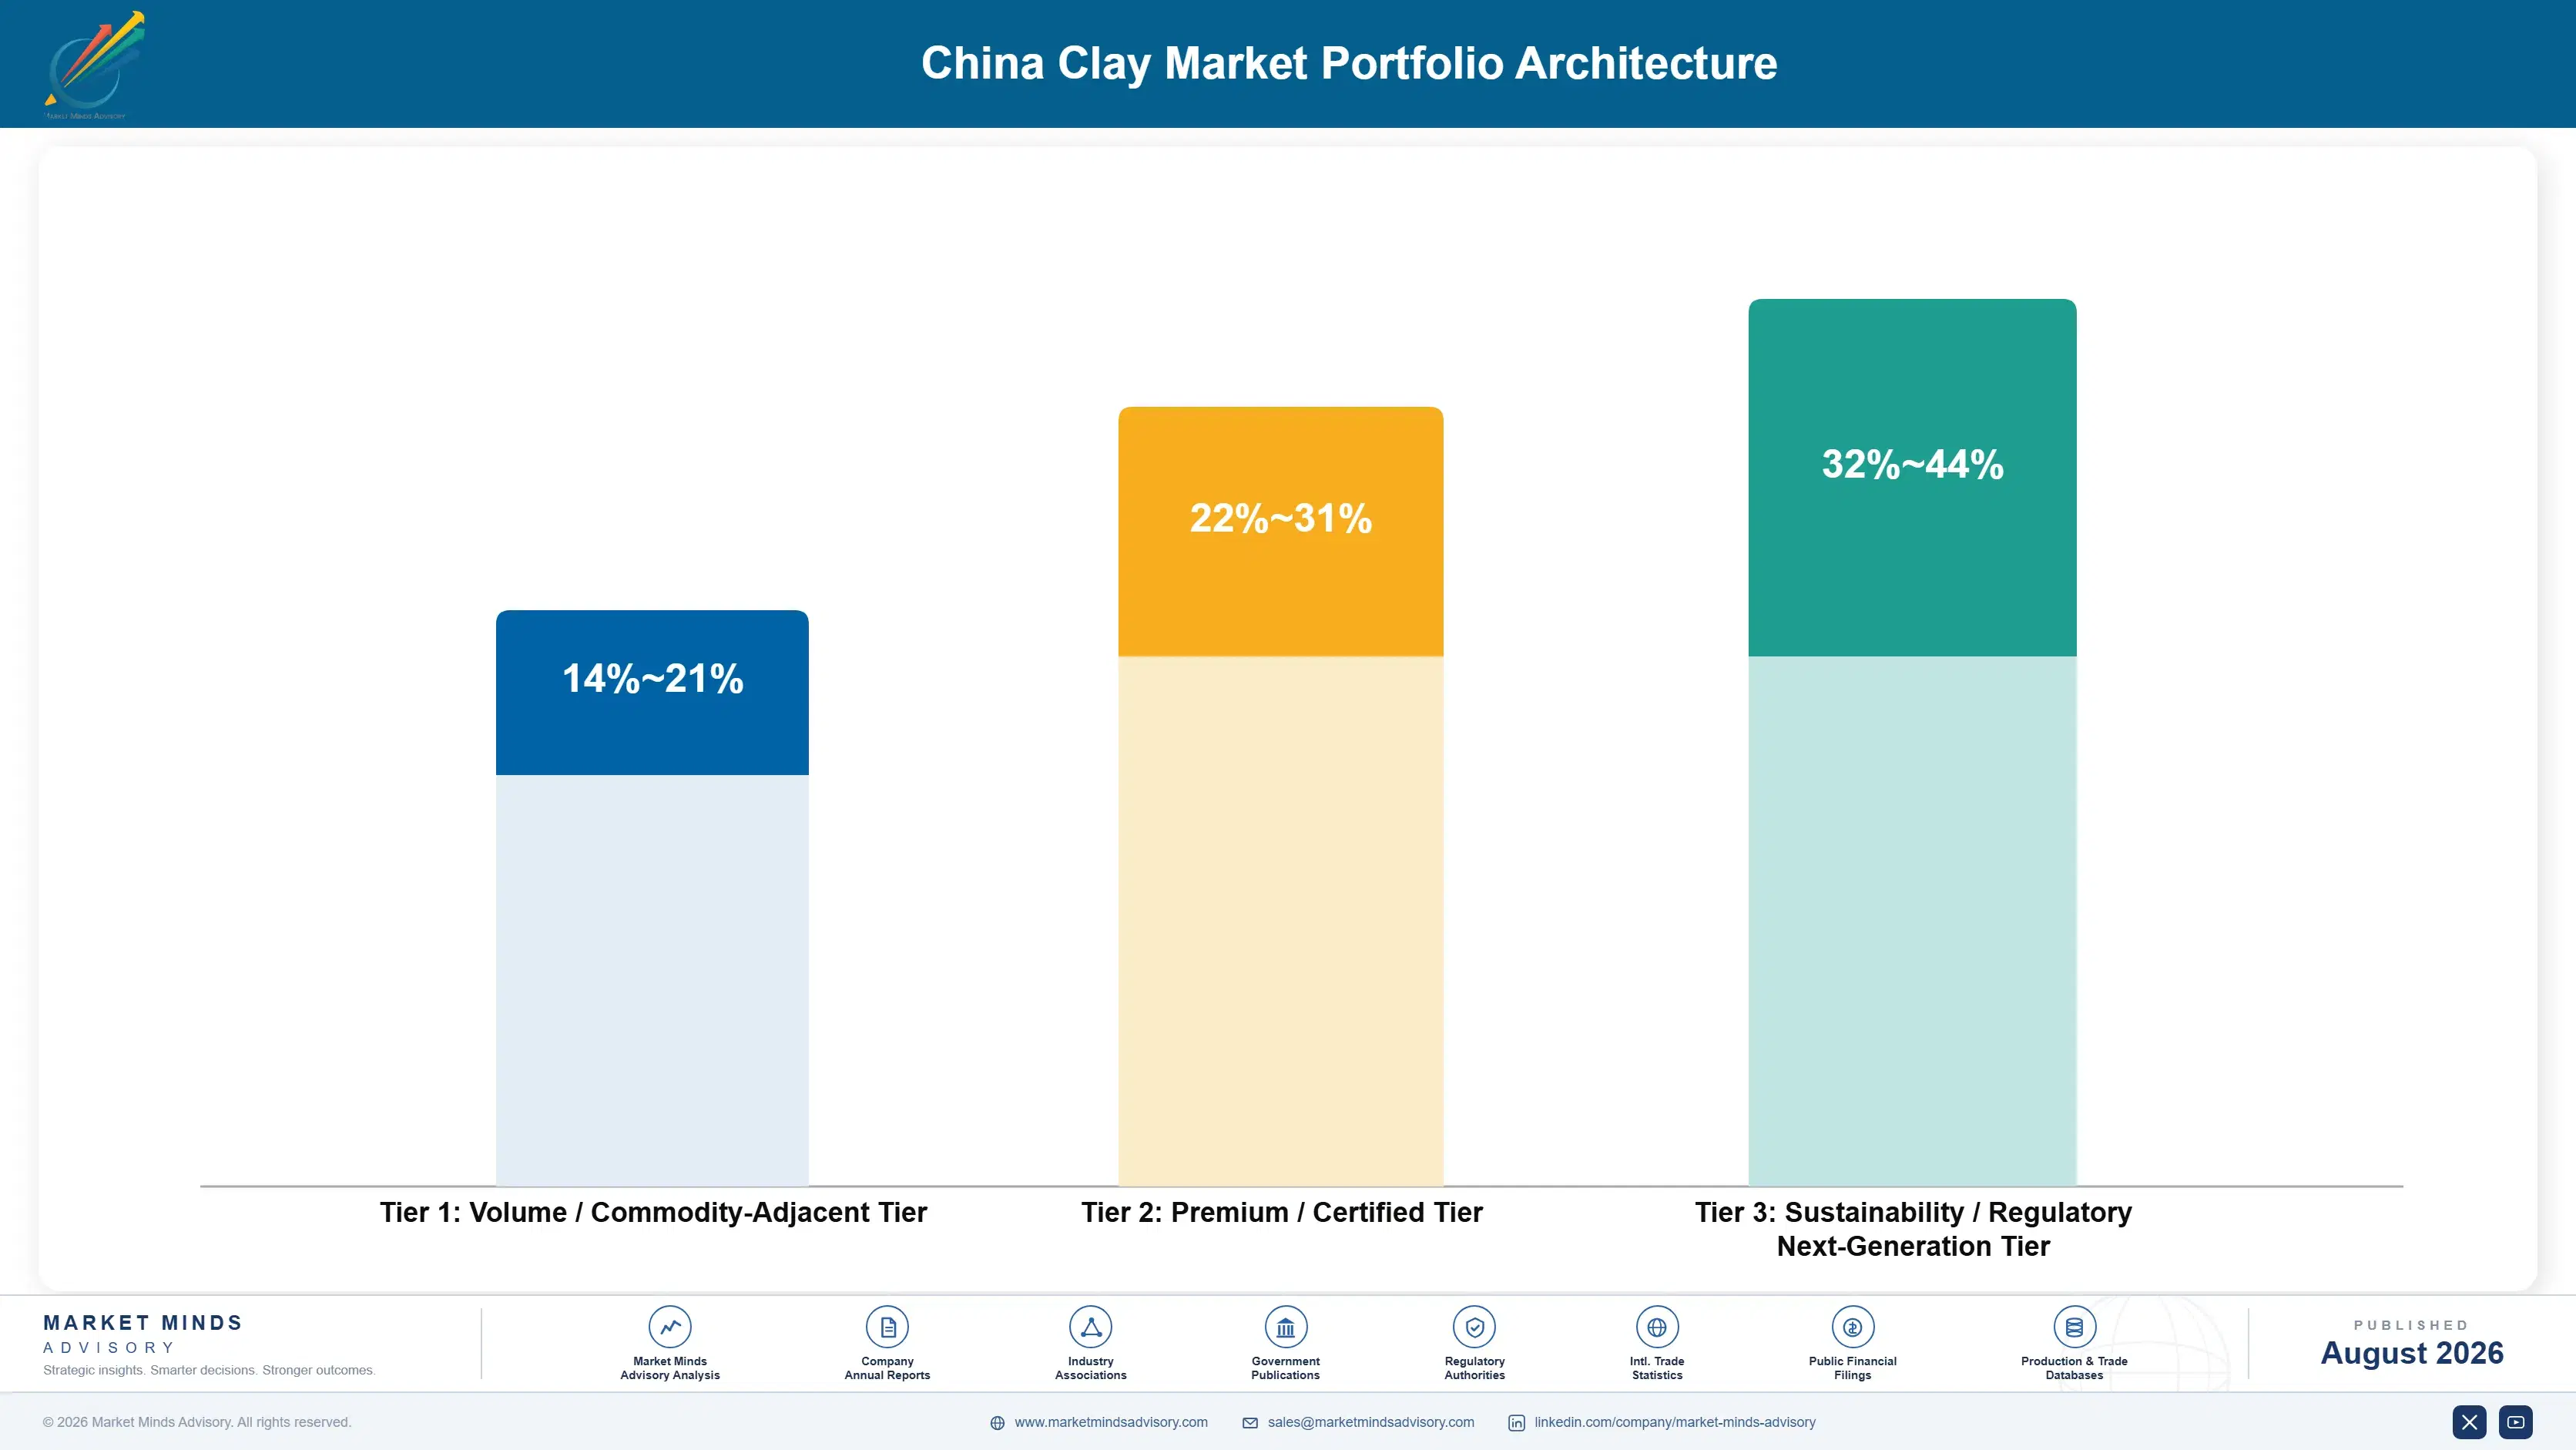
Three tiers describe this business and the spread follows what processing adds rather than what the deposit contains. Ceramic body and filler grades sit at the bottom, where specification tolerance is wide and delivered price decides everything. Paper coating and paint extender grades occupy the middle. Calcined and surface-modified grades sit at the top, where processing rather than geology creates the property being sold.
The tension is that the bottom tier carries growing tonnage into construction-driven demand at prices that barely move, while the top tier is the only place a producer escapes its own reserve limitations. A producer weighted toward ceramic bodies is growing volume and not value. One weighted toward paper coating holds high quality reserves serving an application that keeps shrinking beneath them.

High-value pools concentrate where processing creates the property. Calcined grades substituting for titanium dioxide are the clearest case, since the value comes from what the calciner did rather than from what the ore was, and that is the only part of this business a producer can genuinely improve. Ceramic body qualification is the second such pool, since substituting a named clay means reformulating an entire body.

Volume / Commodity-Adjacent Tier

Ceramic body clays and general filler grades where specification tolerance is wide and delivered price decides most orders. Growing tonnage into construction demand at prices that barely move. Construction cycles rather than media consumption decide it.
Gross Margin: 14-21%

Premium / Certified Tier

Paper coating and paint extender grades where brightness, particle size, and rheology are all specified tightly. High quality reserves serve these applications and the paper half keeps shrinking. Brightness commands no premium elsewhere.
Gross Margin: 22-31%

Sustainability / Regulatory / Next-Generation Tier

Calcined and surface-modified grades where processing rather than geology creates the property sold. Best margin available and the only genuine escape from a deposit's own limitations. Processing rather than the ore body creates the value.
Gross Margin: 32-44%
china-clay-market-portfolio-architecture-1787302691574

Formulations, Radii and Reserves

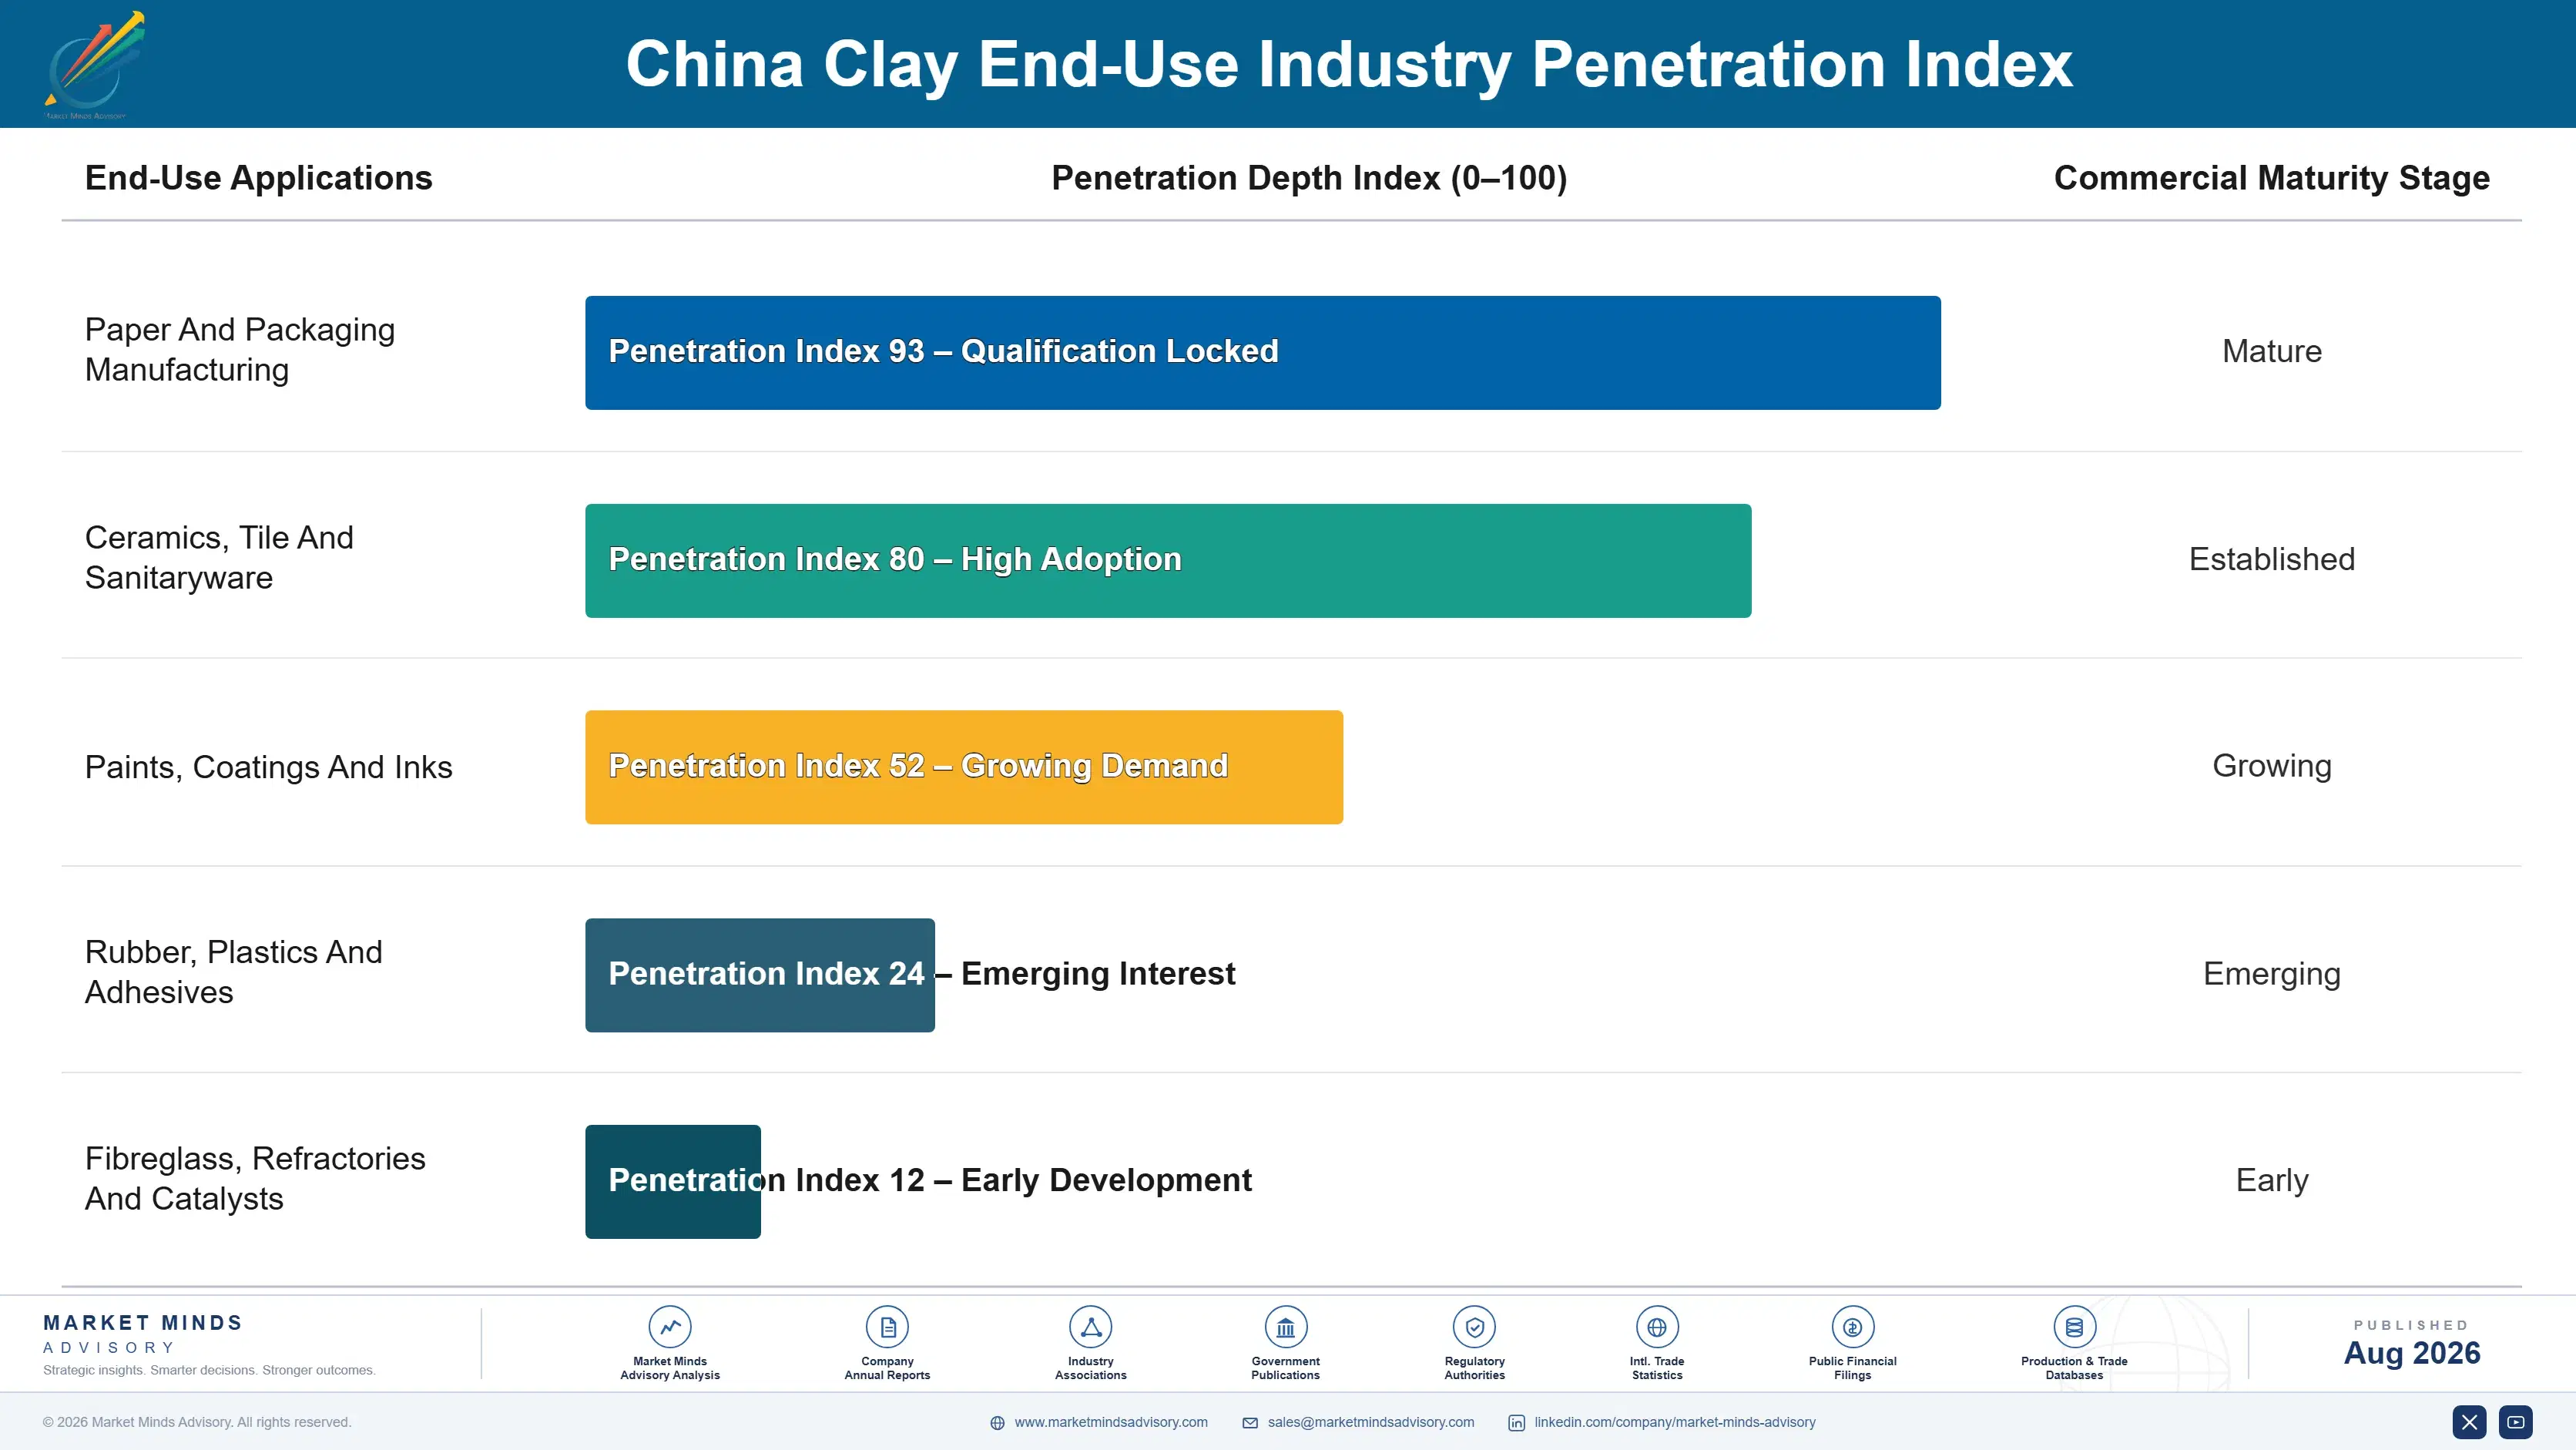
Demand behaves as continuous consumption tied to a customer's own production rather than to any purchasing cycle, since kaolin is a formulation input consumed against tonnes of paper, tiles, or paint made. A ceramic body formulation specifies a named clay from a named deposit, and the producer ships against the customer's output with almost no commercial interaction between contract renewals. Volume follows the customer's own output rather than any purchasing decision anybody takes.
Stickiness runs through formulation qualification rather than through relationships. A ceramic body is balanced around a specific clay's plasticity, shrinkage, and fired colour, and substituting another deposit means reformulating and retesting the whole body. Paper coating formulations stick similarly. Filler applications in polymers and general industrial use stick least and do move on delivered price whenever a nearer supplier appears.

Buyer profiles shifted as paper declined and ceramics grew. The earlier buyer was a paper mill's furnish specialist optimising coating brightness and rheology against a pigment budget. The current conversation increasingly involves a ceramic body formulator concerned with fired shrinkage and colour consistency, or a coatings chemist evaluating whether calcined kaolin can displace part of a titanium dioxide loading.
china-clay-market-end-use-penetration-index-1787302692063

What We Would Tell a Board

These are among the four positions where our research anticipates prominent divergence between winners and laggards over the coming forecast period. Each is grounded in the demand model, the regulatory perimeter, and the announced capacity pipeline.
01 / PROCESSING INVESTMENT PRIORITY

Calcination is the only escape from your geology

Beneficiation removes contaminants and iron staining but never raises a deposit above what the ore body actually contains, so a brightness ceiling near 92 stays exactly where it is whatever gets spent on the processing plant. Calcination and surface modification add properties chemically and grow at 5.7% against 3.8% for the wider market. That is the single route by which a producer improves on the geology it happened to be dealt, and yet most capital in this industry still goes elsewhere entirely.
02 / RESERVE REPOSITIONING REALISM

Your best reserves serve a shrinking application

Paper coating has fallen from around three fifths of world kaolin demand to 31% and continues declining as graphic paper does, while the deposits developed to serve it were selected for exactly the brightness and fine particle size that ceramics and refractories do not pay for. Producers still marketing themselves on brightness are describing a property that their largest remaining customers genuinely do not price at all. That repositioning is uncomfortable, slow, and completely unavoidable for anybody holding those reserves today.
03 / FREIGHT RADIUS DISCIPLINE

You compete in a radius, not in a market

Outbound freight carries roughly 27% of delivered cost for a low value bulk mineral, which means a producer competes against whoever is nearest rather than against the industry, and concentration at just 38% follows directly from that. Shipping crude or semi-processed material out for regional finishing reaches customers that finished product economics would otherwise exclude entirely. Very few producers structure their supply that way at all, and the ones doing so reach demand that nobody else in the industry can serve.
04 / FORMULATOR SUPPORT INVESTMENT

Send chemists, not price lists, to coatings customers

The price differential between calcined kaolin and titanium dioxide is wide enough to fund reformulation work several times over, and formulators have still been slow because reformulating a paint is a technical project rather than any purchasing decision. Producers who send application chemists into their customers' own laboratories convert accounts that years of competitive pricing has never once moved. That application work is expensive to fund and it remains the only mechanism that has reliably taken pigment share from titanium dioxide.

Engagement Snapshot From the Field

A live engagement with an industry participant carrying material or product regulatory and market exposure ahead of a defining policy shift, showing how our research translates into a defensible multi-year portfolio strategy.
MARKET MINDS ADVISORY · CLIENT ENGAGEMENT SUMMARY
China Clay Producer Strategic Portfolio Review and Transition Roadmap 2026·Investment Scenario on China Clay Exposure Evaluation 2025-26
CLIENT PROFILE
A kaolin producer with approximately 210 million dollars in annual revenue (client-reported, unverified by MMA), operating high brightness reserves developed for paper coating export alongside a single calcination line. Paper volumes had declined for eight consecutive years, ceramic sales had grown without replacing the lost revenue, and the board had approved further beneficiation capacity. Calcination had never been expanded.
STRATEGIC CHALLENGE
Management believed additional beneficiation would recover brightness performance and win back paper coating volume, and the board wanted an independent view before committing capital to a plan built on that assumption. Nobody had tested the brightness assumption against the reserve assay data at any point, and no alternative use of the capital had been examined.
MMA APPROACH
We assessed reserve assay data against achievable brightness ceilings rather than against nameplate plant performance. Paper coating demand was modelled by grade and region across five years. Calcination economics were costed against titanium dioxide substitution opportunities, and delivered cost was mapped by customer location rather than at the plant gate.
KEY FINDINGS
  1. Additional beneficiation would raise recovered yield modestly and could not raise brightness at all, since the ceiling was set by the ore body rather than by any plant limitation.
  2. Paper coating demand in the client's served regions was projected to fall further across every grade examined, with no scenario supporting the volume the capital case assumed.
  3. Calcination capacity was operating at full utilisation with an order book the client had been rationing, and no expansion had been proposed by anybody internally.
  4. Delivered cost to half the ceramic customer base was worse than assumed, because freight had been calculated on an average rather than by individual destination.
CLIENT PROFILE
A kaolin producer with approximately 210 million dollars in annual revenue (client-reported, unverified by MMA), operating high brightness reserves developed for paper coating export alongside a single calcination line. Paper volumes had declined for eight consecutive years, ceramic sales had grown without replacing the lost revenue, and the board had approved further beneficiation capacity. Calcination had never been expanded.
STRATEGIC CHALLENGE
Management believed additional beneficiation would recover brightness performance and win back paper coating volume, and the board wanted an independent view before committing capital to a plan built on that assumption. Nobody had tested the brightness assumption against the reserve assay data at any point, and no alternative use of the capital had been examined.
MMA APPROACH
We assessed reserve assay data against achievable brightness ceilings rather than against nameplate plant performance. Paper coating demand was modelled by grade and region across five years. Calcination economics were costed against titanium dioxide substitution opportunities, and delivered cost was mapped by customer location rather than at the plant gate.
KEY FINDINGS
  1. Additional beneficiation would raise recovered yield modestly and could not raise brightness at all, since the ceiling was set by the ore body rather than by any plant limitation.
  2. Paper coating demand in the client's served regions was projected to fall further across every grade examined, with no scenario supporting the volume the capital case assumed.
  3. Calcination capacity was operating at full utilisation with an order book the client had been rationing, and no expansion had been proposed by anybody internally.
  4. Delivered cost to half the ceramic customer base was worse than assumed, because freight had been calculated on an average rather than by individual destination.
RECOMMENDED STRATEGY
Phase 1: Phase 1 (months one to nine): cancel the beneficiation expansion and redirect that capital into a second calcination line. Test the assay ceiling first. Phase 2: Phase 2 (months nine to twenty-four): fund application chemists into coatings formulator laboratories to develop titanium dioxide substitution work. Fund the laboratory work directly. Phase 3: Phase 3 (months twenty-four to forty-two): rebuild the ceramic commercial footprint around delivered cost by destination rather than plant gate economics.
OUTCOME
The beneficiation expansion was cancelled and calcination capacity approved within two quarters. Two application chemists were placed with coatings customers, and ceramic territory was reassigned against delivered cost mapping (client-reported, unverified by MMA). Brightness ceiling data was added to every future capital submission. Paper volume forecasts were revised downward accordingly.

Frequently Asked Questions

Foundational context covering the market sizes, CAGR, scope, country, region and competition that inform every finding below. This section is provided to cover basics and most often pre-purchase conversations, answered from the MMA Primary Research Dataset.

What is the current size of the China Clay Market?

The market is valued at USD 4.6 billion in 2025, rising to USD 4.77 billion in 2026. Scope covers processed kaolin for industrial applications, not crude clay sold at the pit, ball clay, or other industrial minerals.

How large will the China Clay Market be by 2036?

MMA forecasts USD 6.93 billion by 2036, an increase of USD 2.16 billion over the 2026 base. That represents an expansion multiple of 1.45 times across the forecast period.

What is the CAGR for the China Clay Market 2026 to 2036?

The base case CAGR is 3.8%, with a bull case of 5.0% and a bear case of 2.6%. The historical rate from 2020 to 2025 was 3.0%, held down by continuing graphic paper decline.

Which segment is growing fastest?

Calcined and surface-modified grades at 5.7%, exactly 1.50 times the market rate. Processing adds properties the deposit never contained, which is the only escape from a reserve's own limitations.

Who are the major companies in the China Clay Market?

Imerys, Sibelco, KaMin, Thiele Kaolin, and BASF lead on processed tonnage supplied. The top five hold just 38%, since deposit geography and freight economics both limit any producer's reach.

Which country is growing fastest?

India at 6.4%, where ceramic tile and sanitaryware production is expanding faster than any other national industry alongside domestic reserves in Kerala and Rajasthan. Producers there have invested in calcination alongside.

Report Segmentation Architecture

The full report scope spans multiple orthogonal segmentation dimensions, with cross-tabulated demand data provided for each dimension pair. Coverage extends further to regional breakdowns, trend trajectories, and the competitive detail needed to support segment-level decision-making.

By Processed Grade And Property

  • Paper Coating And Filling Grades
  • Ceramic And Refractory Grades
  • Paint And Coatings Extender Grades
  • Rubber And Polymer Filler Grades
  • Calcined And Surface-Modified Grades

By End-Use Industry

  • Paper And Packaging Manufacturing
  • Ceramics, Tile And Sanitaryware
  • Paints, Coatings And Inks
  • Rubber, Plastics And Adhesives
  • Fibreglass, Refractories And Catalysts

By Commercial Model

  • Direct Bulk Supply To Formulators
  • Slurry And Pipeline Delivery Arrangements
  • Regional Processing And Finishing Supply
  • Distributor And Trader Channels
  • Toll Calcination For Third Parties

By Region

  • East Asia
  • North America
  • Western Europe
  • South Asia and Pacific
  • Latin America
  • Eastern Europe
  • Middle East and Africa

Scope, Methodology, and Coverage

Every figure in this report is reproducible from documented input assumptions. The scope below maps the historical period, the forecast horizon, the segmentation dimensions, and the countries covered, alongside the underlying primary and qualitative methodology.
Historical Period
2020 to 2025
Forecast Period
2026 to 2036
Base Year
2025 (USD billions; MMA Primary Research Dataset, August 2026)
Market Definition
This market comprises processed kaolin supplied for industrial formulation and manufacturing applications, measured at producer revenue across direct bulk, slurry, regional processing, distribution, and toll processing channels. Coverage spans paper coating and filling grades, ceramic and refractory grades, paint and coatings extender grades, rubber and polymer filler grades, and calcined and surface-modified grades including metakaolin and silane-treated products. Crude unprocessed clay sold at the pit or as run of mine, ball clay, fire clay and other plastic clays, bentonite, attapulgite, talc, calcium carbonate and other industrial minerals, finished paper, ceramic and coating products, kaolin-derived alumina, zeolites and other chemical conversion products, and mineral exploration and mine development services fall outside scope.
Quantitative Units
USD billions (current prices); processed tonnage supplied by grade; price per tonne by application; beneficiation yield from crude ore
Segmentation Dimensions
By Processed Grade And Property; By End-Use Industry; By Commercial Model; By Region
Regions Covered
East Asia, North America, Western Europe, South Asia and Pacific, Latin America, Eastern Europe, Middle East and Africa
Countries Covered
China, Japan, South Korea, India, Vietnam, Thailand, Indonesia, Australia, United States, Canada, Mexico, Brazil, Colombia, United Kingdom, Spain, Portugal, Germany, France, Italy, Czechia, Ukraine, Poland, Bulgaria, Egypt, Saudi Arabia, South Africa, and additional markets relevant to this sector
Key Companies Profiled
Imerys, Sibelco, KaMin, Thiele Kaolin, BASF, Quarzwerke, LB Minerals, Ashapura Group, English Indian Clays, 20 Microns, Kaolin AD, Active Minerals International, Burgess Pigment, Wilkinson Kaolin Associates, Sedlecky Kaolin, Minerals Technologies, Lasselsberger, Vale, Maoming Kaolin, Longyan Kaolin
Quantitative Methodology
Primary survey, n=3,800 respondents, Q4 2025, six countries; demand-side model with trade association cross-validation
Qualitative Methodology
47 expert interviews, Q4 2025; applied to validate demand model assumptions, identify emerging dynamics, and assess competitive positioning
Report Format
PDF and XLSX data workbook (Word format preview document)
Publisher
Market Minds Advisory
Report Code
MMA-2026-CHM-910
Published
August 2026
Contact
sales@marketmindsadvisory.com | www.marketmindsadvisory.com

Purchase the full China Clay Market Report (2026 to 2036).

The full report sizes china clay across five processed grades, five end-use industries, five commercial models, and seven regions, with reserve quality assessed against achievable brightness ceilings rather than plant nameplate performance. Paper demand decline is modelled by grade and region separately from packaging growth, since the two move in opposite directions. Delivered cost is mapped by customer destination rather than at the plant gate. Competitive profiling covers twenty producers on processed tonnage, and calcination capability is assessed separately from beneficiation capacity. Regional figures reflect deposit geology and ceramic production rather than any industrial output measure.
Reserve quality assessed against achievable brightness rather than plant nameplate
Paper demand modelled by grade separately from packaging growth
Delivered cost mapped by customer destination rather than plant gate
Calcination capability assessed separately from beneficiation processing capacity
Titanium dioxide substitution opportunity quantified by coatings application
Ceramic body formulation qualification tracked by deposit and producer

Built For The People Who Decide

From boardroom strategy to bench-side execution, this report is read cover-to-cover by leaders shaping the next decade of their industry, turning demand scenarios, market dynamics and valuation benchmarks into decisions.
CXOs/ Presidents/ VPs/ Managers
M&A and Corporate Development
Strategy Teams and R&D Heads
Procurement and Product Directors
Regulatory and Compliance Leaders
Investor Relations and Equity Analysts