Market Minds Advisory
Ceramic Tiles Market

Ceramic Tiles Market: Freight Decides Who Competes Long Before Price Does

A container of standard tile costs more to ship across an ocean than the tile inside it is worth, which is why this industry has stayed regional despite two decades of consolidation talk.

Lead Analyst

Bilal Shaikh

Published

August 2026

Make Smarter Decisions with Customized Research Insights

Request a free sample report and evaluate market opportunities, growth trends, and competitive dynamics relevant to your business needs.

2025 MARKET VALUE$78.0BMarket Size 2025
2036 FORECAST VALUE$126.6BBase Case , 2026 to 2036
CAGR 2026 TO 20364.5 %Bull 5.7% / Bear 3.3%
INCREMENTAL OPPORTUNITY$45.1BNet 10- year value creation
EXPANSION MULTIPLE1.55x2036 value over 2026 base
Strategic Levers
M&A Pipeline
Regional Outlook
Country Rankings
Competitive Intelligence
Segmental Deep-dive
Call-Us : 91 93563 13602

Executive Snapshot and Market Trajectory

Freight typically runs about 34% of the delivered cost of standard tile shipped intercontinentally, which means the material cannot travel far enough to make anybody global. Concentration sits at 9% across the top five, the lowest of any construction material we cover, and it is not going to rise.
Growth runs at 4.5% and large format leads it. Large format porcelain slabs and panels grow at 6.75%, exactly 1.50 times the market rate, because they replace stone and laminate surfaces rather than competing against other tile. East Asia holds the largest share at 42%, far outside band, because Chinese production and consumption together exceed everywhere else combined. Porcelain floor tile follows at 5.4%, taking share steadily from glazed ceramic.
Kiln energy carries roughly 29% of production cost and it enters the market as a regional variable rather than a global one. European producers spent 2022 discovering exactly what that means, and several have not recovered the position they held before it. Indian producers have taken export share into markets European capacity previously served. Engineered quartz makers compete directly for the slab applications carrying best margin.
Market Definition
This market covers fired ceramic tile products for floor, wall, and surface applications, spanning glazed ceramic wall and floor tiles, porcelain floor tiles, large format porcelain slabs and panels, technical and industrial ceramic tiles, and decorative and artisan tile production. Natural stone slabs and tiles, terrazzo and cast concrete surfaces, vinyl and laminate flooring, tile adhesives, grouts and installation systems, and sanitaryware fall outside scope.
Base Year Value
$78.0B in 2025 (MMA Primary Research Dataset, August 2026)
Forecast Period
2026 to 2036, eleven discrete annual values
CAGR
4.5% base case. Bull 5.7%. Bear 3.3%.
Fastest Growth Segment
Large Format Porcelain Slabs and Panels: 6.8% CAGR
Fastest Growth Country
India: 6.2% CAGR
Fastest Growth Region
South Asia and Pacific: 6.1% CAGR
Largest Region
East Asia: 42% of 2025 global value
Market Leaders
Mohawk Industries, Grupo Lamosa, RAK Ceramics, Kajaria Ceramics, SCG Ceramics. Source: MMA Analysis based on company annual reports.
Primary Survey
n=3,800 procurement and R&D decision-makers, Q4 2025, six countries
Methodology
Demand-side build-up, cross-validated against public data, 47 expert interviews

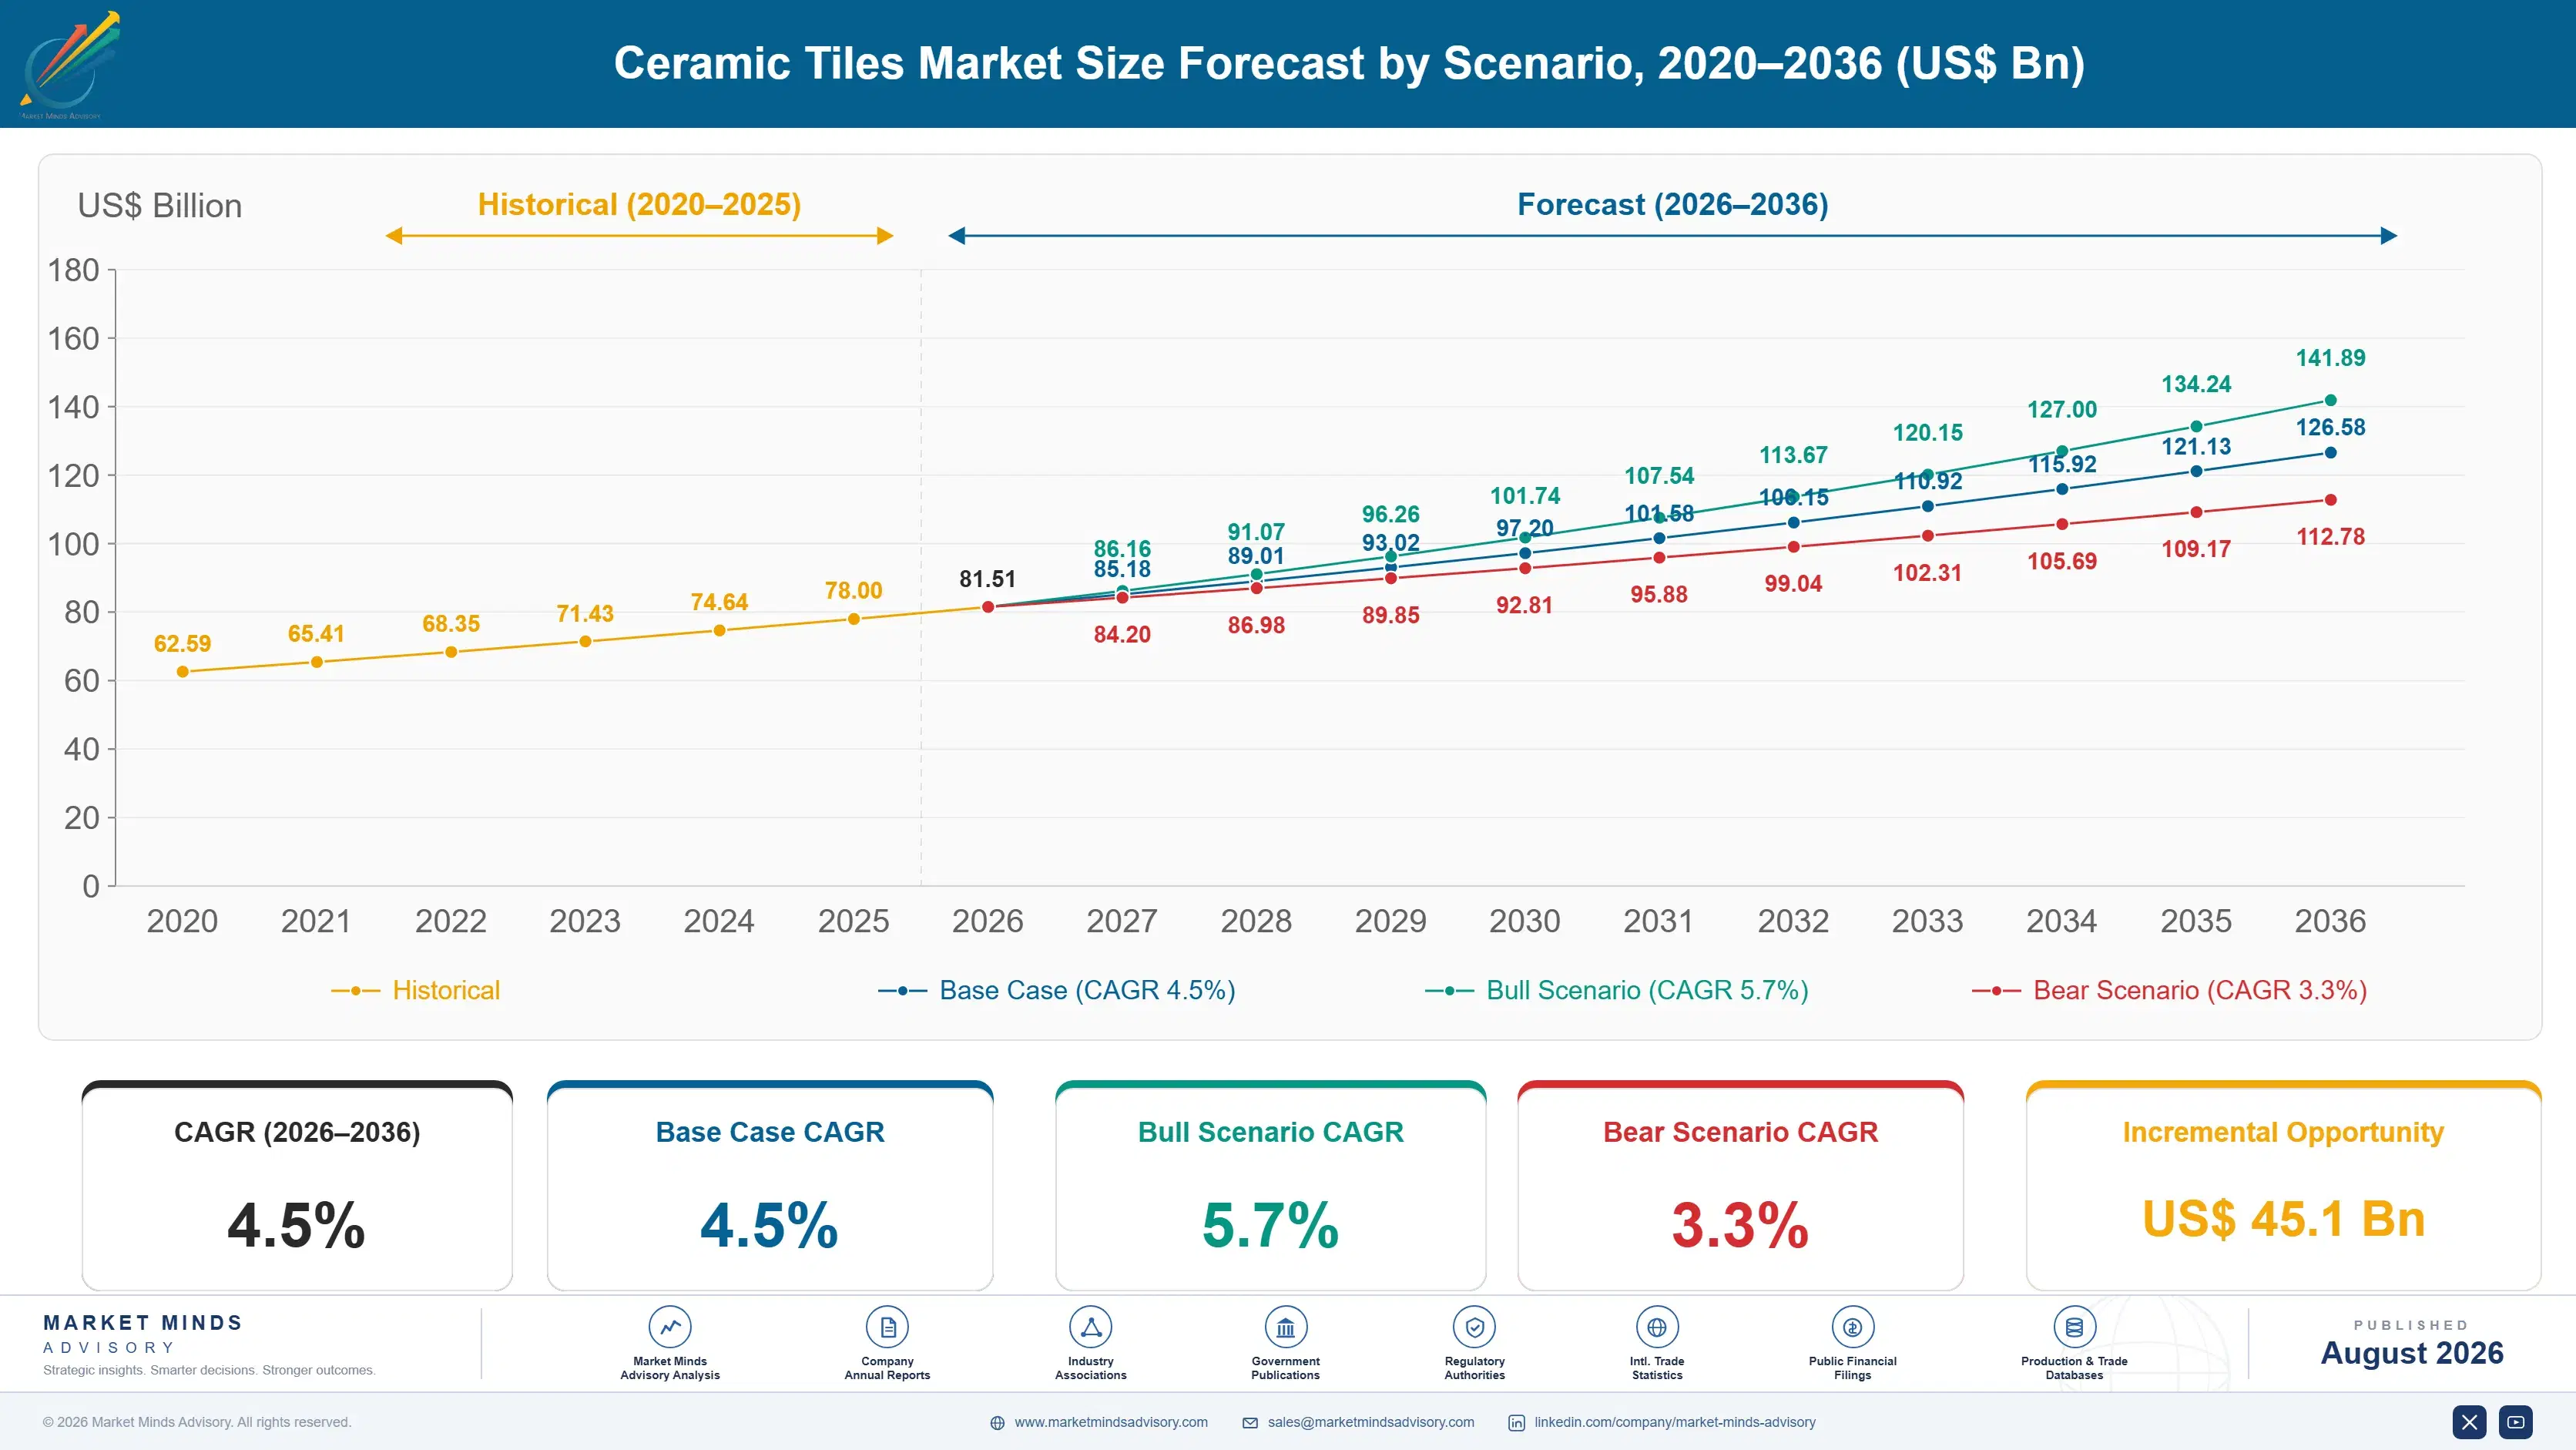
Ceramic Tiles Market Forecast Scenarios

ceramic-tiles-market-size-forecast-scenario-1787302683439
The 2020 to 2025 period ran at 3.3% and energy cost defined it far more than construction volume did. European kilns faced gas prices through 2022 that made production uneconomic at prevailing tile prices, and several plants closed permanently. Indian and Chinese producers gained export share into markets that European capacity had previously served, and freight economics limited how far that shift could travel.
Three mechanisms carry the 4.5% base case. Large format slab substitution is the largest, since those products displace stone and engineered surfaces rather than competing for tile share. Renovation activity is the second, which runs on a different cycle from new construction and is considerably less volatile. And emerging market housing completion is the third, adding volume rather than value. None of the three depends on new construction volumes recovering.
The 5.7% bull case rests on large format penetration accelerating in kitchen and bathroom surfaces, where the material competes against stone at prices it can win on. The 3.3% bear case is construction weakness across major markets combined with continued European energy cost disadvantage, which would keep closing capacity that regional demand still needs. Neither case turns on any change in freight economics.

Why Nobody Is Global Here

Ceramic tile is heavy, fragile, and cheap per square metre, which is a combination that keeps an industry regional whatever anybody plans. Freight runs around 34% of delivered cost when standard tile crosses an ocean, so a producer in one continent simply cannot compete on price in another for the volume grades. Concentration at 9% across the top five follows directly from that arithmetic.
FREIGHT SHARE DELIVERED34%Of delivered cost when standard tile ships between continents
KILN ENERGY SHARE29%Of production cost, and it varies enormously between regions
TOP FIVE CONCENTRATION9%The lowest of any major construction material we cover
RENOVATION DEMAND SHARE58%Of volume going into replacement rather than new construction
LARGE FORMAT PRICE PREMIUM3.2 timesPer square metre against standard glazed floor tile
TYPICAL PLANT CAPACITY6 millionSquare metres annually from a single modern production line
Energy is the second regional variable. Kilns fire at high temperature continuously and energy carries roughly 29% of production cost, so gas and electricity pricing determines who can produce competitively rather than merely who earns more. European producers discovered exactly what that means through 2022, when several plants became uneconomic at any tile price the market would pay and closed permanently rather than idling.
The exception to the freight rule is large format. Porcelain slabs command around 3.2 times the price of standard floor tile per square metre, which changes the freight arithmetic entirely and lets those products travel. They also compete against stone and engineered surfaces rather than against other tile, which is a completely different commercial contest with a different set of competitors in it.
"A client wanted a global tile strategy. I asked what they would ship. Standard tile cannot cross an ocean profitably and never has. Their global strategy was really a slab strategy and they had not noticed."
Director, Construction Materials and Surfaces Practice · MMA Construction Materi

Market Trends

Large Format Slabs Escape The Freight Constraint

Porcelain slabs at around 3.2 times the price of standard floor tile per square metre carry freight far more comfortably than volume grades ever can, which is why the only genuinely international tile businesses are built on them. Large format grows at 6.75% against 4.5% for the market. Those products also compete against stone, quartz, and laminate surfaces rather than against other tile, which is a different contest with different competitors entirely. Winning that contest requires fabrication, edge finishing, and installer training tile distribution never built. Producers shipping slabs through tile merchants lose to quartz suppliers holding all three.
Market Impact: Renovation is 58% of volume
Energy Cost Redrew The European Production Map

Kiln energy carries roughly 29% of production cost, and European gas pricing through 2022 made several plants uneconomic at any tile price the market would accept. Those closures were permanent rather than temporary idling, and the capacity has not been rebuilt. Indian and Chinese producers gained export share into the markets those plants had served, limited only by the freight arithmetic that governs how far volume tile can profitably travel at all. The Sassuolo and Castellon clusters have retreated toward large format and design-led production. That retreat was rational and it removed volume capacity permanently.
Market Impact: Slabs cost 3.2 times more

Market Opportunities and Growth Drivers

Renovation Demand Runs On Its Own Cycle

Around 58% of tile volume goes into replacement and renovation rather than new construction, and that demand follows housing stock age, household formation, and discretionary spending rather than building permits. It is considerably less volatile than new build activity and it continues through construction downturns that remove the other 42% entirely. Producers weighted toward renovation channels ride those cycles considerably better than any selling primarily into project construction. Channel positioning rather than product capability determines that exposure entirely. It is decided years before any construction downturn actually arrives to test it.
Market Impact: Freight is 34% of delivered cost

Slab Products Compete Against Stone Rather Than Tile

Large format porcelain used as kitchen worktops, bathroom surfaces, and feature walls competes against natural stone, engineered quartz, and solid surface materials at prices it wins on comfortably. That contest has different competitors, different distribution, and different specification routes from the tile business those producers came from. Winning it requires fabrication capability, edge finishing, and installer training that conventional tile distribution never developed at all. The premium at roughly 3.2 times standard tile pricing only holds where the delivery chain supports it. Kitchen and bathroom specialists rather than tile merchants make these purchases.
Market Impact: Kiln energy is 29% of cost

Market Restraints and Challenges

Freight Economics Prevent Any Global Position

Freight runs around 34% of delivered cost for standard tile crossing an ocean, and the root cause is a heavy, fragile, low-value-per-tonne product that has never travelled economically. Commercial impact is concentration stuck at 9% and every producer competing regionally regardless of scale ambitions. Mitigation runs through large format products where price supports the freight, through regional production footprints assembled by acquisition, and through simply accepting that any global tile strategy is not achievable at all. Two decades of confidently predicted consolidation produced multi-regional groups rather than any global one at all.
Market Impact: Slabs command 3.2 times pricing

Regional Energy Pricing Decides Who Can Produce

Kilns fire continuously at high temperature and energy carries roughly 29% of production cost, so a producer in a high gas price region carries a disadvantage no operational improvement addresses. The root cause is thermodynamic rather than commercial. Commercial impact was demonstrated across Europe through 2022 when plants closed permanently. Mitigation runs through kiln efficiency and heat recovery, long-term energy contracting, and locating new capacity against energy cost rather than against demand. Siting decisions must balance energy cost against a delivery radius rather than optimising either alone. Very few producers model both constraints together when choosing locations.
Market Impact: Energy is 29% of production cost
3 additional market trends, 4 additional growth drivers, and 2 additional restraints and challenges are covered in the full report. Contact sales@marketmindsadvisory.com to access the complete intelligence.

Segment CAGR and Growth Architecture

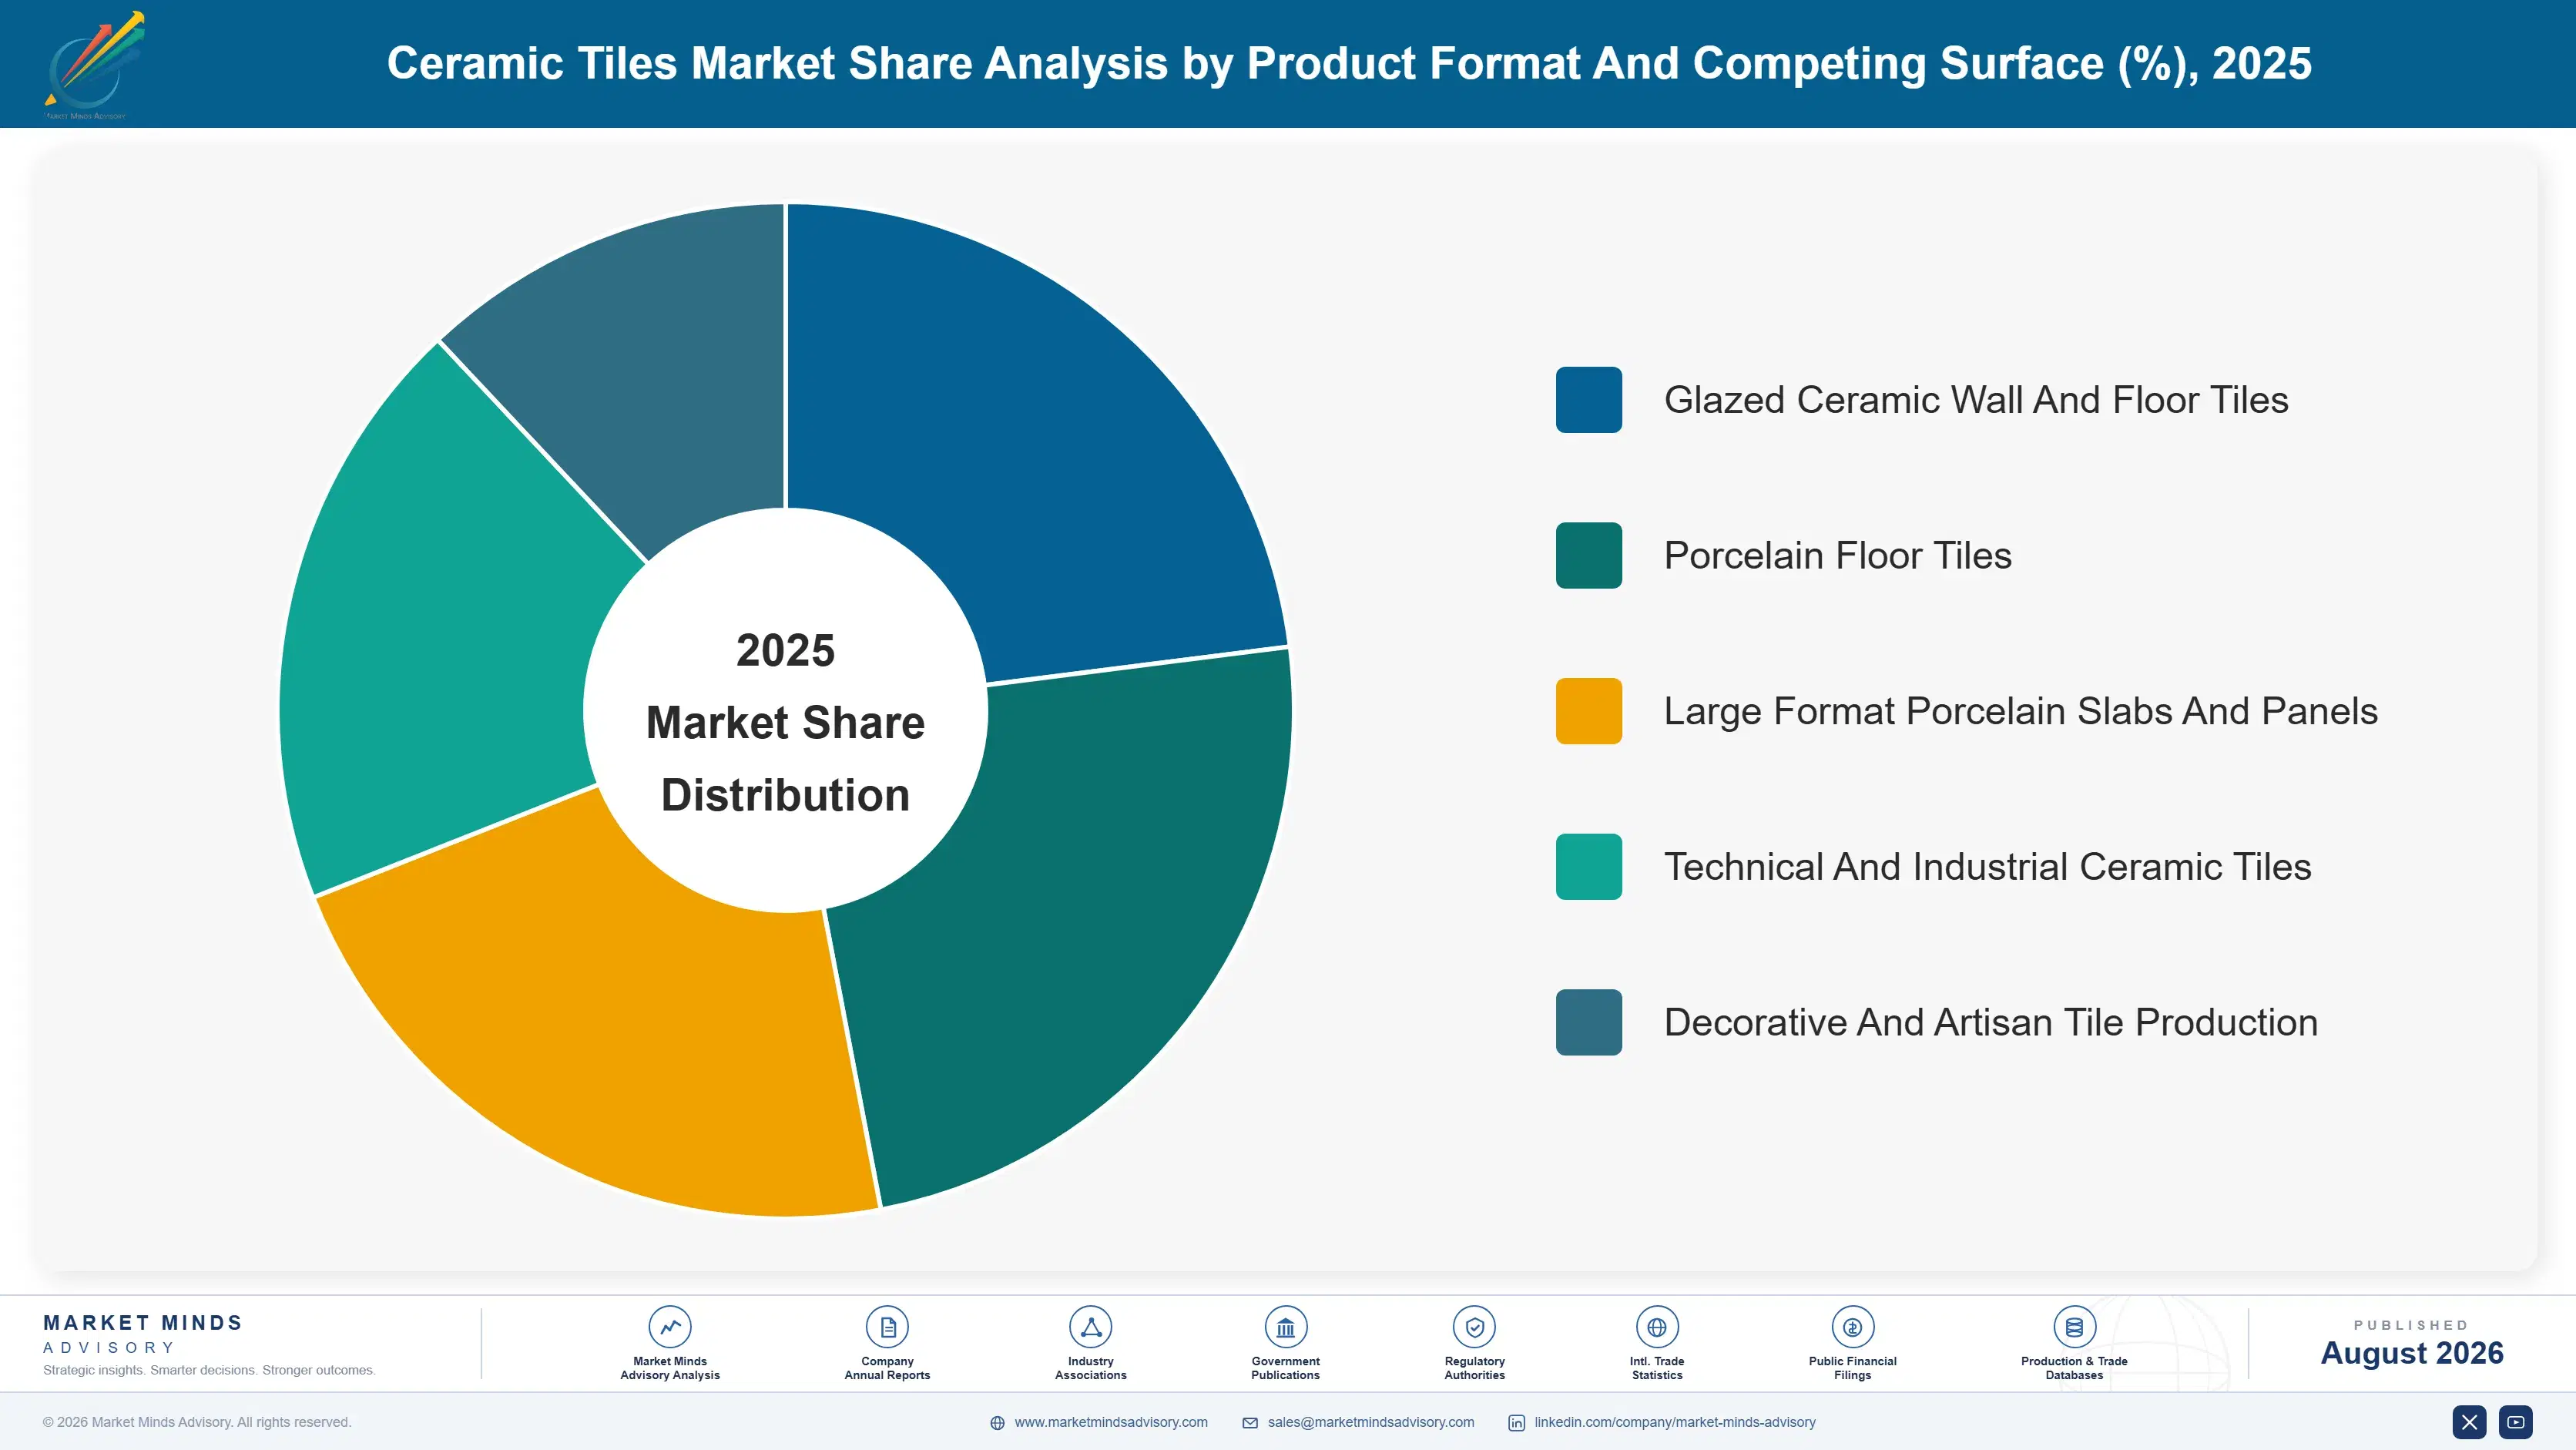
Segmentation follows product format and the surface it competes against, because those determine price per square metre, freight tolerance, distribution route, and which materials the product is actually displacing. Body composition and finish both cut across every format rather than separating them, which makes either a weaker primary dimension here. Price per square metre decides how far a product travels.
ceramic-tiles-market-market-share-analysis-1787302684051

Large Format Porcelain Slabs And Panels

The fastest format at 6.75%, exactly 1.50 times the market rate, and the only one that escapes the freight constraint governing everything else. Prices at around 3.2 times standard floor tile per square metre carry intercontinental shipping quite comfortably, which is why every genuinely international tile business is built on these products. They compete against natural stone, engineered quartz, and solid surfaces rather than against other tile, which requires fabrication capability, edge finishing, and installer training that conventional tile distribution never once developed at all. Kitchen and bathroom specialists rather than tile merchants make these purchasing decisions. Engineered quartz suppliers already hold the channel capability that tile producers must build.
CAGR 6.8%

Porcelain Floor Tiles

Second fastest at 5.4% and the largest single format by volume, taking share steadily from glazed ceramic on durability, water absorption, and the appearance range that digital printing now delivers. Production requires higher firing temperatures and therefore more energy than glazed ceramic, which sharpens the regional energy cost disadvantage that closed European plants. Freight economics confine competition regionally as they do across all volume grades, so producers compete against neighbours rather than against the lowest cost producer anywhere. Digital printing has closed most of the appearance gap that once favoured natural materials. Body composition and firing schedule determine water absorption class and therefore application suitability. Energy intensity remains the commercial constraint.
CAGR 5.4%
Full segment breakdown across 5 segments available in the complete report.

Regional Architecture and Country Demand Map

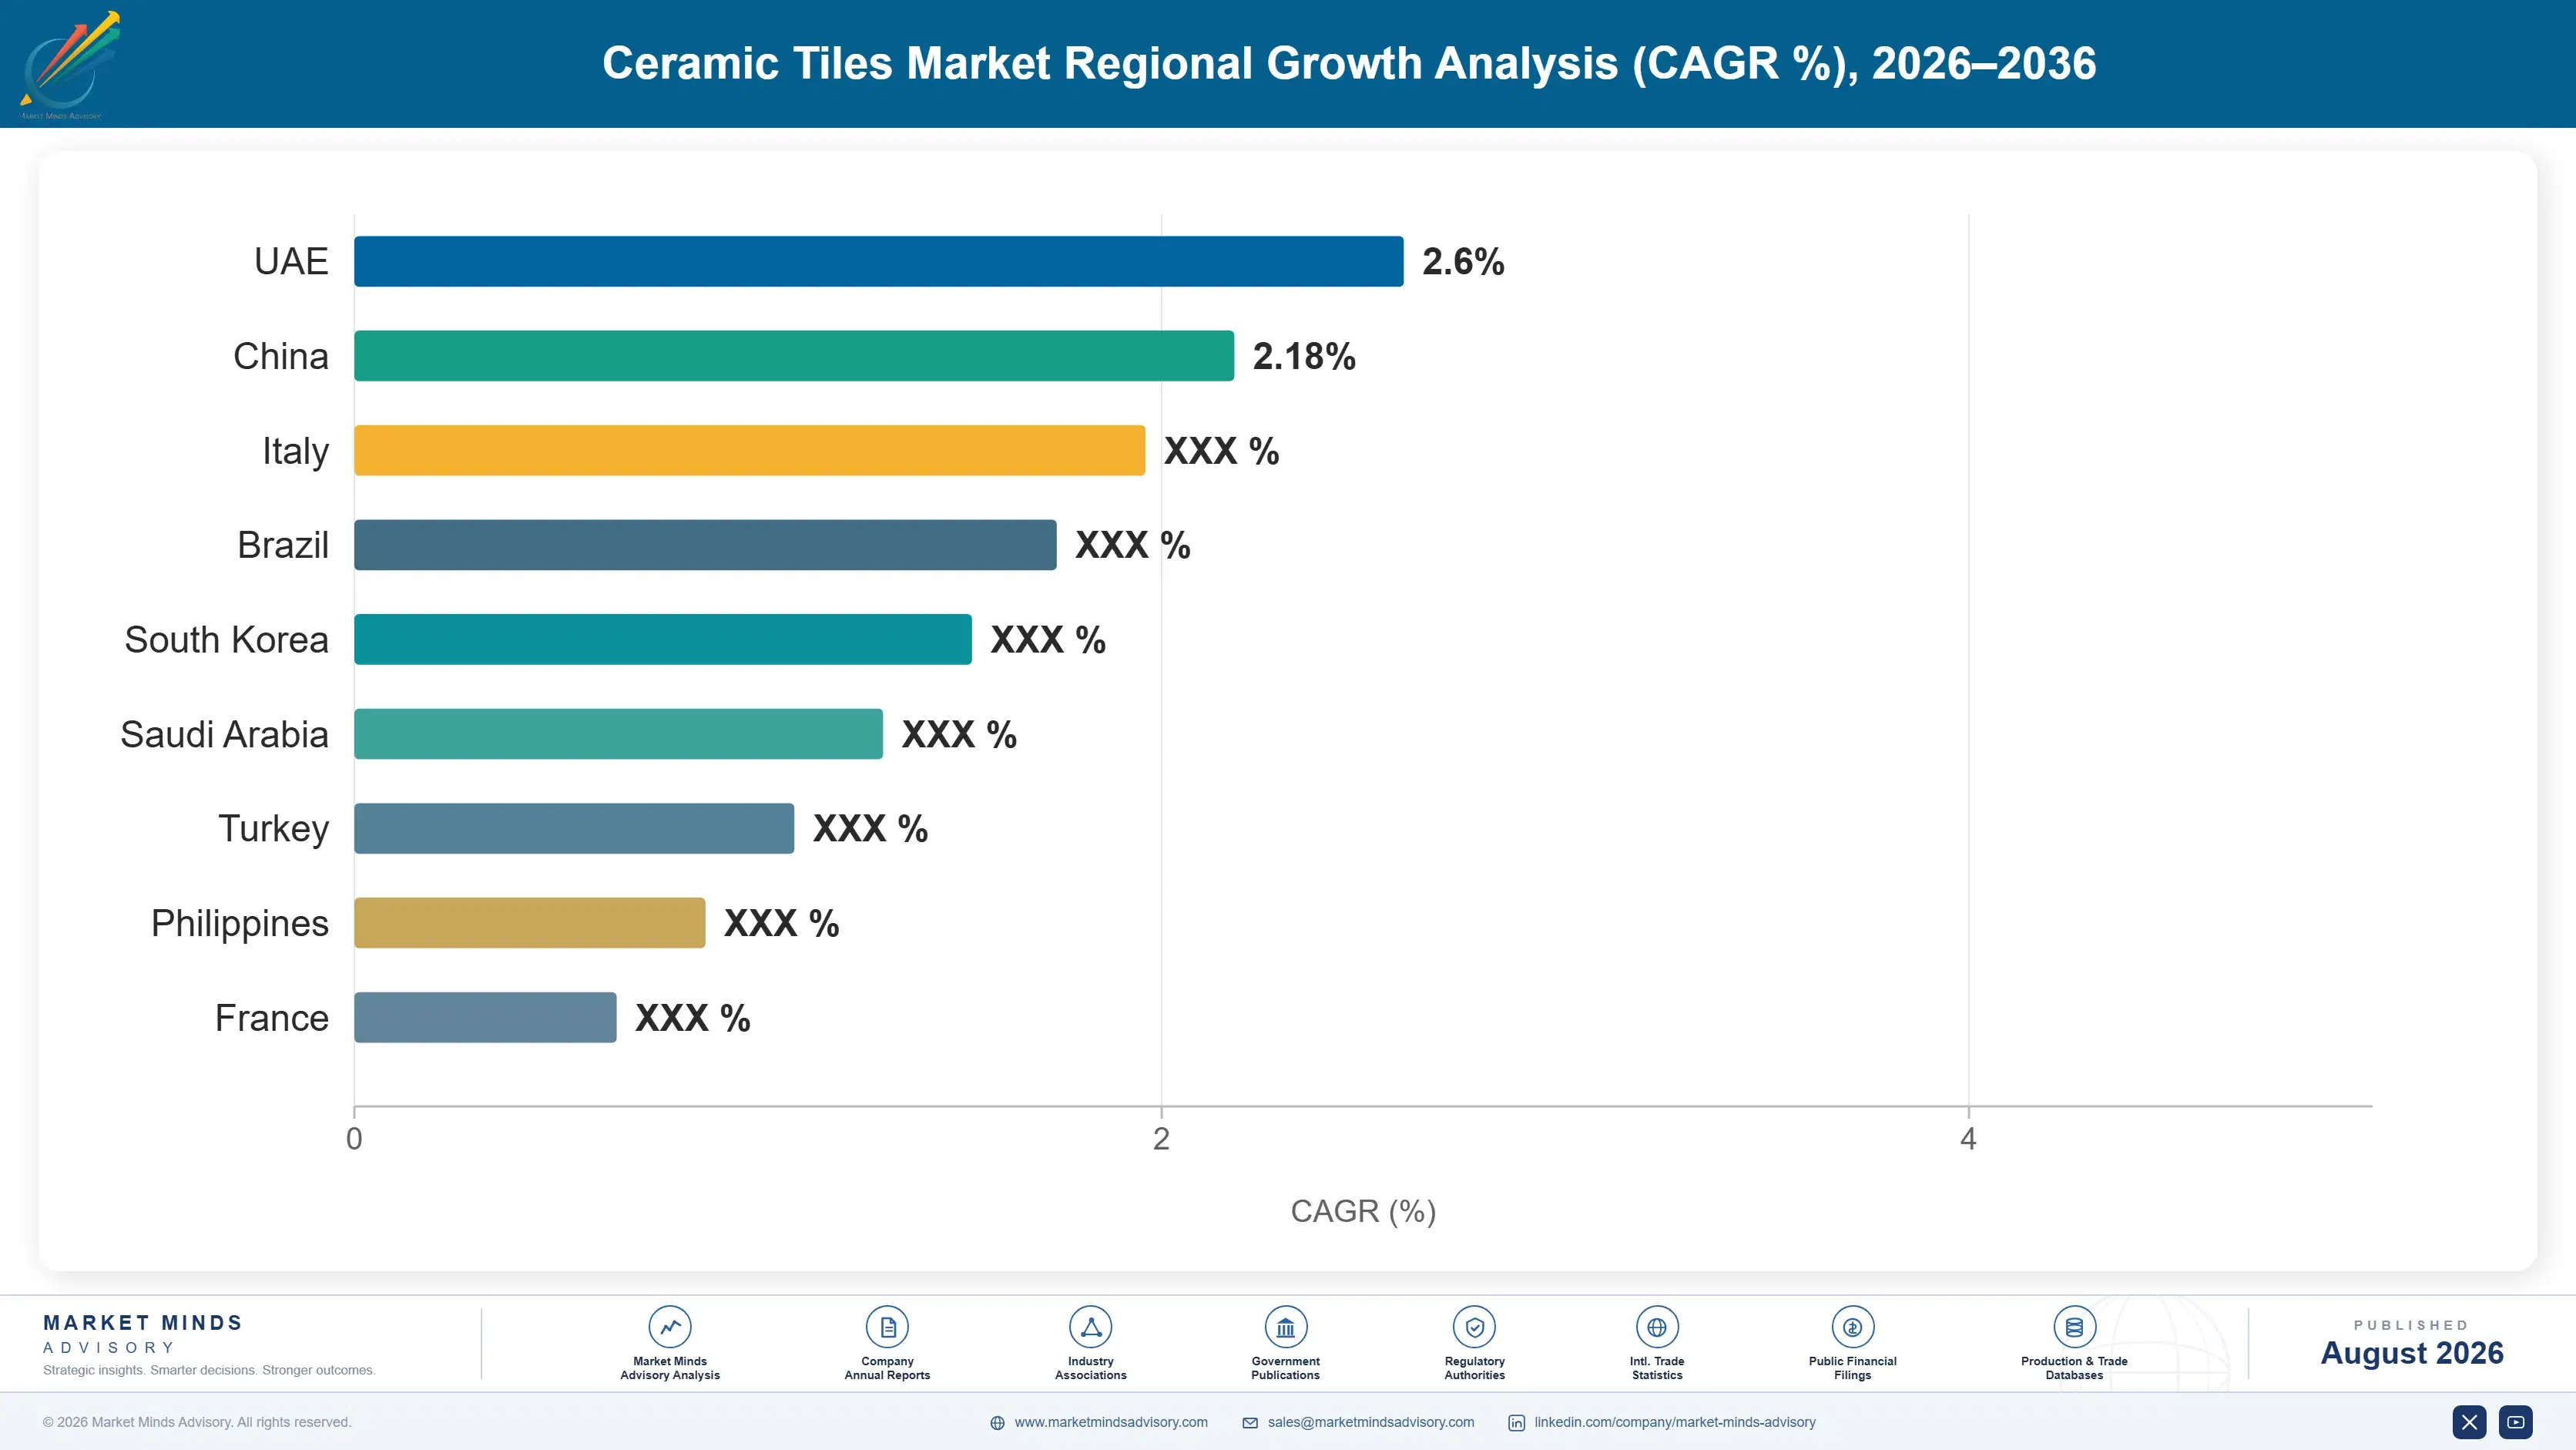
East Asia leads at 42%, far outside band, because Chinese production and consumption together exceed every other region combined. South Asia and Pacific follows on Indian output and housing demand. Latin America grows fastest after India. Every share here follows kiln location and freight radius.

East Asia

Forty-two percent, far outside the framework band, and justified because Chinese tile production and consumption together exceed the rest of the world combined by a considerable margin. That concentration is a measured fact about where the kilns and the construction are rather than any analytical judgement. Chinese producers also supply export volume within the range freight economics permit, which reaches Southeast Asia and the Middle East rather than Europe or the Americas. Growth at 5.4% runs above the market rate on renovation demand rather than new construction. Export reach is limited by the same freight arithmetic that constrains every producer everywhere. Renovation rather than new construction now carries most of the domestic demand.
Share: 42% | CAGR: 5.4% (2026 to 2036)

South Asia and Pacific

Seventeen percent, above the framework band, and Indian production and consumption account for the substantial majority. Morbi in Gujarat concentrates an enormous cluster of tile plants supplying domestic housing demand and exporting across the Middle East, Africa, and Southeast Asia within freight-viable range. Indian gas pricing and labour cost together produce a position European producers cannot approach. Growth at 6.1% is the fastest of any region, driven by housing completion volume and rising renovation activity together. The 17% sits above the framework band, justified because Morbi concentrates production and Indian consumption together. Freight range from Gujarat reaches Africa and Southeast Asia but not the Americas. Indian gas pricing and labour cost together produce positions European producers cannot approach.
Share: 17% | CAGR: 6.1% (2026 to 2036)
Regional intelligence for 5 additional markets available in the complete report: Western Europe, Latin America, Middle East and Africa, North America, Eastern Europe. Contact sales@marketmindsadvisory.com.
ceramic-tiles-market-country-cagr-analysis-1787302684608

Selling Where Freight Permits Margin

Freight runs about 34% of delivered cost intercontinentally, kiln energy carries 29% of production cost, renovation is 58% of volume, and slabs command 3.2 times standard pricing. Value comes from large format products, from renovation channel positioning, and from siting capacity against energy cost. Freight rather than competitiveness decides where anybody is able to sell.

Build The Export Business On Slabs Only

Standard tile simply cannot cross an ocean profitably, because freight runs around 34% of delivered cost and no amount of commercial effort changes that arithmetic. Large format slabs at roughly 3.2 times the price per square metre carry exactly that same freight comfortably, which is precisely why every genuinely international tile business is built on them. A producer planning any international expansion around volume grades is planning something that the physics of the product will not permit. Two decades of consolidation produced multi-regional groups rather than any genuinely global one.
Market Impact: Freight is 34% of the delivered til

Weight Distribution Toward The Renovation Channels

Around 58% of tile volume goes into replacement and renovation, and that demand follows housing stock age and discretionary spending rather than building permits, which makes it considerably less volatile than project construction. Producers weighted toward retail, showroom, and trade merchant channels ride construction downturns that remove new build volume entirely. Channel positioning rather than product capability determines that exposure, and it is decided years before any downturn arrives. Renovation demand continues through downturns that remove the other 42% of volume entirely. Retail, showroom, and merchant channels serve it rather than project specification.
Market Impact: Renovation carries 58% of the total

Site Capacity Against Energy Cost Not Demand

Kiln energy carries roughly 29% of production cost and varies enormously by region, so a plant located near its demand but in an expensive energy market carries a permanent disadvantage that no operational improvement can fix. European producers learned this expensively through 2022, when several of their plants closed permanently rather than merely idling. Since freight limits how far output travels anyway, siting decisions must balance energy cost against a delivery radius rather than optimising either alone. Very few producers model energy cost and delivery radius together when choosing a location.
Market Impact: Kiln energy carries 29% of the prod

Build Fabrication Capability For The Slab Contest

Large format slabs compete against natural stone and engineered quartz rather than against tile, and winning that contest requires fabrication, edge finishing, and installer training that conventional tile distribution never developed. Producers shipping slabs into a tile distribution network are competing in a stone market without the capability that market requires. The premium at roughly 3.2 times standard tile pricing only holds where the whole delivery chain supports it properly. Kitchen and bathroom specialists rather than tile merchants make these purchasing decisions entirely. Quartz suppliers already hold the channel capability that tile producers must build.
Market Impact: Slabs command 3.2 times the standar

Who Controls the Margin Pool

Concentration is 9% across the top five measured on square metres produced, the lowest of any major construction material, and freight economics rather than any commercial failure explain it entirely. A heavy, fragile, low-value product cannot travel far enough for scale to matter across borders, so consolidation delivers regional density rather than global position. Two decades of predicted consolidation have produced multi-regional groups rather than genuinely global ones.
Competitive activity runs on three fronts. Energy cost position is the first and most decisive, since it determines who can produce at all rather than who earns more. Large format capability is the second, which is the only segment where freight permits international competition. And design and digital printing capability is the third, where Italian and Spanish producers hold advantages that travel with the product.

Pressure comes from two directions. Indian producers have taken export share into markets European capacity previously served. And engineered quartz and solid surface makers compete directly for the slab applications that carry the best margin. Both pressures attack positions that production scale alone was never going to defend. Slab capability is where differentiation now sits.

Rankings shift on plant closures rather than on commercial wins.
ceramic-tiles-market-company-positioning-matrix-1787302685141

Competitive Moat and Risk Dimensions

MOHAWK INDUSTRIES

Moat: Multi-regional production footprint

Owning production capacity in several regions rather than exporting from one addresses the freight constraint directly, since each plant serves a delivery radius the product can actually reach economically. That footprint was assembled through acquisition over decades and cannot be replicated by any exporter. Distribution positions in each region reinforce it considerably.
MOHAWK INDUSTRIES

Risk: Regional energy exposure varies widely

A multi-regional footprint means holding plants in energy markets that move independently, and a European asset became uneconomic through 2022 while equivalent capacity elsewhere did not. Geographic spread diversifies demand exposure and concentrates energy cost risk wherever pricing turns against a specific plant. That risk cannot be hedged across regions.
RAK CERAMICS

Moat: Energy position and export range

Producing in a region with favourable energy cost while sitting within freight range of Gulf, African, South Asian, and European markets gives an unusual combination in an industry where both variables normally constrain each other. Kiln energy at roughly 29% of production cost makes that position genuinely valuable rather than marginal. Few producers hold both advantages simultaneously.
RAK CERAMICS

Risk: Competition from Indian export volume

Indian producers in the Morbi cluster hold energy and labour cost positions that reach many of the same freight-viable markets, and their export volume has grown substantially. Cost advantage that depends on regional energy pricing erodes when a competitor holds a better one. Overlapping delivery radii turn two regional advantages into direct competition.

Players Tracked

Prominent Players

Mohawk Industries
Grupo Lamosa
RAK Ceramics
Kajaria Ceramics
SCG Ceramics

Other Key Players

Iris Ceramica Group
Panariagroup
Casalgrande Padana
Pamesa Ceramica
Grupo Halcon
Somany Ceramics
Nitco
Guangdong Dongpeng
Marco Polo Ceramics
New Pearl Group
Cersanit
Vitra Karo
Kale Group
Portobello
Eliane Revestimentos

Recent Developments

JANUARY 2025

European producer closes volume line and retains slab capacity

An Italian tile manufacturer permanently closed a standard floor tile production line while retaining and upgrading its large format slab capacity, citing energy cost against achievable volume pricing. The closure was an internal capital decision rather than any acquisition, joint venture, or capacity arrangement with another producer.
Signal: European capacity is retreating toward the
APRIL 2025

Indian producer expands export capacity into African markets

A Morbi cluster manufacturer expanded production capacity aimed at African and Middle Eastern export markets that sit within economic freight range of Gujarat. The expansion was organic capital expenditure rather than any acquisition, joint venture, or distribution partnership with a regional importer. Output targets volume grades specifically.
Signal: Export ambition follows the freight radius
AUGUST 2025

Tile producer builds slab fabrication network for worktop market

A ceramic tile manufacturer established slab fabrication and edge finishing capability alongside installer training, entering the kitchen worktop market where porcelain competes against engineered quartz. The investment was organic capability building rather than any acquisition, joint venture, or licensing arrangement with a stone fabricator. Training covered installation methods.
Signal: Slabs sold through tile distribution lose

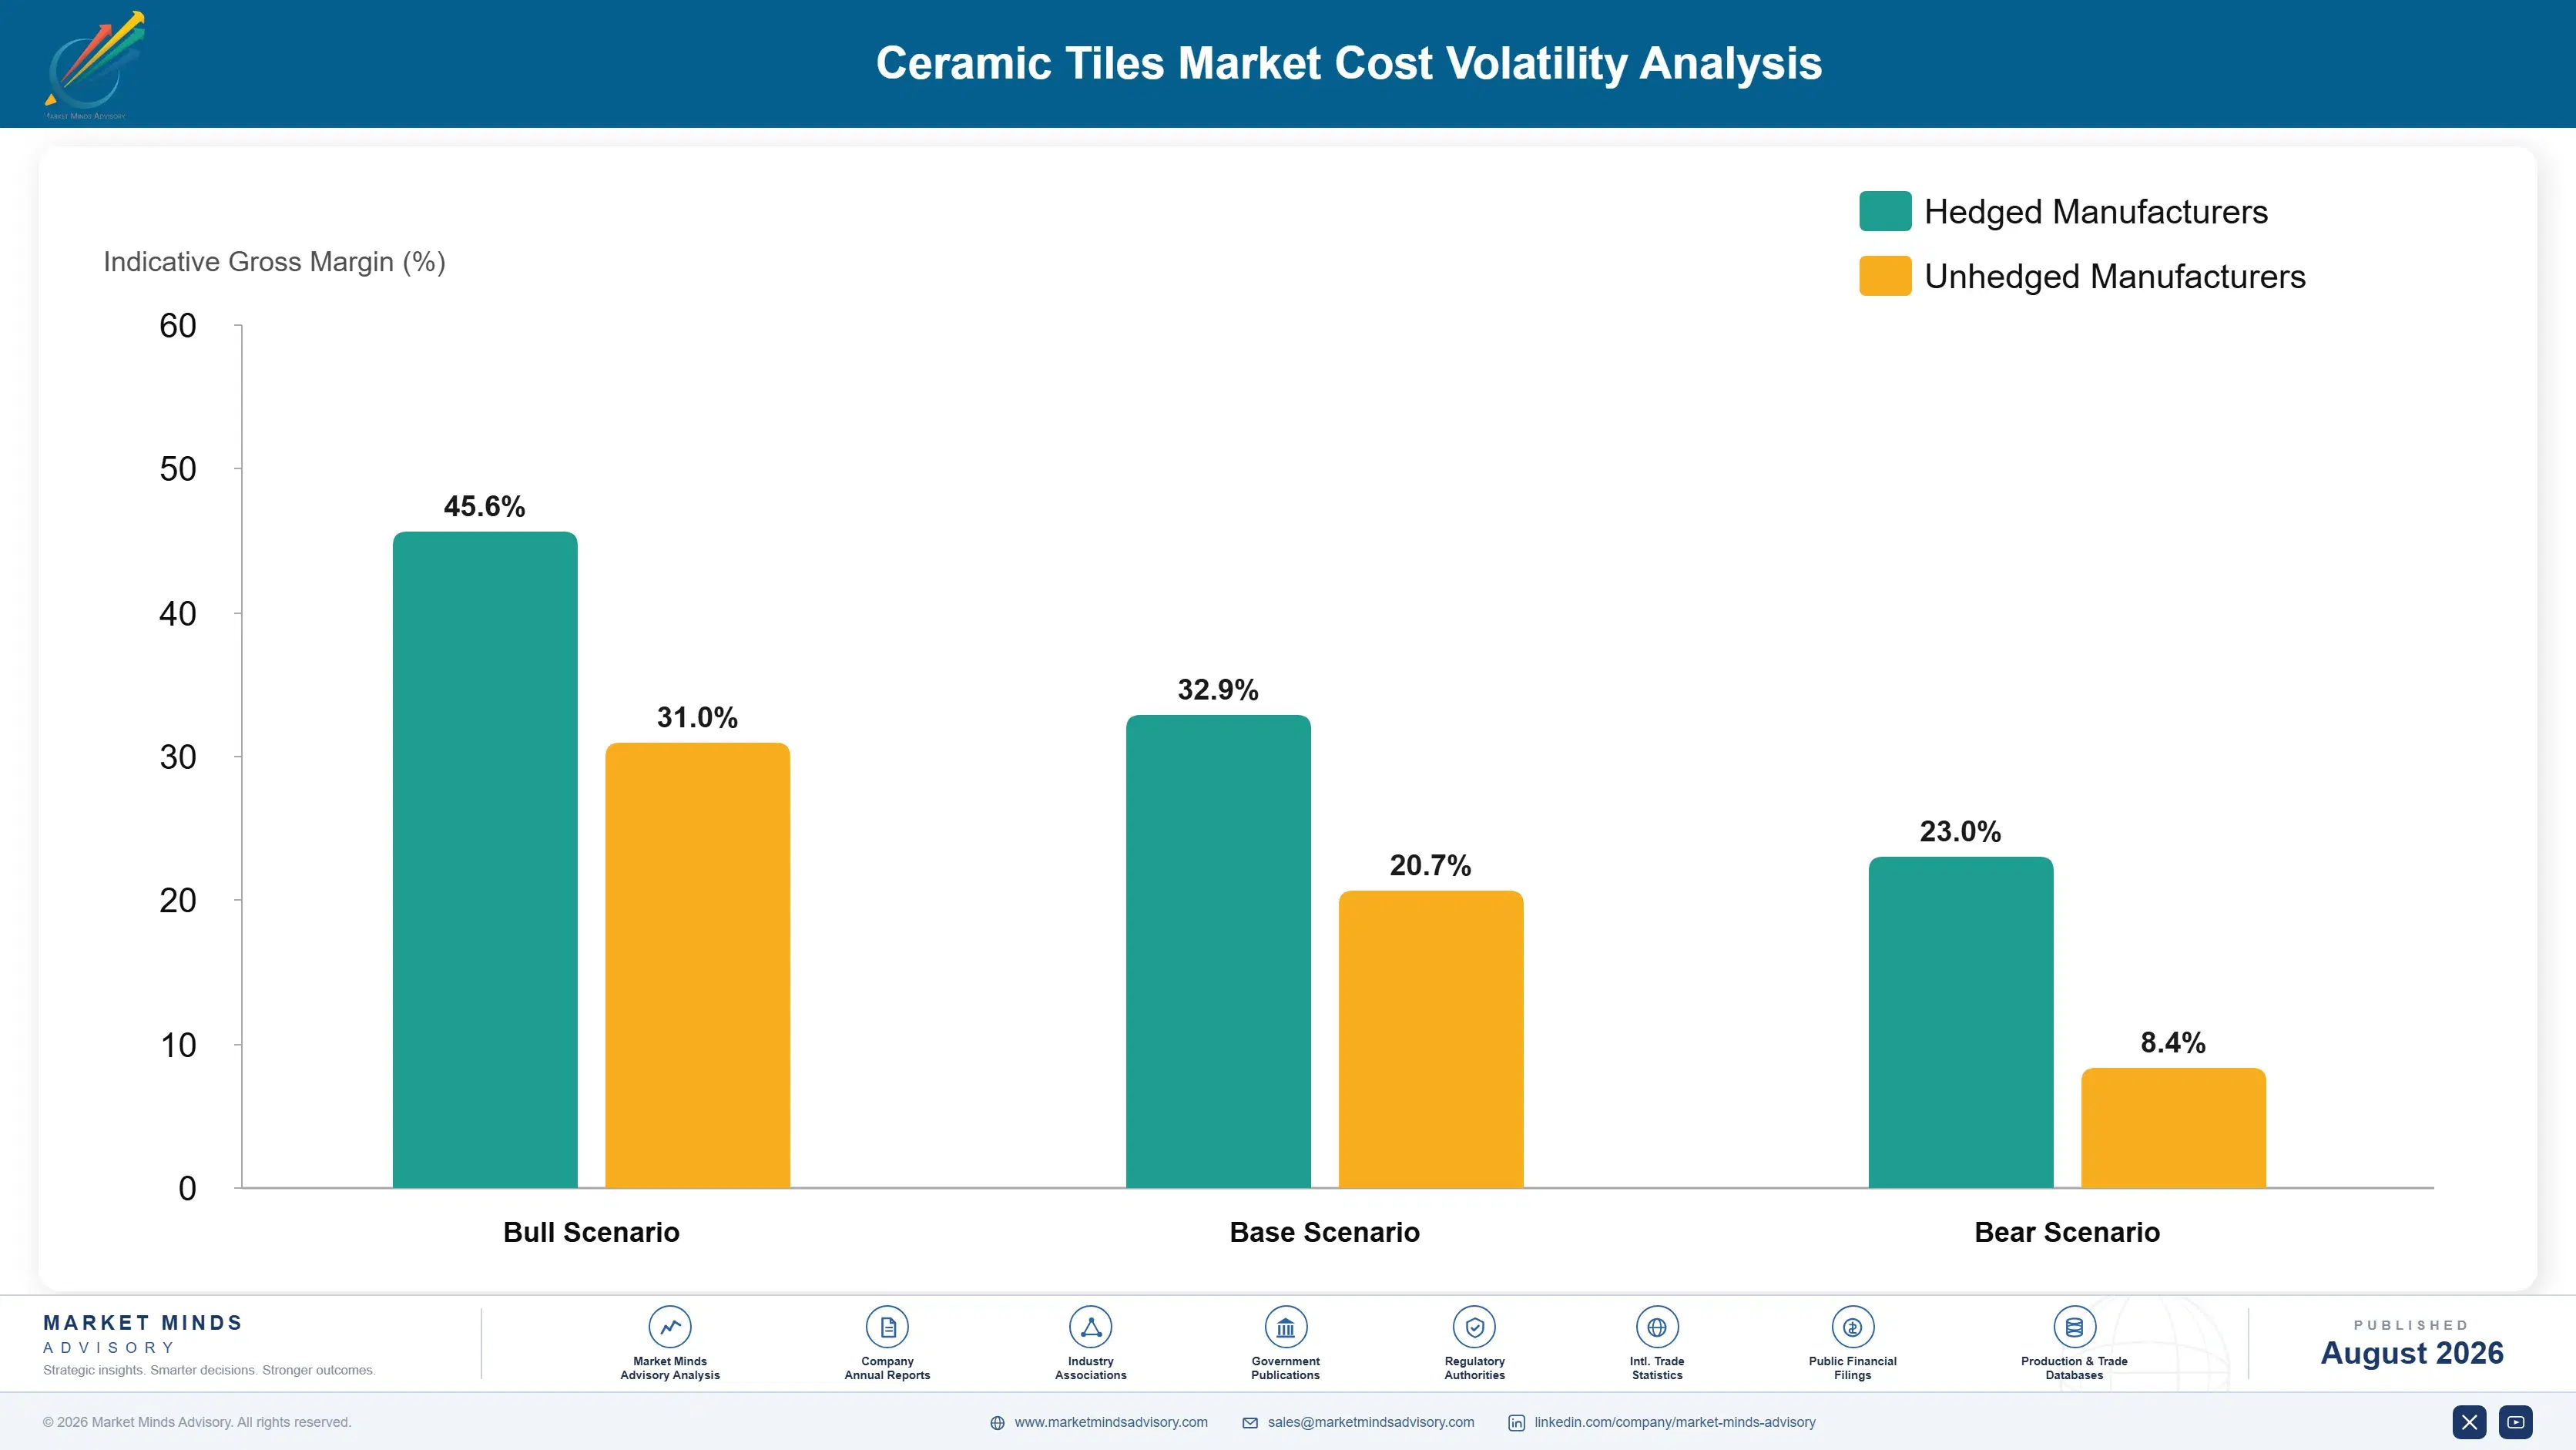
Kiln Gas, Clay Bodies and Glaze

Kiln and dryer energy carries roughly 29% of production cost, clay, feldspar, and body raw materials about 21%, glazes, frits, and digital printing inks near 17%, packaging and internal handling around 8%, and labour, maintenance, and overhead the balance. Energy dominates and is the only input that varies enough between regions to determine whether a plant can operate at all.
European gas pricing through 2022 rose to levels that made tile production uneconomic at achievable prices, and several producers disclosed plant closures, production suspension, and severe margin compression in annual filings covering that year. Body raw material and glaze frit costs rose alongside on their own energy content. Gas pricing has eased from the peak without returning to the level European producers had built their cost structures around.

The competitive disadvantage mechanism runs through regional energy pricing rather than through any input purchasing decision. Clay bodies and glazes are available broadly at comparable cost, while gas prices differ by multiples between regions and cannot be arbitraged because tile itself cannot travel far. A producer in an expensive energy market carries a permanent disadvantage against one that is otherwise identical in every respect.
ceramic-tiles-market-cost-volatility-analysis-1787302685339

Contract energy long-term rather than accepting spot exposure

Kiln energy carries roughly 29% of production cost and gas pricing through 2022 closed plants that had operated profitably for decades on spot arrangements. Long-term contracts at above-spot pricing buy the certainty that decides whether a plant produces at all. Producers who secured supply before the disruption operated through a period that permanently removed competitor capacity.

Recover kiln heat into drying and body preparation

Tile kilns exhaust substantial heat at temperatures well suited to spray drying and body preparation, and producers venting it are purchasing energy they have already generated once. Recovery systems address a meaningful share of the 29% that energy carries. Retrofitting into an existing line is possible and considerably more expensive than designing it into new capacity.

Locate new capacity against energy cost and delivery radius

Freight limits how far tile travels economically and energy determines whether it can be made at all, so siting decisions must satisfy both constraints rather than optimising either alone. A plant near demand in an expensive energy market fails, and one with cheap energy beyond freight range serves nobody. Very few producers model both constraints together when choosing locations.

Portfolio Architecture for Margin Defence

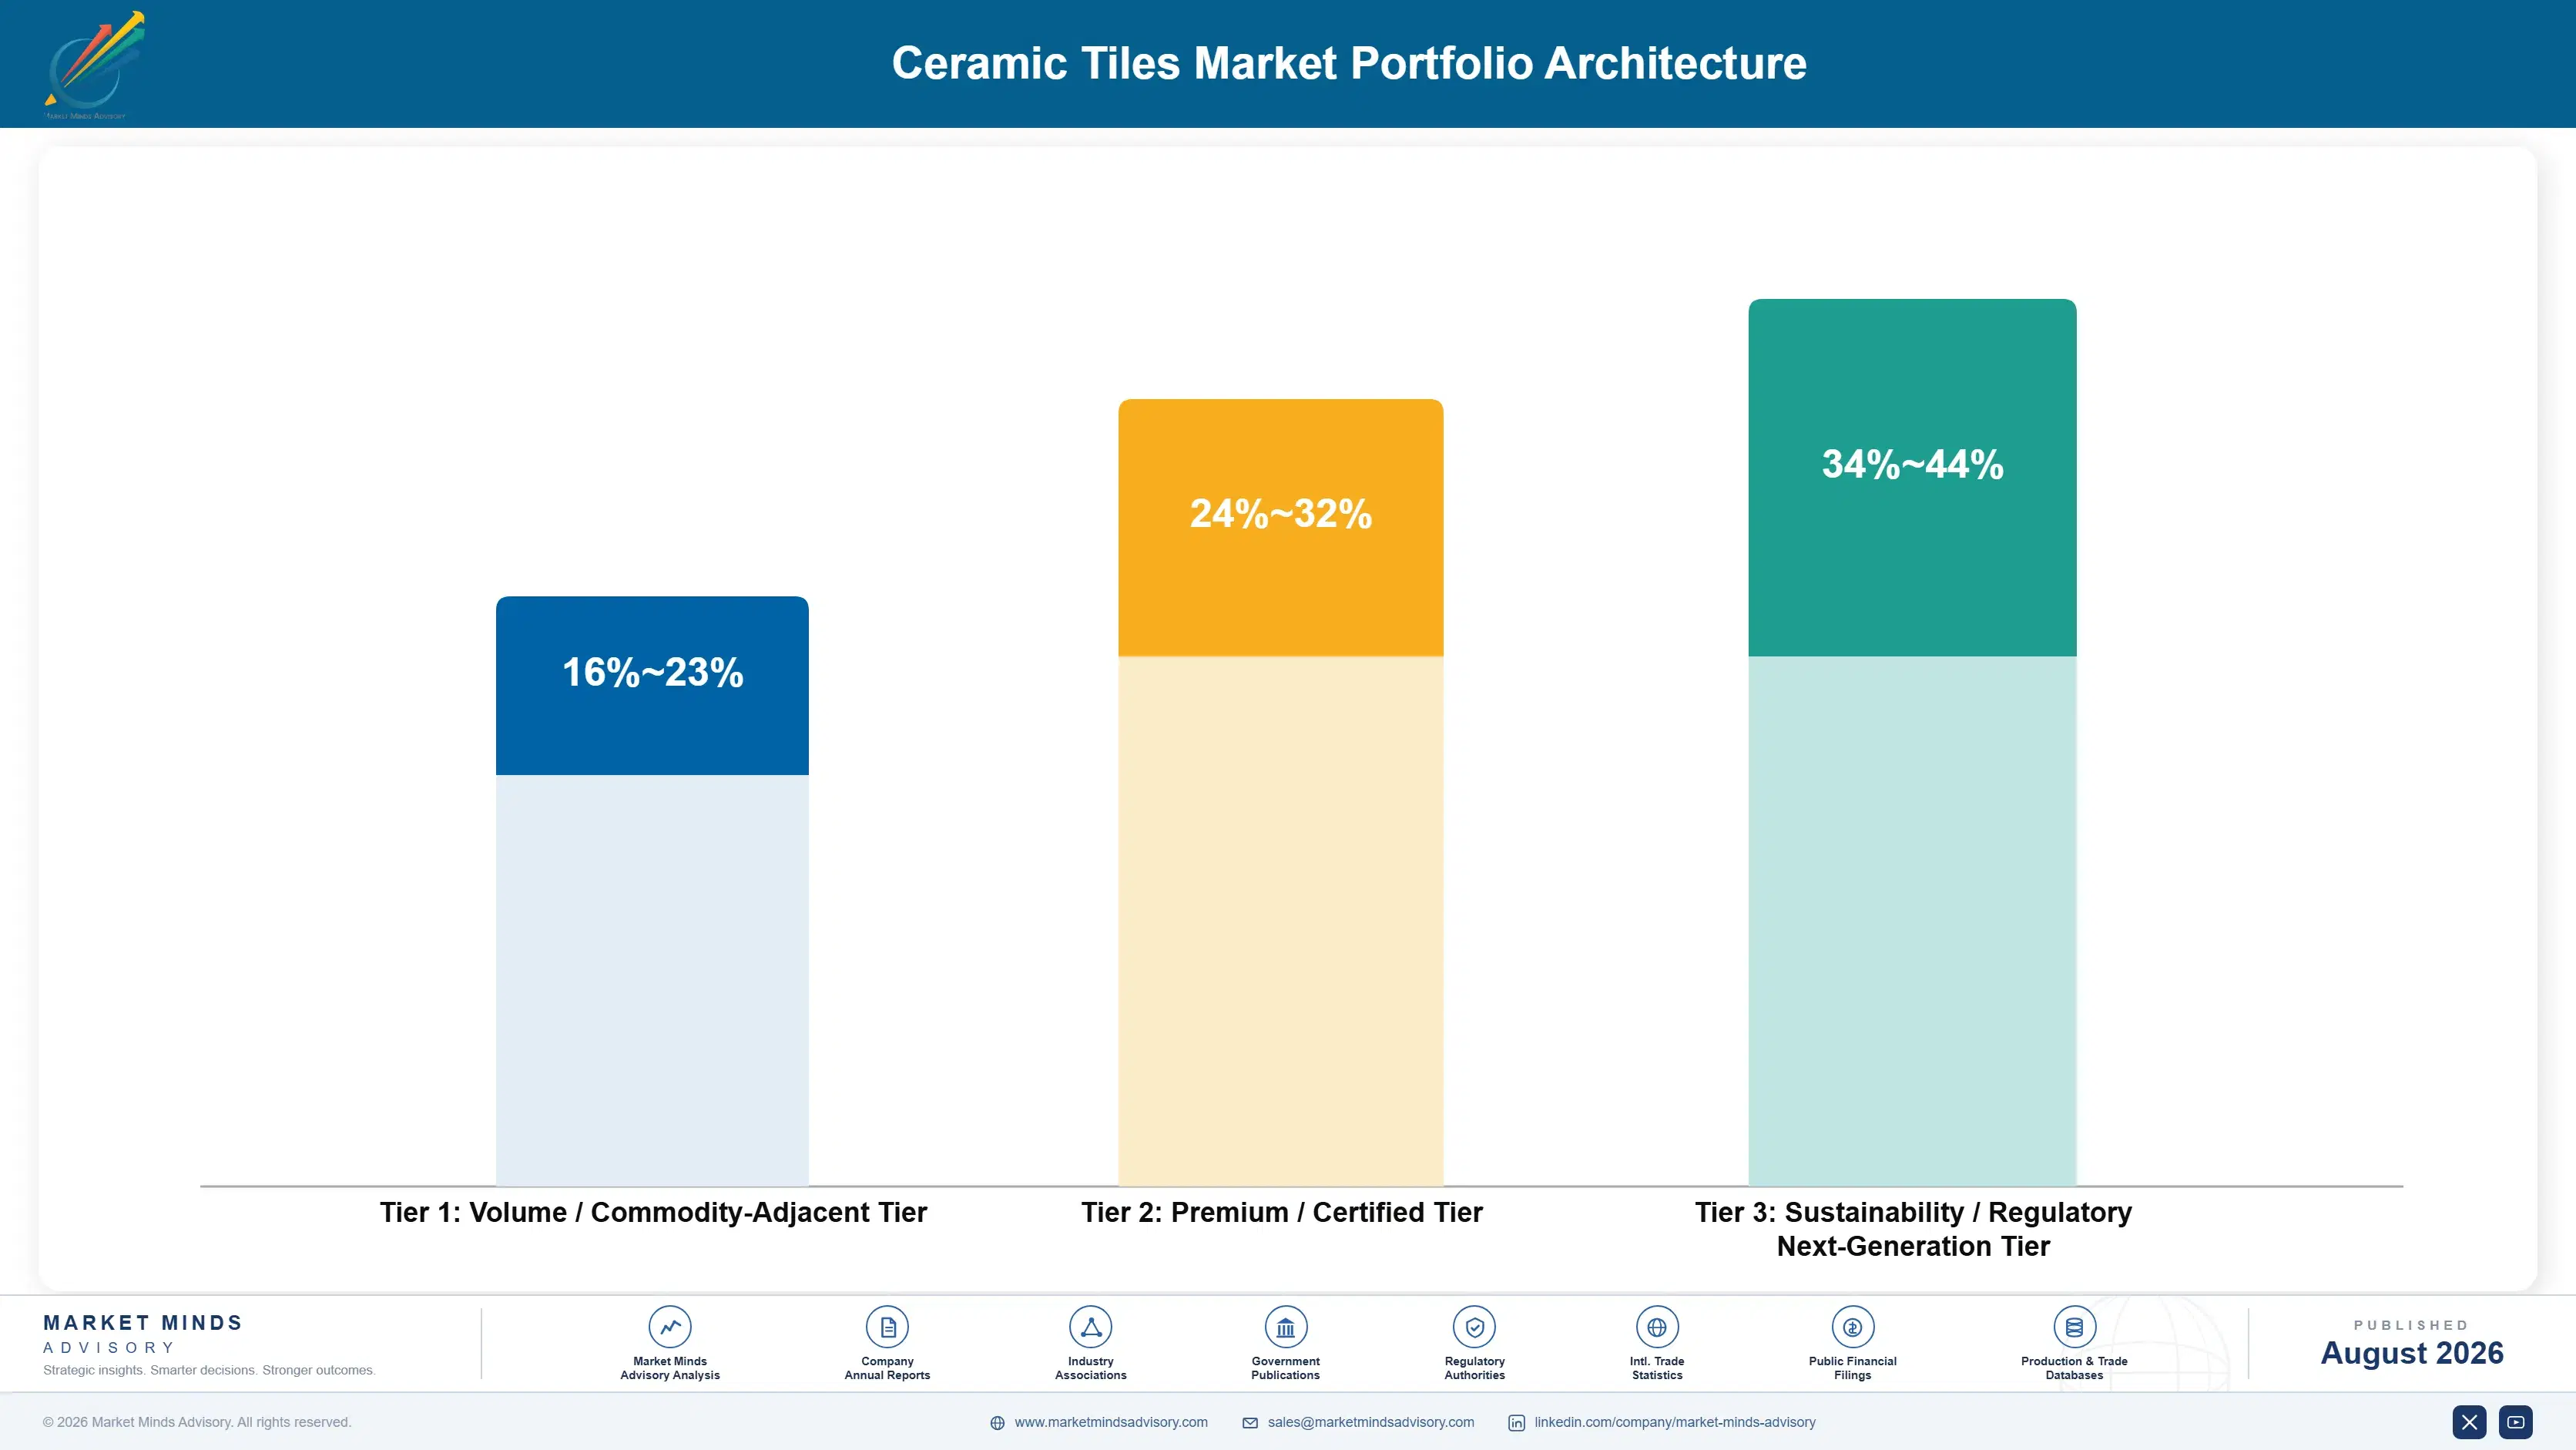
Three tiers describe this business and the spread follows price per square metre rather than technical difficulty. Standard glazed ceramic sits at the bottom, competing on delivered cost within a freight radius where the lowest energy cost producer wins. Porcelain floor tile occupies the middle on durability and appearance. Large format slabs sit at the top, competing against stone rather than tile at roughly 3.2 times standard pricing.
The tension is that volume grades fill the kiln that fixed cost demands while slabs carry the margin and require capability the tile business never developed. A producer weighted to volume competes purely on energy cost within a delivery radius. One weighted to slabs needs fabrication, edge finishing, and installer training, and is competing against quartz suppliers who already have all three.

High-value pools concentrate where the product replaces something more expensive. Kitchen worktops and feature surfaces are the clearest case, since porcelain there is priced against natural stone rather than against any tile at all. Feature walls and commercial interiors pool value similarly, since specification there follows design rather than price. Both pools sit outside the delivered cost contest entirely.

Volume / Commodity-Adjacent Tier

Standard glazed ceramic wall and floor tile competing on delivered cost within a freight radius, where the lowest energy cost producer inside that radius wins. Margin is thin and differentiation is essentially absent throughout the tier.
Gross Margin: 16-23%

Premium / Certified Tier

Porcelain floor tile taking share from glazed ceramic on durability, water absorption, and digital printing appearance range. Higher firing temperature sharpens the regional energy disadvantage, and freight still confines competition regionally.
Gross Margin: 24-32%

Sustainability / Regulatory / Next-Generation Tier

Large format porcelain slabs at roughly 3.2 times standard pricing, competing against natural stone and engineered quartz rather than tile. Best margin by a clear distance, and the only format where freight permits genuinely international competition.
Gross Margin: 34-44%
ceramic-tiles-market-portfolio-architecture-1787302685836

Radii, Renovation and Specification

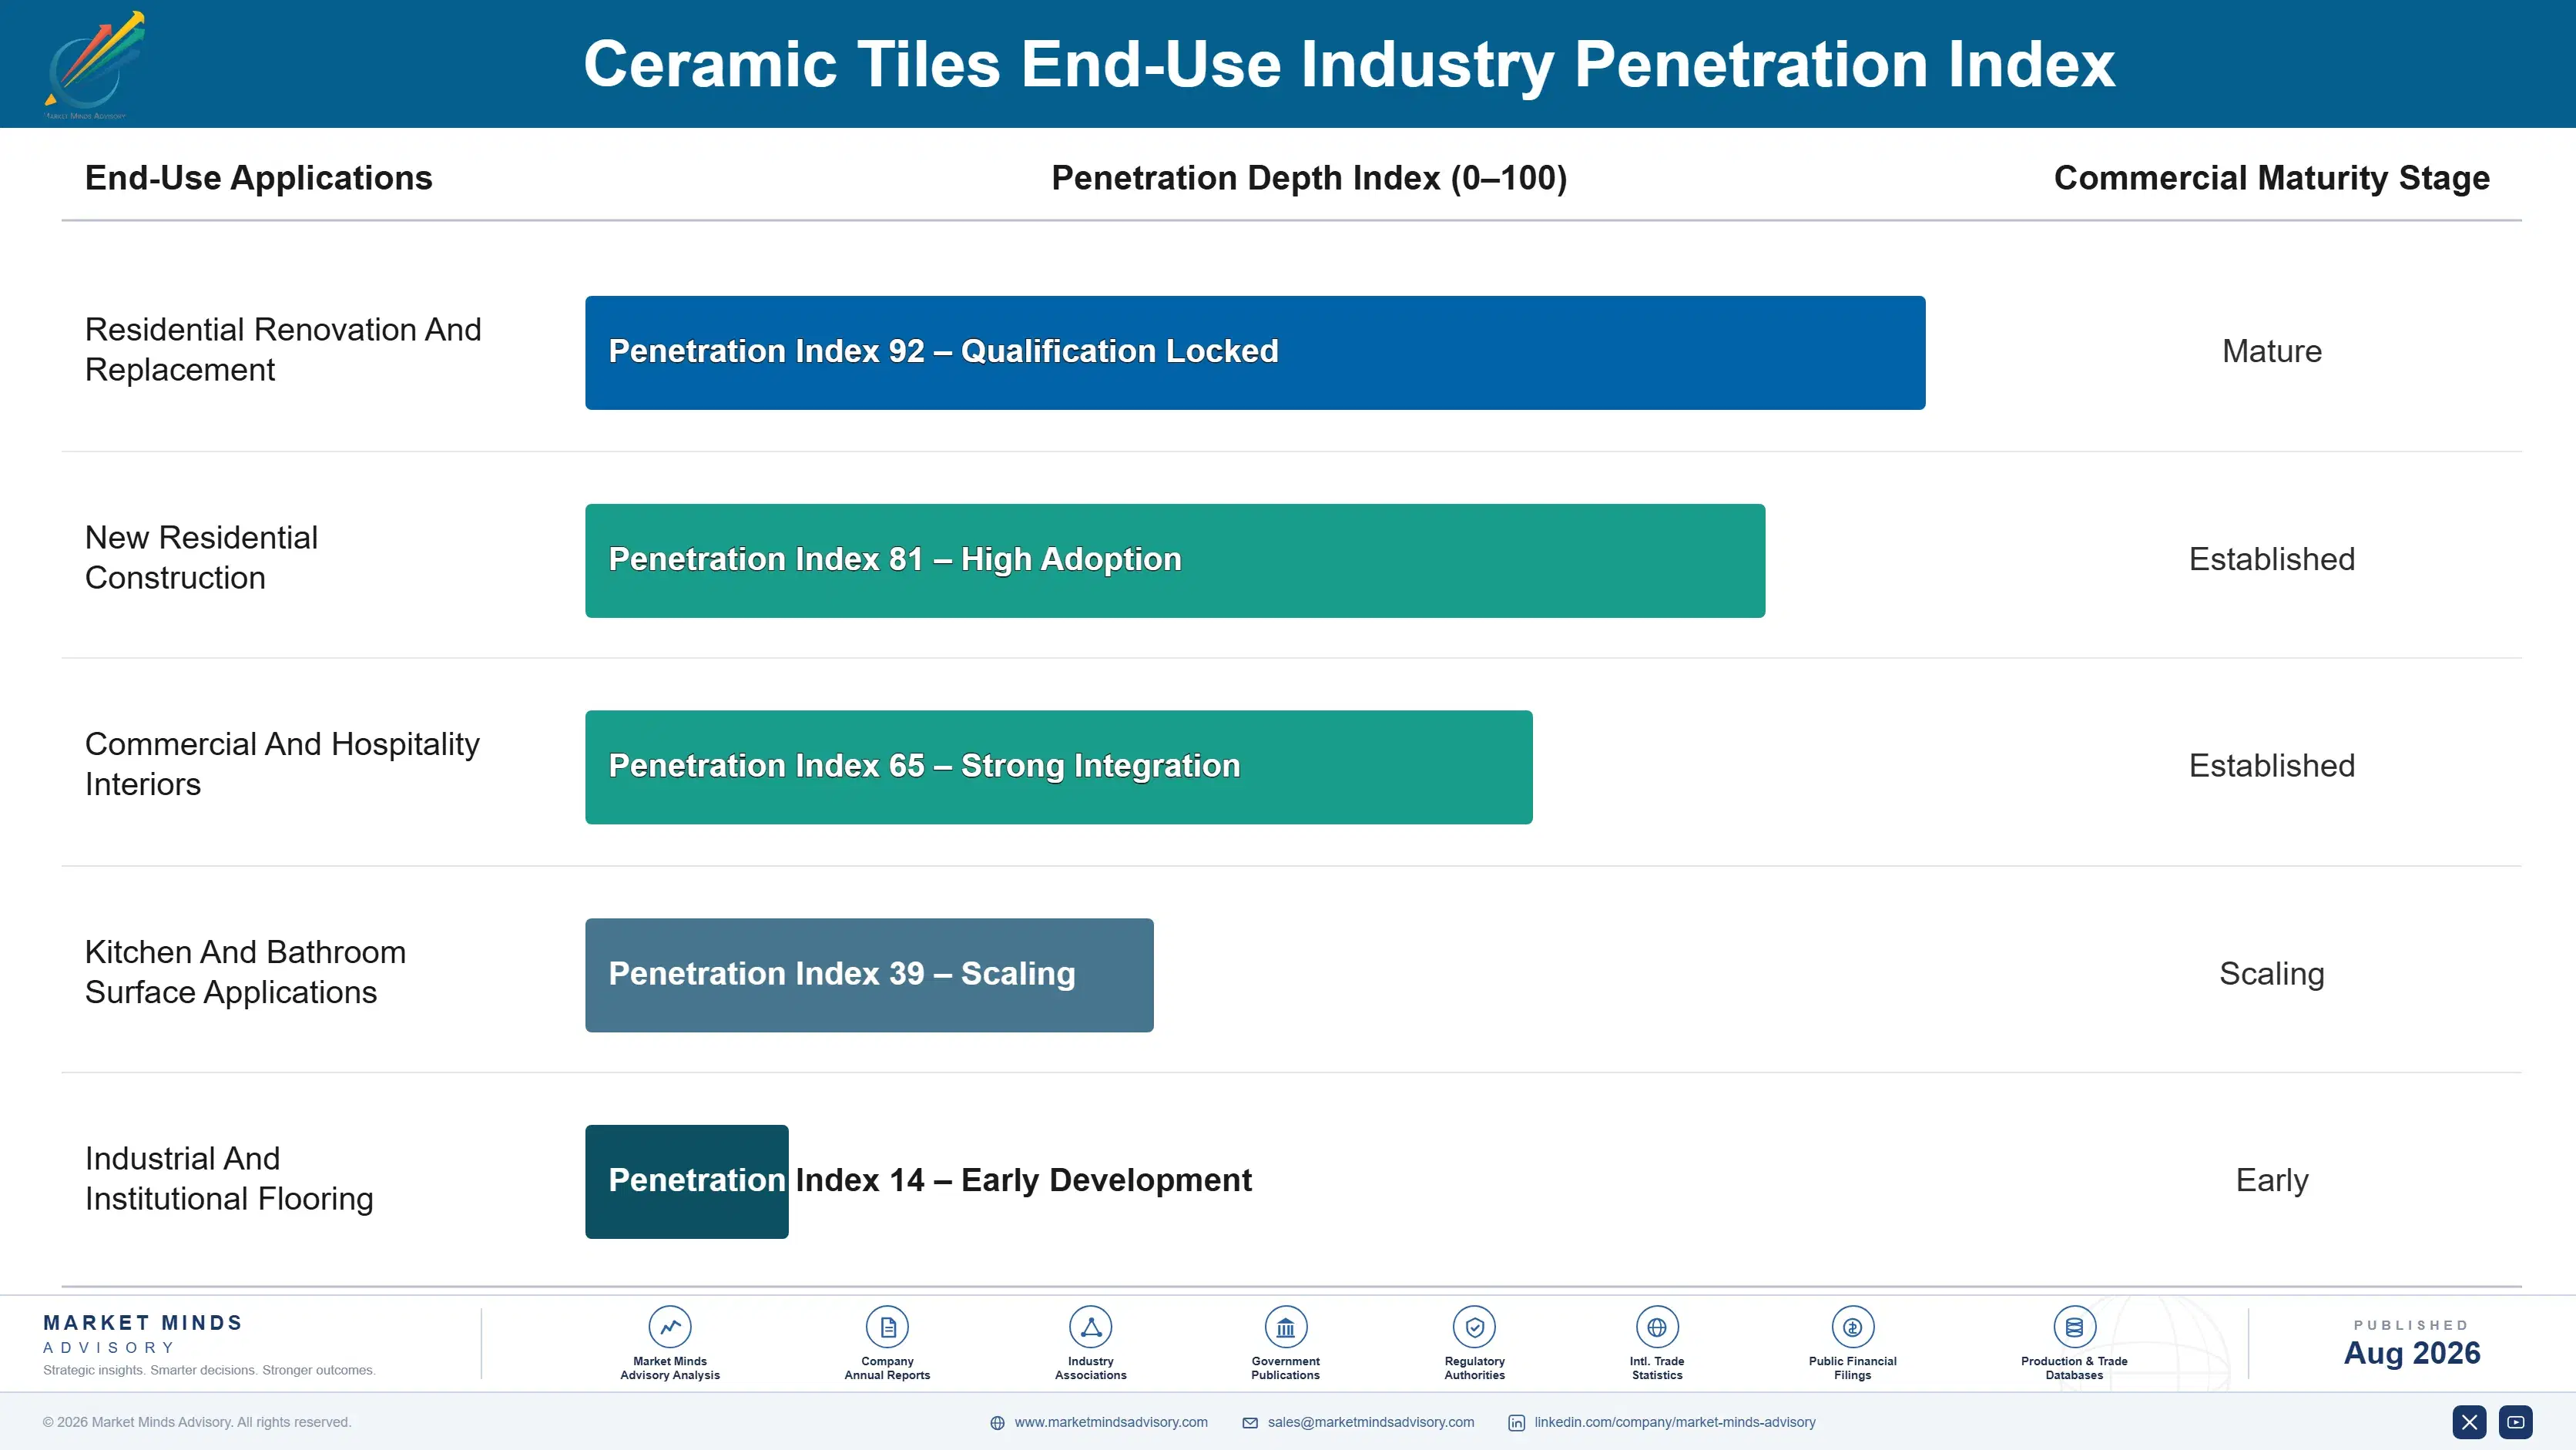
Demand reaches producers through three routes that behave quite differently. Trade merchant and retail channels serve renovation, which is around 58% of volume and follows housing stock rather than construction cycles. Project specification through architects and contractors serves new build and is considerably more volatile. Slab distribution runs through fabricators and worktop specialists, which is a channel most tile producers do not historically hold at all.
Stickiness follows the delivery radius as much as any commercial relationship. A merchant buys from producers who can serve them economically, and that set is determined by geography rather than by preference. Within it, relationships and range depth matter considerably. Slab specification sticks through fabricator relationships and installer familiarity rather than through anything a tile producer traditionally controls.

Buyer profiles shifted as large format grew. The earlier buyer was a merchant or contractor comparing tile ranges on price and availability. The slab buyer is frequently a kitchen or bathroom specialist comparing porcelain against quartz and stone, who has never bought tile and evaluates fabrication support before anything else. Those buyers evaluate fabrication support and installer capability before comparing any material price.
ceramic-tiles-market-end-use-penetration-index-1787302686332

What We Would Tell a Board

These are among the four positions where our research anticipates prominent divergence between winners and laggards over the coming forecast period. Each is grounded in the demand model, the regulatory perimeter, and the announced capacity pipeline.
01 / EXPORT FORMAT SELECTION

Only slabs can cross an ocean and pay

Standard tile cannot ship intercontinentally at a profit because freight runs around 34% of delivered cost, and no amount of commercial effort or scale changes that arithmetic in any direction. Large format slabs at roughly 3.2 times the price per square metre carry that same freight comfortably, which is exactly why every genuinely international tile business has been built on them. A producer planning international expansion around volume grades is planning something that the product itself physically will not permit.
02 / CHANNEL WEIGHTING DECISION

Renovation is the half that survives a downturn

Around 58% of all tile volume goes into replacement and renovation work, and that demand follows housing stock age and discretionary spending rather than building permits or contractor order books. It is considerably less volatile than new construction activity, and it continues right through downturns that remove the remaining 42% of demand entirely. Producers weighted toward retail, showroom, and trade merchant channels ride those cycles considerably better, and that channel positioning is decided years before any downturn arrives to test it.
03 / ENERGY SITING DISCIPLINE

Cheap gas beats being close to the customer

Kiln energy carries roughly 29% of production cost and varies enormously by region, so a plant sited near demand in an expensive energy market carries a permanent disadvantage that no operational improvement addresses at all. European producers learned that lesson expensively through 2022, when several plants closed permanently rather than merely idling through the disruption. Since freight limits how far the output can travel anyway, siting must balance energy cost against a delivery radius rather than optimising either one alone.
04 / SLAB CAPABILITY BUILDING

You are entering a stone market, not a tile one

Large format porcelain competes directly against natural stone and engineered quartz rather than against any other tile product, and winning that particular contest requires fabrication, edge finishing, and installer training that conventional tile distribution has never developed anywhere. Producers shipping slabs into a conventional tile distribution network are competing in a stone market without any of the capability that market genuinely requires. The premium at roughly 3.2 times standard tile pricing holds only where the entire delivery chain properly supports it.

Engagement Snapshot From the Field

A live engagement with an industry participant carrying material or product regulatory and market exposure ahead of a defining policy shift, showing how our research translates into a defensible multi-year portfolio strategy.
MARKET MINDS ADVISORY · CLIENT ENGAGEMENT SUMMARY
Ceramic Tiles Producer Strategic Portfolio Review and Transition Roadmap 2026·Investment Scenario on Ceramic Tiles Exposure Evaluation 2025-26
CLIENT PROFILE
A ceramic tile producer with approximately 420 million dollars in annual revenue (client-reported, unverified by MMA), operating three plants and selling glazed ceramic, porcelain, and a small slab range across domestic and nearby export markets. Volume grades carried most of the revenue, energy cost had risen sharply, and management had proposed an intercontinental export expansion to grow beyond regional demand.
STRATEGIC CHALLENGE
The board questioned whether the proposed export markets could be served profitably given the product being shipped, and wanted an independent view on delivered cost economics before committing to distribution investment in territories the company had never supplied. Delivered cost had never been modelled by format. Channel capability was unassessed.
MMA APPROACH
We modelled delivered cost into each proposed export market by product format, separating freight, duty, and handling from the ex-works price. Energy cost position was benchmarked against producers already serving those markets. Slab capability was assessed against what the stone and worktop channel requires, and renovation channel exposure was analysed across the existing customer base.
KEY FINDINGS
  1. Standard glazed and porcelain grades arrived in every proposed export market above the price local and nearer-range producers were already achieving there.
  2. Slab products carried freight comfortably in the same lanes, and delivered cost sat within competitive range against engineered quartz in each market.
  3. The client held no fabrication, edge finishing, or installer training capability, and its slab range was being sold through tile merchants who could not support it.
  4. Renovation channel exposure was well below comparable producers, leaving revenue more exposed to construction cycles than management had assumed. Cycle exposure was underestimated. Nobody had measured the split.
CLIENT PROFILE
A ceramic tile producer with approximately 420 million dollars in annual revenue (client-reported, unverified by MMA), operating three plants and selling glazed ceramic, porcelain, and a small slab range across domestic and nearby export markets. Volume grades carried most of the revenue, energy cost had risen sharply, and management had proposed an intercontinental export expansion to grow beyond regional demand.
STRATEGIC CHALLENGE
The board questioned whether the proposed export markets could be served profitably given the product being shipped, and wanted an independent view on delivered cost economics before committing to distribution investment in territories the company had never supplied. Delivered cost had never been modelled by format. Channel capability was unassessed.
MMA APPROACH
We modelled delivered cost into each proposed export market by product format, separating freight, duty, and handling from the ex-works price. Energy cost position was benchmarked against producers already serving those markets. Slab capability was assessed against what the stone and worktop channel requires, and renovation channel exposure was analysed across the existing customer base.
KEY FINDINGS
  1. Standard glazed and porcelain grades arrived in every proposed export market above the price local and nearer-range producers were already achieving there.
  2. Slab products carried freight comfortably in the same lanes, and delivered cost sat within competitive range against engineered quartz in each market.
  3. The client held no fabrication, edge finishing, or installer training capability, and its slab range was being sold through tile merchants who could not support it.
  4. Renovation channel exposure was well below comparable producers, leaving revenue more exposed to construction cycles than management had assumed. Cycle exposure was underestimated. Nobody had measured the split.
RECOMMENDED STRATEGY
Phase 1: Phase 1 (months one to nine): abandon the volume grade export plan, redirect the investment toward slab fabrication capability. across all three plants. Phase 2: Phase 2 (months nine to twenty-four): build slab distribution through fabricators and worktop specialists rather than tile merchants. with installer training attached. Phase 3: Phase 3 (months twenty-four to forty-two): expand renovation channel positions and contract kiln energy on long-term terms. across both remaining sites.
OUTCOME
The export plan was abandoned. Slab fabrication capability was funded and the first worktop channel relationships were established within three quarters, while renovation channel share improved and long-term gas contracting was completed for two plants (client-reported, unverified by MMA). Export distribution investment was cancelled entirely. Volume grade capacity stayed regional.

Frequently Asked Questions

Foundational context covering the market sizes, CAGR, scope, country, region and competition that inform every finding below. This section is provided to cover basics and most often pre-purchase conversations, answered from the MMA Primary Research Dataset.

What is the current size of the Ceramic Tiles Market?

The market is valued at USD 78.0 billion in 2025, rising to USD 81.51 billion in 2026. Scope covers fired ceramic tile products for floor, wall, and surface use, not natural stone, vinyl, laminate, or installation systems.

How large will the Ceramic Tiles Market be by 2036?

MMA forecasts USD 126.58 billion by 2036, an increase of USD 45.07 billion over the 2026 base. That represents an expansion multiple of 1.55 times across the forecast period.

What is the CAGR for the Ceramic Tiles Market 2026 to 2036?

The base case CAGR is 4.5%, with a bull case of 5.7% and a bear case of 3.3%. The historical rate from 2020 to 2025 was 3.3%, shaped by energy cost more than construction volume.

Which segment is growing fastest?

Large format porcelain slabs and panels at 6.75%, exactly 1.50 times the market rate. They compete against stone and quartz rather than tile, and command roughly 3.2 times standard pricing.

Who are the major companies in the Ceramic Tiles Market?

Mohawk Industries, Grupo Lamosa, RAK Ceramics, Kajaria Ceramics, and SCG Ceramics lead on square metres produced. The top five hold only 9%, because freight economics keep the industry regional everywhere.

Which country is growing fastest?

India at 6.2%, where the Morbi cluster supplies domestic housing demand and exports across the Middle East, Africa, and Southeast Asia within economic freight range of Gujarat.

Report Segmentation Architecture

The full report scope spans multiple orthogonal segmentation dimensions, with cross-tabulated demand data provided for each dimension pair. Coverage extends further to regional breakdowns, trend trajectories, and the competitive detail needed to support segment-level decision-making.

By Product Format And Competing Surface

  • Glazed Ceramic Wall And Floor Tiles
  • Porcelain Floor Tiles
  • Large Format Porcelain Slabs And Panels
  • Technical And Industrial Ceramic Tiles
  • Decorative And Artisan Tile Production

By End-Use Industry

  • Residential Renovation And Replacement
  • New Residential Construction
  • Commercial And Hospitality Interiors
  • Kitchen And Bathroom Surface Applications
  • Industrial And Institutional Flooring

By Commercial Model

  • Trade Merchant And Builders Distribution
  • Retail And Showroom Channels
  • Architect And Project Specification Supply
  • Slab Fabricator And Worktop Channels
  • Direct Export Within Freight Range

By Region

  • East Asia
  • South Asia and Pacific
  • Western Europe
  • Latin America
  • Middle East and Africa
  • North America
  • Eastern Europe

Scope, Methodology, and Coverage

Every figure in this report is reproducible from documented input assumptions. The scope below maps the historical period, the forecast horizon, the segmentation dimensions, and the countries covered, alongside the underlying primary and qualitative methodology.
Historical Period
2020 to 2025
Forecast Period
2026 to 2036
Base Year
2025 (USD billions; MMA Primary Research Dataset, August 2026)
Market Definition
This market comprises fired ceramic tile products manufactured for floor, wall, and surface applications, measured at producer revenue across merchant, retail, specification, and export channels. Coverage spans glazed ceramic wall and floor tiles, porcelain floor tiles, large format porcelain slabs and panels including worktop applications, technical and industrial ceramic tiles, and decorative and artisan tile production. Natural stone slabs and tiles, terrazzo, cast and polished concrete surfaces, vinyl, laminate and engineered wood flooring, engineered quartz and solid surface materials, tile adhesives, grouts, trims and installation systems, sanitaryware and ceramic bathroom fittings, and installation labour fall outside scope.
Quantitative Units
USD billions (current prices); square metres produced and consumed annually; average price per square metre by format; renovation against new construction split
Segmentation Dimensions
By Product Format And Competing Surface; By End-Use Industry; By Commercial Model; By Region
Regions Covered
East Asia, South Asia and Pacific, Western Europe, Latin America, Middle East and Africa, North America, Eastern Europe
Countries Covered
China, Vietnam, Indonesia, India, Bangladesh, Australia, Italy, Spain, Portugal, Germany, France, United Kingdom, Brazil, Mexico, Colombia, Argentina, United Arab Emirates, Saudi Arabia, Egypt, Turkey, Iran, Nigeria, United States, Canada, Poland, and additional markets relevant to this sector
Key Companies Profiled
Mohawk Industries, Grupo Lamosa, RAK Ceramics, Kajaria Ceramics, SCG Ceramics, Iris Ceramica Group, Panariagroup, Casalgrande Padana, Pamesa Ceramica, Grupo Halcon, Somany Ceramics, Nitco, Guangdong Dongpeng, Marco Polo Ceramics, New Pearl Group, Cersanit, Vitra Karo, Kale Group, Portobello, Eliane Revestimentos
Quantitative Methodology
Primary survey, n=3,800 respondents, Q4 2025, six countries; demand-side model with trade association cross-validation
Qualitative Methodology
47 expert interviews, Q4 2025; applied to validate demand model assumptions, identify emerging dynamics, and assess competitive positioning
Report Format
PDF and XLSX data workbook (Word format preview document)
Publisher
Market Minds Advisory
Report Code
MMA-2026-CON-756
Published
August 2026
Contact
sales@marketmindsadvisory.com | www.marketmindsadvisory.com

Purchase the full Ceramic Tiles Market Report (2026 to 2036).

The full report sizes ceramic tiles across five product formats, five end-use segments, five commercial models, and seven regions, with delivered cost modelled by format and shipping lane throughout. Freight economics are analysed against price per square metre, since that single relationship determines which products can travel and which cannot. Regional kiln energy cost positions are compared against production viability. Competitive profiling covers twenty producers on square metres produced, slab channel requirements are assessed against conventional tile distribution capability, and European capacity closures are tracked against export share redistribution.
Delivered cost modelled by product format and shipping lane
Freight economics analysed against price per square metre
Regional kiln energy cost compared against production viability
Slab channel requirements assessed against tile distribution capability
Renovation and new construction demand split quantified by market
European capacity closures tracked against export share redistribution

Built For The People Who Decide

From boardroom strategy to bench-side execution, this report is read cover-to-cover by leaders shaping the next decade of their industry, turning demand scenarios, market dynamics and valuation benchmarks into decisions.
CXOs/ Presidents/ VPs/ Managers
M&A and Corporate Development
Strategy Teams and R&D Heads
Procurement and Product Directors
Regulatory and Compliance Leaders
Investor Relations and Equity Analysts