Market Minds Advisory
Ceramic Coating Market

Ceramic Coating Market: The Part Is Worth Far More Than The Surface

A turbine blade is worth roughly seventy times the coating applied to it, which means a coater is not really selling a surface treatment at all but accepting liability for somebody else's component.

Lead Analyst

Bilal Shaikh

Published

August 2026

Make Smarter Decisions with Customized Research Insights

Request a free sample report and evaluate market opportunities, growth trends, and competitive dynamics relevant to your business needs.

2025 MARKET VALUE$12.5BMarket Size 2025
2036 FORECAST VALUE$26.3BBase Case , 2026 to 2036
CAGR 2026 TO 20367.0 %Bull 8.2% / Bear 5.8%
INCREMENTAL OPPORTUNITY$12.9BNet 10- year value creation
EXPANSION MULTIPLE1.97x2036 value over 2026 base
Strategic Levers
M&A Pipeline
Regional Outlook
Country Rankings
Competitive Intelligence
Segmental Deep-dive
Call-Us : 91 93563 13602

Executive Snapshot and Market Trajectory

The economics of this business run on a ratio rather than a price. A component arriving at a coating line is typically worth around seventy times the coating it will receive, so a coater that scraps one part has destroyed months of revenue in a single shift.
Growth runs at 7.0% and thermal barriers lead it. Thermal barrier coatings grow at 10.5%, exactly 1.50 times the market rate, as gas turbine firing temperatures rise and hydrogen-capable combustion pushes hot section duty further again. East Asia holds 34%, above band, because Chinese, Japanese, and Korean tooling, turbine, and industrial component manufacture concentrate there. Qualification into an engine programme is effectively permanent once won. First pass yield across merchant lines sits near 94%.
Concentration is very low at 32% across the top five measured on coating service revenue, and geography rather than capability explains it. Parts must travel to the coating line and back, which caps a practical radius near 350 kilometres, and roughly 44% of coating happens captively inside manufacturers rather than at merchant coaters at all. What remains merchant is varied, lower volume, and technically harder work. Mixed-batch operations suit it.
Market Definition
This market covers ceramic coating services and the coating materials consumed in applying them, spanning thermal barrier coatings, wear and abrasion resistant coatings, corrosion and oxidation resistant coatings, hard tooling coatings applied by physical and chemical vapour deposition, and decorative and consumer surface coatings. Coating and deposition equipment sold as capital plant, metallic and polymer coatings without a ceramic phase, bulk technical ceramics and components, surface preparation and cleaning services sold independently, and component repair services beyond recoating fall outside scope.
Base Year Value
$12.5B in 2025 (MMA Primary Research Dataset, August 2026)
Forecast Period
2026 to 2036, eleven discrete annual values
CAGR
7.0% base case. Bull 8.2%. Bear 5.8%.
Fastest Growth Segment
Thermal Barrier Coatings: 10.5% CAGR
Fastest Growth Country
India: 9.8% CAGR
Fastest Growth Region
South Asia and Pacific: 9.2% CAGR
Largest Region
East Asia: 34% of 2025 global value
Market Leaders
Oerlikon, Bodycote, Praxair Surface Technologies, IHI Ionbond, Chromalloy. Source: MMA Analysis based on company annual reports.
Primary Survey
n=3,800 procurement and R&D decision-makers, Q4 2025, six countries
Methodology
Demand-side build-up, cross-validated against public data, 47 expert interviews

Ceramic Coating Market Forecast Scenarios

ceramic-coating-market-size-forecast-scenario-1787302677489
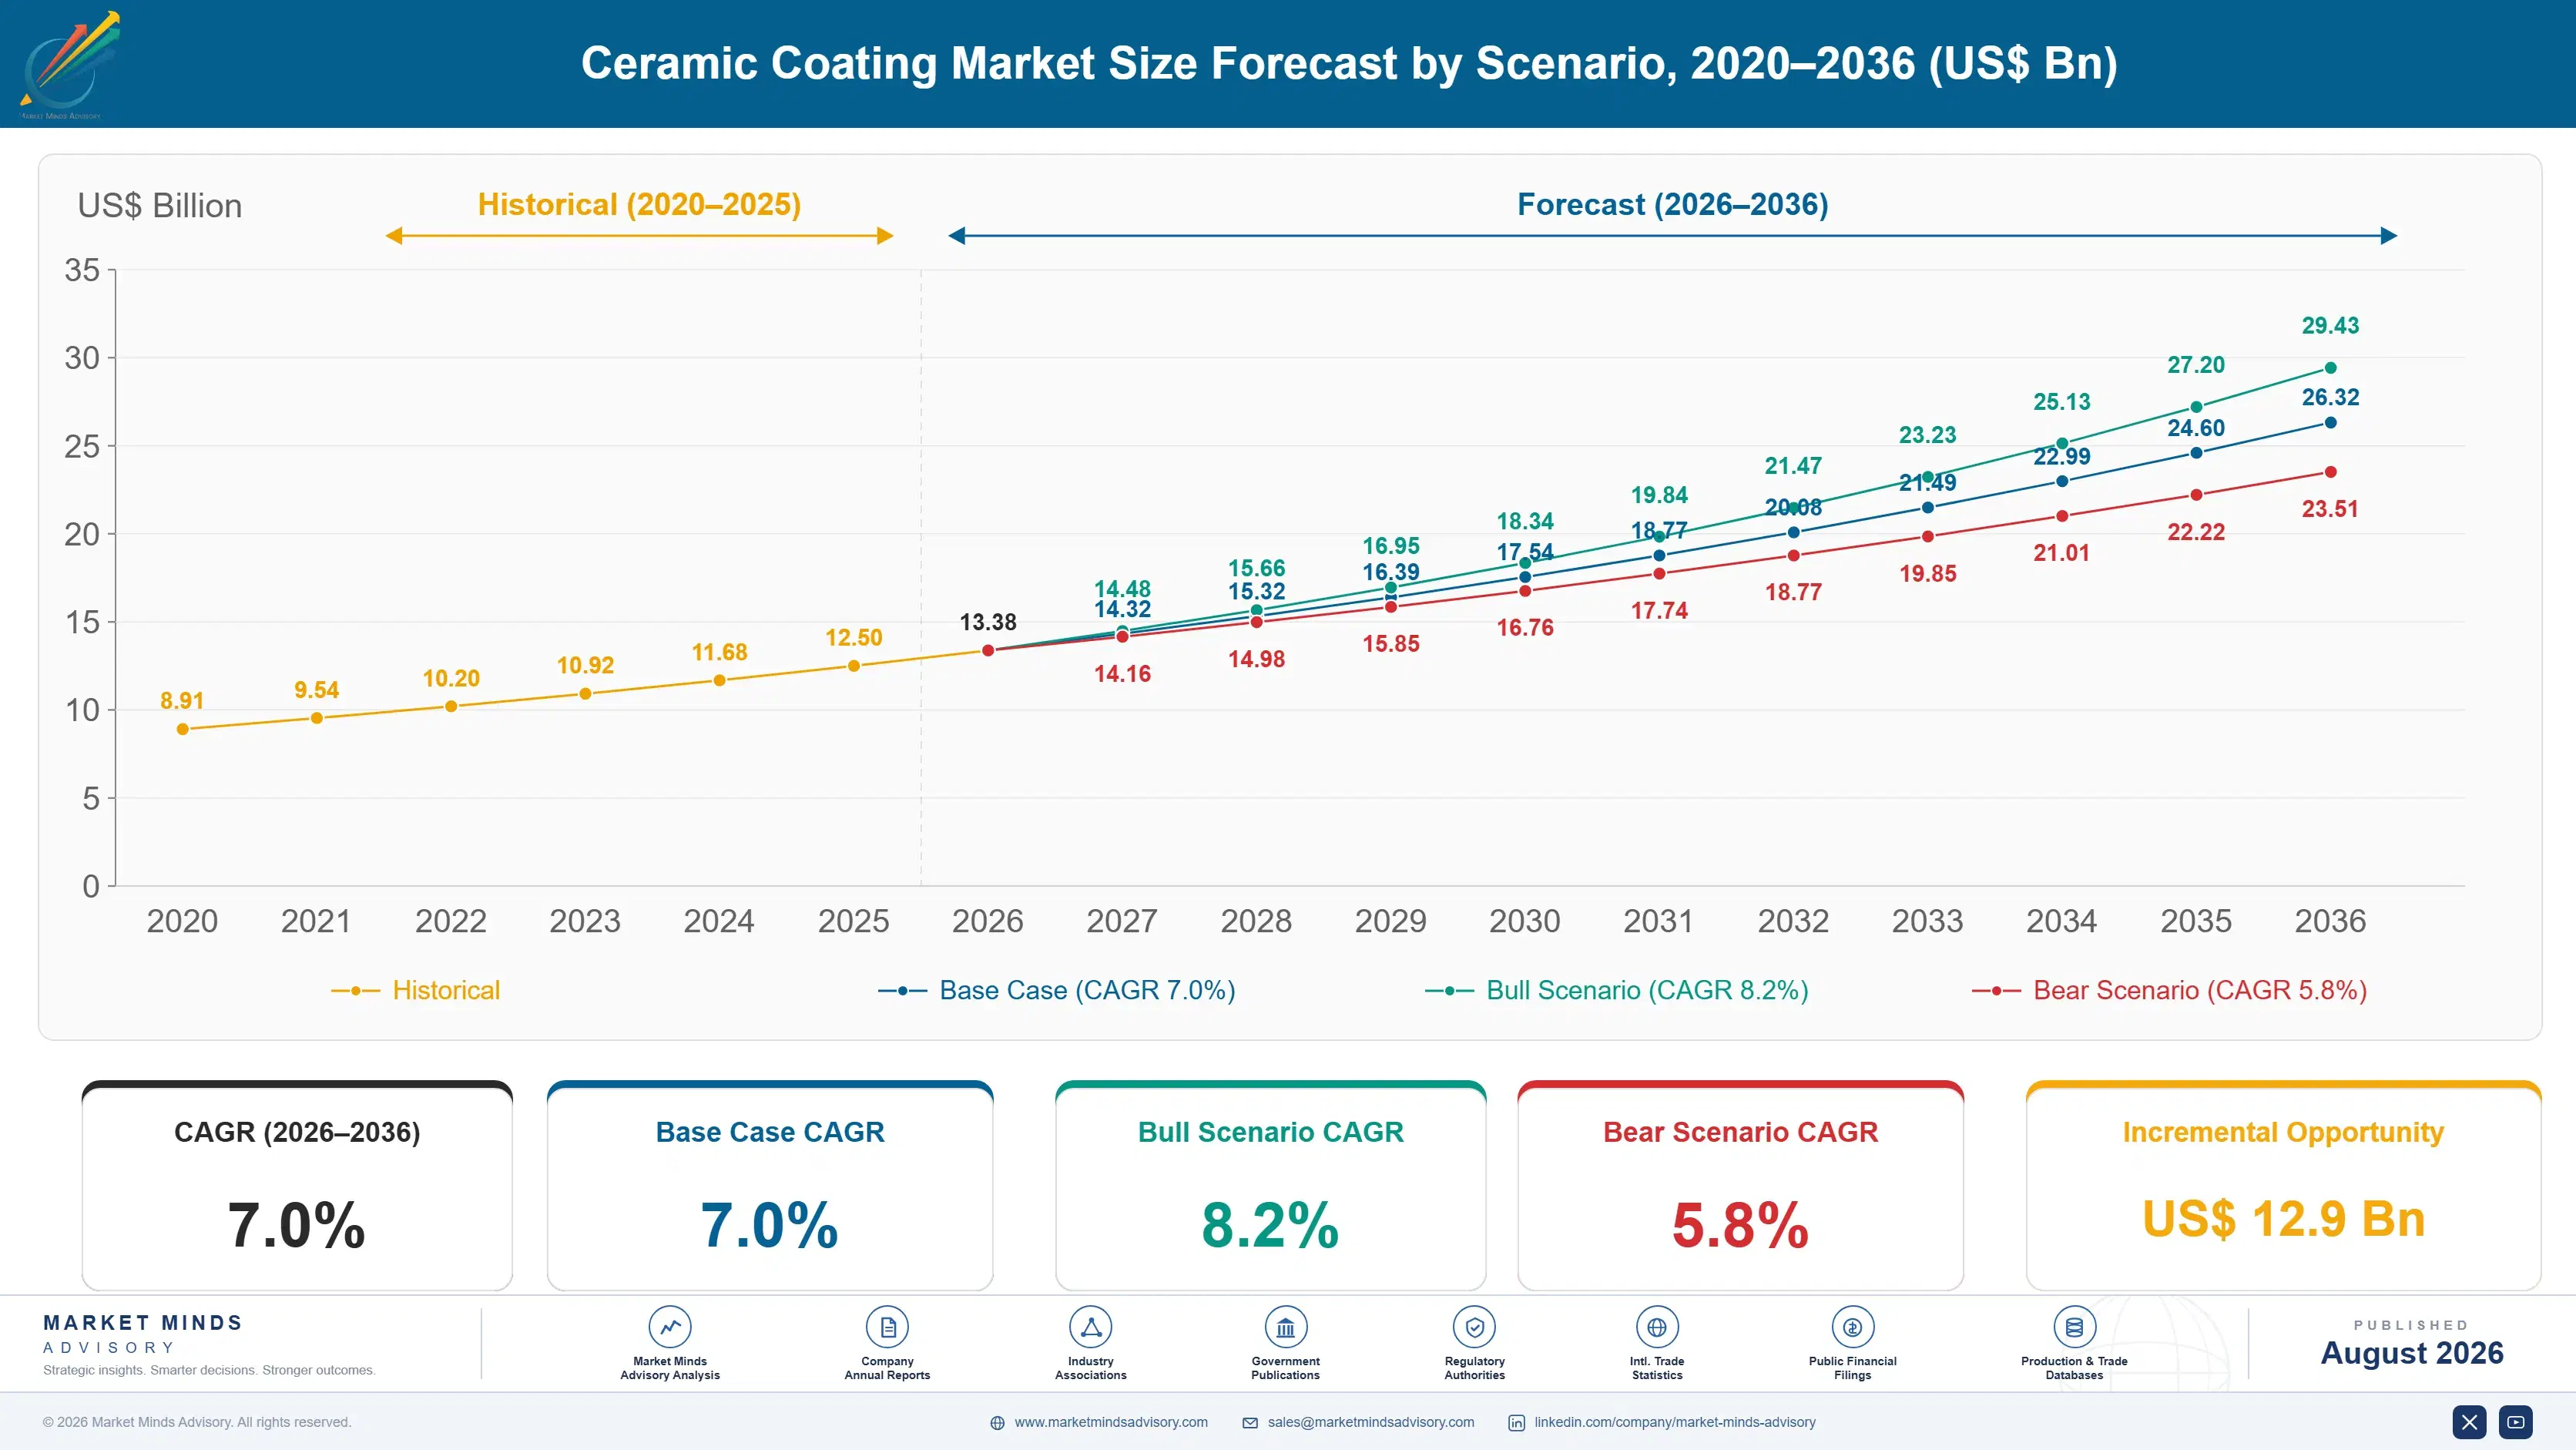
The 2020 to 2025 period ran at 5.9% and aerospace explained most of the shape. Turbine coating volumes collapsed in 2020 as flight hours fell and engine overhauls deferred, then recovered strongly from 2022 as fleets returned to service with maintenance backlogs. Industrial tooling coating held up considerably better throughout, since machining continued across sectors that aviation demand does not touch.
Three mechanisms carry the 7.0% base case. Gas turbine hot section duty is the largest, as firing temperatures rise and hydrogen-capable combustion pushes thermal barrier requirements further. Cutting tool life extension is the second, where hard coatings raise productivity in machining operations facing labour scarcity. And industrial wear applications are the third, growing with process equipment across mining, energy, and chemicals. Decorative and consumer work sits beneath all three, growing slowly and competing purely on price.
The 8.2% bull case rests on hydrogen and high-efficiency turbine programmes moving faster than currently scheduled, which would raise thermal barrier specification across a fleet that already exists. The 5.8% bear case is an aerospace cycle downturn combined with weak machining activity, since those two demand bases together carry most of the coating volume that merchants actually see.

Liability Priced As A Service

Nobody in this market is really buying a coating. A turbine blade, a forging die, or a precision cutting insert arriving at a coating line is worth roughly seventy times the treatment applied to it, and a coater that scraps one has destroyed far more value than the job was worth. Customers therefore select on demonstrated process control and on who carries the liability, not on price per part.
TOP FIVE CONCENTRATION32%Fragmented, since coating is a service applied near the parts
PART VALUE VERSUS COATING70 timesThe component is worth far more than its applied surface
COATING FREIGHT RADIUS350 kmBeyond which shipping parts twice defeats the delivered economics
CAPTIVE COATING SHARE44%Applied in house by manufacturers rather than by merchant coaters
TURBINE COATING SERVICE LIFE24,000 hoursBefore a thermal barrier requires stripping and full recoating again
FIRST PASS YIELD94%Across merchant coating lines, with rework carrying full liability
That has a second consequence most suppliers understate. First pass yield across merchant coating lines sits near 94%, and the remaining six percent is not a cost problem but a customer relationship problem, since a rejected part means a delayed assembly or a grounded engine. Coaters who compete on price and then rework are solving the wrong equation entirely.
Geography does the rest. Parts must travel to the line and back, which caps a practical radius around 350 kilometres and explains concentration at just 32%. Roughly 44% of coating happens captively inside manufacturers who moved their highest volumes in house, which removes exactly the work a merchant coater would most like to have. That residue suits mixed-batch operations rather than anybody replicating captive economics.
"A customer once asked us to shave four percent off a coating price. The part in question was worth about seventy times that coating. Nobody in the room could explain what they thought they were optimising."
Director, Surface Engineering and Industrial Coatings Practice · MMA Chemicals a

Market Trends

Turbine Duty Rises Faster Than Substrate Capability

Gas turbine firing temperatures have risen beyond what nickel superalloys tolerate unaided, and hydrogen-capable combustion raises hot section duty further again because the flame burns hotter and wetter. Thermal barrier coatings grow at 10.5% against 7.0% for the market as a direct result. Coating is doing work that metallurgy cannot, which makes it a design requirement rather than a protective afterthought and changes who specifies it entirely. Service life around 24,000 hours creates a recoating aftermarket that new engine deliveries never would. Qualification into a programme is permanent. Very few coaters hold many of them.
Market Impact: Barriers run about 24,000 hours
Manufacturers Keep Moving Volume Coating In House

Roughly 44% of ceramic coating now happens captively, as manufacturers with sufficient volume install their own lines to control quality, scheduling, and the liability that a scrapped part creates. Integration is most attractive at exactly the volumes merchant coaters rely on for fixed cost absorption. The work that stays merchant is lower volume, more varied, and more technically demanding, which suits some coaters considerably better than others. That residue suits mixed-batch merchant operations far better than it suits any dedicated captive line. Utilisation is the merchant advantage. Few coaters articulate it that way.
Market Impact: Hard coatings grow at 8.4%

Market Opportunities and Growth Drivers

Coating Extends Component Life Against Replacement Cost

A thermal barrier runs around 24,000 hours before stripping and recoating, against a blade set whose replacement cost dwarfs several coating cycles. The same arithmetic holds for forging dies, wear parts, and cutting tools, where coating converts a consumable into a repairable asset. Customers evaluating that comparison rarely negotiate hard on coating price, which is why margins here hold up better than the fragmentation would suggest. Coating converts a consumable into a repairable asset across dies, wear parts, and cutting tools alike. The comparison is rarely close. Price negotiation follows accordingly.
Market Impact: Practical radius caps near 350 km

Machining Labour Scarcity Raises Tool Coating Value

Hard coatings applied by vapour deposition raise cutting speeds and tool life together, which increases output from machining capacity that manufacturers across developed markets struggle to staff. Those coatings grow at 8.4%. The argument has shifted from tool cost saving toward throughput per shift, and that reaches a different buyer inside the customer with a considerably larger budget and far less interest in the price per insert. Manufacturers across developed markets cannot staff machining capacity at any wage they have tried. Output per shift is the metric that matters now. Tool cost per insert is not.
Market Impact: Captive share stands at 44%

Market Restraints and Challenges

Freight Radius Caps Any Coater's Reachable Market

Parts travel to the coating line and back, and the root cause of the constraint is that a component is bulky, valuable, and often on a production schedule that two freight legs will not accommodate. Commercial impact is a practical radius near 350 kilometres and concentration at just 32%. Mitigation runs through distributed regional sites, in-plant coating cells operated at customer facilities, and prioritising high-value parts where freight is a small share of job value. National scale confers very little here while site density inside manufacturing clusters confers a great deal. Most coaters measure the wrong thing.
Market Impact: Thermal barriers grow at 10.5%

Captive Integration Removes The Best Merchant Volume

Manufacturers with sufficient throughput install their own coating lines, and the root cause is that scheduling control and liability matter more to them than the coating price ever did. Commercial impact is that roughly 44% of coating is captive and the integrated share keeps rising at the volumes merchants depend on. Mitigation runs through operating customer-sited cells under service contracts, targeting varied low-volume work, and building capability integration cannot easily replicate. Integration is most attractive at exactly the volumes merchant coaters rely on for fixed cost absorption. That work leaves permanently rather than cyclically.
Market Impact: Captive coating reaches 44% share
3 additional market trends, 4 additional growth drivers, and 2 additional restraints and challenges are covered in the full report. Contact sales@marketmindsadvisory.com to access the complete intelligence.

Segment CAGR and Growth Architecture

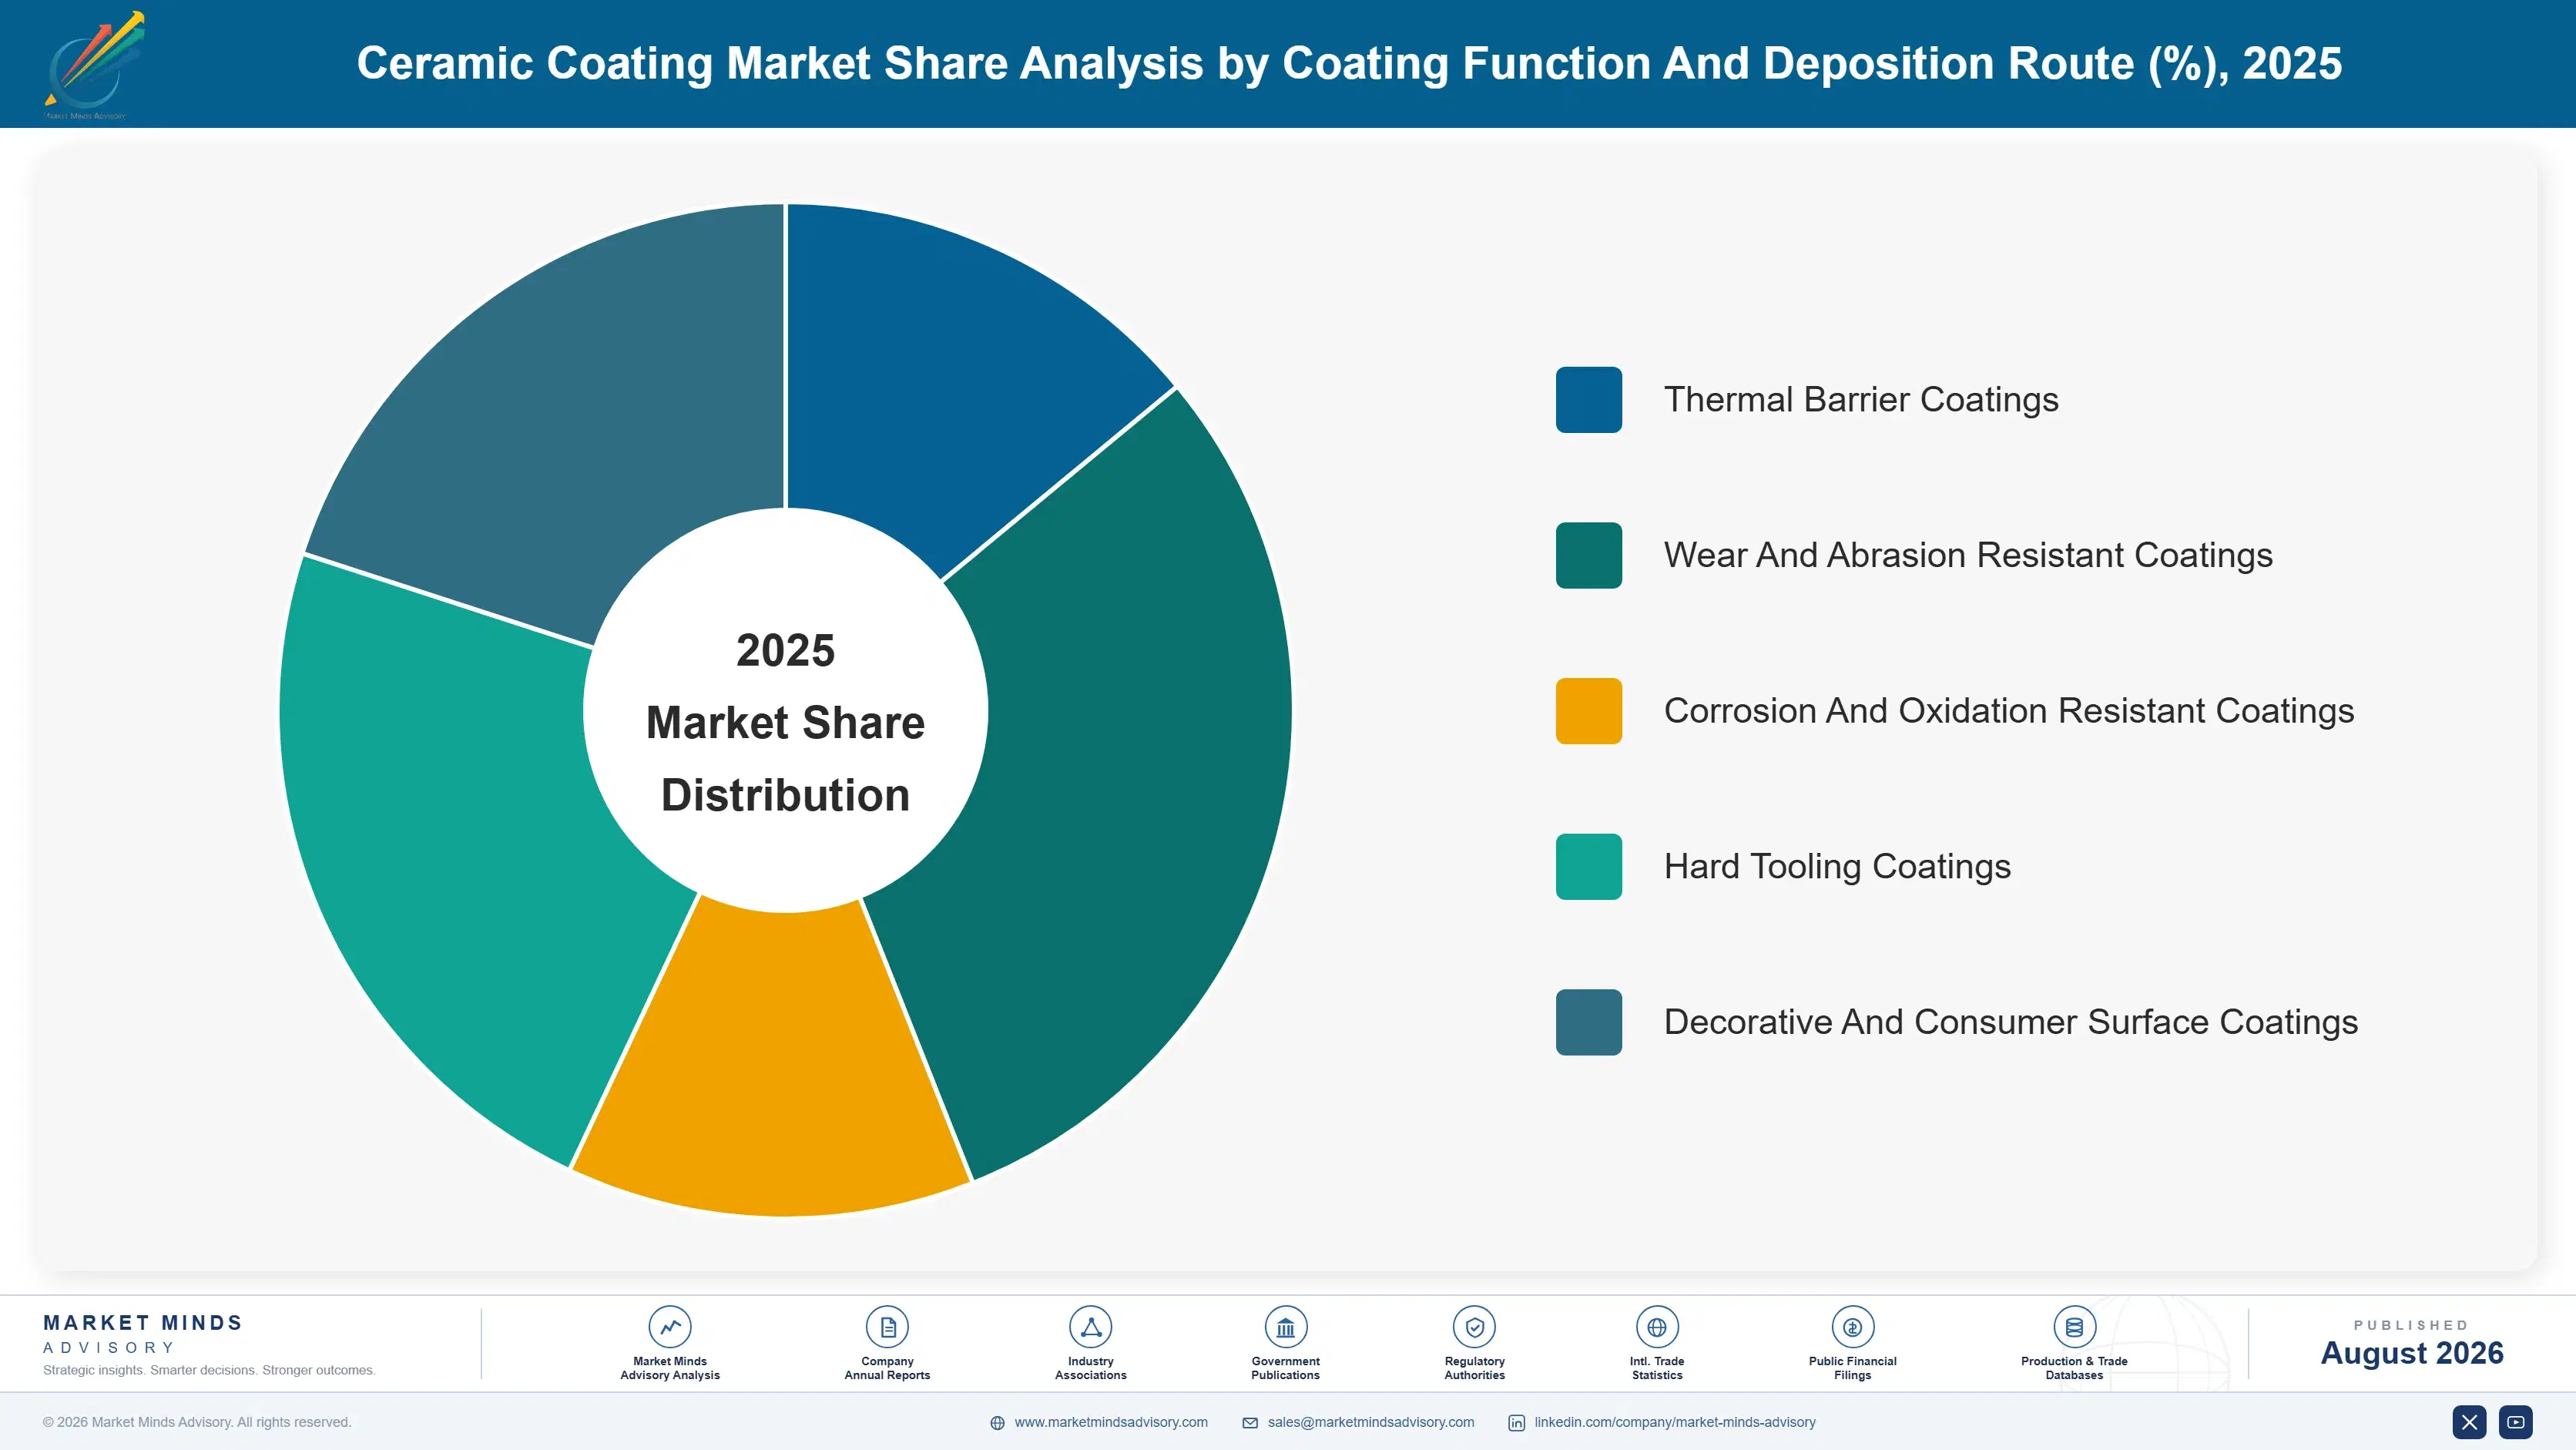
Segmentation follows the coating function and the deposition route serving it, because those determine equipment, process control requirement, qualification pathway, and the value the customer is actually protecting. Substrate material and customer industry both cut across every function rather than separating them, which makes either a weaker primary dimension. Function decides which line applies it. Nothing else does.
ceramic-coating-market-market-share-analysis-1787302678021

Thermal Barrier Coatings

The fastest function at 10.5%, exactly 1.50 times the market rate, applied to gas turbine hot section components by plasma spray and electron beam deposition to let superalloys operate above their own temperature limits. Firing temperature increases and hydrogen-capable combustion both push that requirement further. Service life runs around 24,000 hours before stripping and recoating, which creates a recurring aftermarket that new engine deliveries alone would never support. Qualification into an engine programme is aerospace-grade and effectively permanent, which makes each position unusually durable once won. Hydrogen combustion has already pushed hot section duty beyond what several existing coating systems were validated against. Requalification work is under way across the sector.
CAGR 10.5%

Hard Tooling Coatings

Second fastest at 8.4%, covering titanium nitride, titanium aluminium nitride, and related vapour-deposited films applied to cutting tools, forming dies, and moulds. The commercial argument has moved from tool cost saving toward throughput per machining shift, which reaches a different buyer with a larger budget and far less interest in price per insert. Batch coating economics reward high line utilisation, and coaters running mixed batches for many small customers achieve that considerably more readily than dedicated captive lines inside a single manufacturer do. Turnaround time and relationship matter more here than any qualification does, which makes positions considerably looser than in aerospace. Customers do move this work. Price still rarely decides it alone.
CAGR 8.4%
Full segment breakdown across 5 segments available in the complete report.

Regional Architecture and Country Demand Map

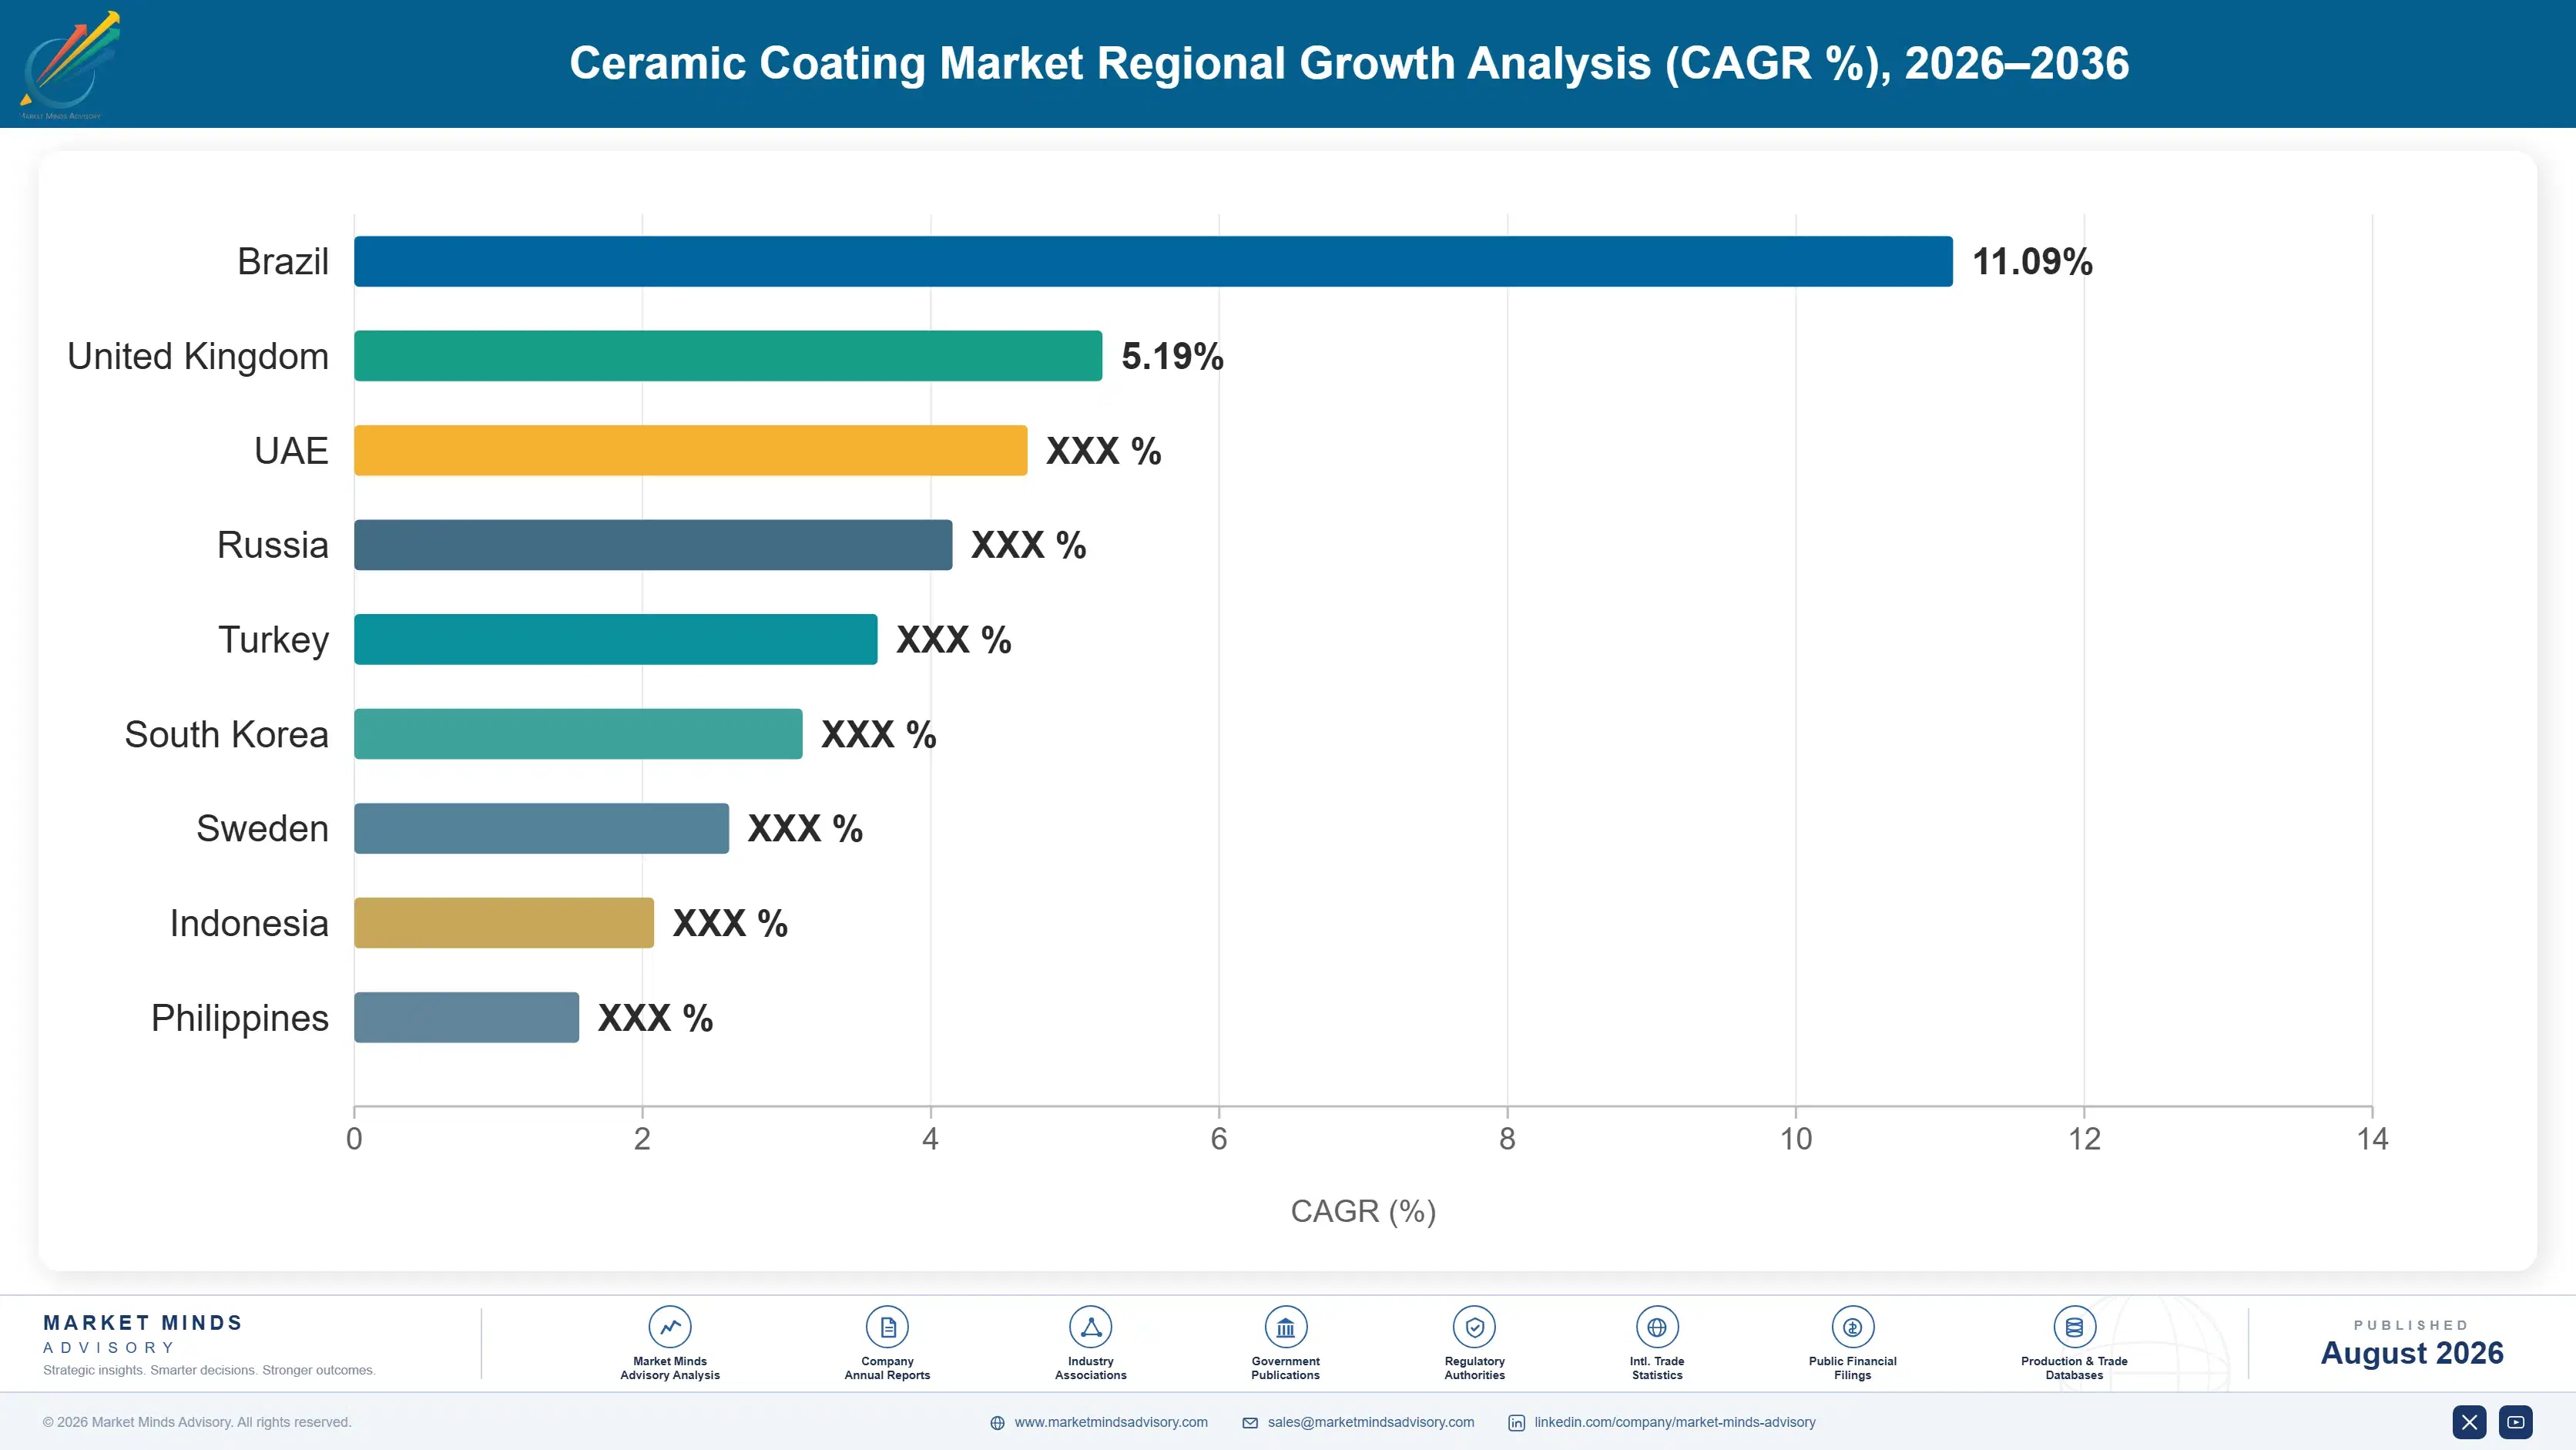
East Asia leads at 34%, above band, because Chinese, Japanese, and Korean tooling, turbine, and component manufacture concentrate there. North America follows on aerospace. India grows fastest. Two regional shares sit outside their framework bands. Manufacturing geography explains both of them. Coating follows the parts everywhere.

East Asia

Thirty-four percent, above the framework band, and justified because Chinese, Japanese, and Korean cutting tool, die, turbine, and industrial component manufacture together represent the largest concentration of coatable parts anywhere. Japanese coaters hold the technically demanding aerospace and semiconductor equipment work while Chinese capacity serves tooling and industrial volumes at prices international coaters do not attempt. Captive integration is further advanced here than elsewhere. Growth at 8.0% runs above the market rate on turbine and tooling demand together. Freight radius logic applies identically here, so Chinese coating capacity clusters around tooling and component manufacturing rather than spreading nationally. Nothing about that is likely to change. Freight decides everything. Clusters set the map.
Share: 34% | CAGR: 8.0% (2026 to 2036)

North America

Twenty-four percent, and aerospace engine and industrial gas turbine work carries a disproportionate share of the value rather than the volume. Thermal barrier coating and repair for engine overhaul is concentrated around a small number of qualified sites, and those qualifications are effectively permanent once won. Oil and gas wear coating adds a second demand base with its own cycle. Growth at 6.6% sits near the market rate, supported by turbine aftermarket work more than by any new manufacturing. Part value at risk is understood better here than in most regions, and procurement decisions increasingly reflect it rather than coating price per part. That shift has been slow and real. Aerospace customers led it.
Share: 24% | CAGR: 6.6% (2026 to 2036)
Regional intelligence for 5 additional markets available in the complete report: Western Europe, South Asia and Pacific, Latin America, Eastern Europe, Middle East and Africa. Contact sales@marketmindsadvisory.com.
ceramic-coating-market-country-cagr-analysis-1787302678537

Liability, Radius And Captive Defence

Parts are worth seventy times their coating, first pass yield sits near 94%, the freight radius caps around 350 kilometres, and captive coating holds 44%. Value comes from selling liability rather than price, from siting inside customer clusters, and from work integration cannot absorb. Coating price decides remarkably little of it. Value at risk decides it.

Price Liability Rather Than Coating Per Part

A component arriving at the line is worth roughly seventy times the coating applied to it, so a customer negotiating four percent off the coating price is optimising something close to nothing. First pass yield near 94% means the real conversation is about the remaining six percent and who carries it. Coaters selling demonstrated process control and clear liability terms rarely discount, and those competing on price per part almost always do. A single scrapped high-value part can exceed a month of that customer's entire coating spend. Most coaters measure cost per part instead.
Market Impact: Parts are worth 70 times the coatin

Site Capacity Inside Customer Manufacturing Clusters

Parts travel to the coating line and back, which caps a practical radius near 350 kilometres and explains concentration at just 32% across the top five. A coater serving distant customers is asking them to accept two freight legs against a production schedule that rarely permits it. Distributed regional sites and in-plant cells operated at customer facilities are the only structures that reach work outside that radius economically. Site density inside clusters therefore determines reachable demand far more than any national coverage claim does. Very few coaters map it properly.
Market Impact: Practical radius caps out near just

Target Work That Captive Lines Cannot Absorb

Roughly 44% of coating is now captive because manufacturers integrated their highest and steadiest volumes, leaving merchants the varied, low-volume, and technically demanding work that a dedicated line cannot fill its schedule with. That residue suits mixed-batch operations far better than it suits anybody trying to replicate captive economics. Coaters chasing the volume that integration takes are competing for exactly the work they are least well placed to win. Mixed-batch scheduling raises line utilisation in a way a dedicated captive line simply cannot match. That is the clearest merchant advantage available. Few coaters state it in a proposal.
Market Impact: Captive coating now holds 44% of th

Build Aerospace And Turbine Qualification Positions

Thermal barrier coatings grow at 10.5% against 7.0% for the market, and qualification into an engine programme is aerospace-grade and effectively permanent once obtained. Service life around 24,000 hours creates a recurring recoating aftermarket that new engine deliveries would never support alone. Those positions take years and considerable capital to reach, and they are the most defensible revenue available anywhere in surface engineering. Service life near 24,000 hours means the recoating aftermarket outlasts several new engine cycles. Nothing else in surface engineering defends as well. Aerospace qualification is audited and slow.
Market Impact: Thermal barriers now grow at 10.5%

Who Controls the Margin Pool

Concentration is very low at 32% across the top five measured on coating service revenue, and geography rather than capability explains almost all of it. A coater serves customers inside a practical freight radius near 350 kilometres, so national scale confers little and site density confers a great deal. The leader to challenger gap is widest in aerospace turbine qualification and narrowest in general industrial wear and tooling work.
Competitive activity runs on three fronts. Qualification depth is the first, particularly in aerospace and power generation where positions are effectively permanent once won. Site density inside manufacturing clusters is the second, since it determines reachable demand more than any capability does. And process control demonstration is the third, because customers are buying protection for parts worth seventy times the job.

Pressure arrives from two directions. Manufacturers keep integrating their highest volumes, taking the steadiest merchant work permanently. And Chinese and Indian coaters serve regional tooling volumes at prices international operators do not attempt. Rankings shift on qualification and site additions rather than on any commercial activity. Neither pressure reaches qualified aerospace and turbine work, where audited process demonstration takes years and customers will not revisit it for price.
ceramic-coating-market-company-positioning-matrix-1787302679056

Competitive Moat and Risk Dimensions

OERLIKON

Moat: Site density and process breadth

Coating sites distributed across manufacturing clusters worldwide reach demand that freight radius otherwise excludes, and breadth across thermal spray and vapour deposition lets one site serve varied customer requirements rather than a single process. Equipment and materials capability alongside the service business reinforces both. Neither position can be assembled quickly by a competitor building from one location.
OERLIKON

Risk: Captive integration taking volume work

Roughly 44% of coating is already captive and manufacturers keep integrating the highest volume work that merchant sites depend on for fixed cost absorption. That volume leaves permanently rather than cyclically. Site density is most valuable serving exactly the customers most likely to integrate as their own throughput grows.
BODYCOTE

Moat: Aerospace qualification and thermal capability

Qualification positions across aerospace engine and airframe programmes are effectively permanent once obtained and take years of audited process demonstration to reach. Combining coating with heat treatment lets a single supplier take scope that would otherwise cross a commercial boundary, which customers value because it removes an interface. Both advantages compound with each programme qualified.
BODYCOTE

Risk: Aerospace cycle concentration exposure

Weighting toward aerospace ties volume to flight hours and overhaul schedules that collapsed entirely through 2020 and 2021 with no offsetting demand elsewhere. Industrial tooling and wear work held up far better across the same period. Depth in the most defensible qualifications also means depth in the most cyclical demand base available.

Players Tracked

Prominent Players

Oerlikon
Bodycote
Praxair Surface Technologies
IHI Ionbond
Chromalloy

Other Key Players

Hoganas
Saint-Gobain
Kennametal
Curtiss-Wright Surface Technologies
APS Materials
Metallisation
Zircotec
Sulzer
CemeCon
Platit
Hauzer Techno Coating
Aremco Products
Element Solutions
Flame Spray Technologies
Nippon Steel

Recent Developments

FEBRUARY 2025

Manufacturer commissions captive coating line for volume parts

A precision component manufacturer installed its own vapour deposition coating capacity for its highest volume tooling, ending merchant purchases of that work while continuing to outsource lower volume and specialised coatings. The move was internal vertical integration rather than any acquisition, dispute, or commercial arrangement change.
Signal: Integration always takes the steadiest mer
MAY 2025

Coater opens in-plant cell at customer facility

A merchant coating group installed and operated a dedicated coating cell inside a customer's manufacturing plant under a long-term service contract, removing both freight legs and the scheduling risk they created. The arrangement was a service contract rather than any joint venture, acquisition, or equipment sale to the customer.
Signal: In-plant cells are the answer to a freight
SEPTEMBER 2025

Coater qualifies thermal barrier for hydrogen turbine programme

A surface engineering company completed qualification of a thermal barrier coating system for a hydrogen-capable gas turbine programme, where hotter and wetter combustion exceeded what existing coating systems had been validated against. The qualification was a technical development outcome rather than any commercial or partnership arrangement.
Signal: Hydrogen combustion is now pushing hot sec

Powders, Targets and Process Power

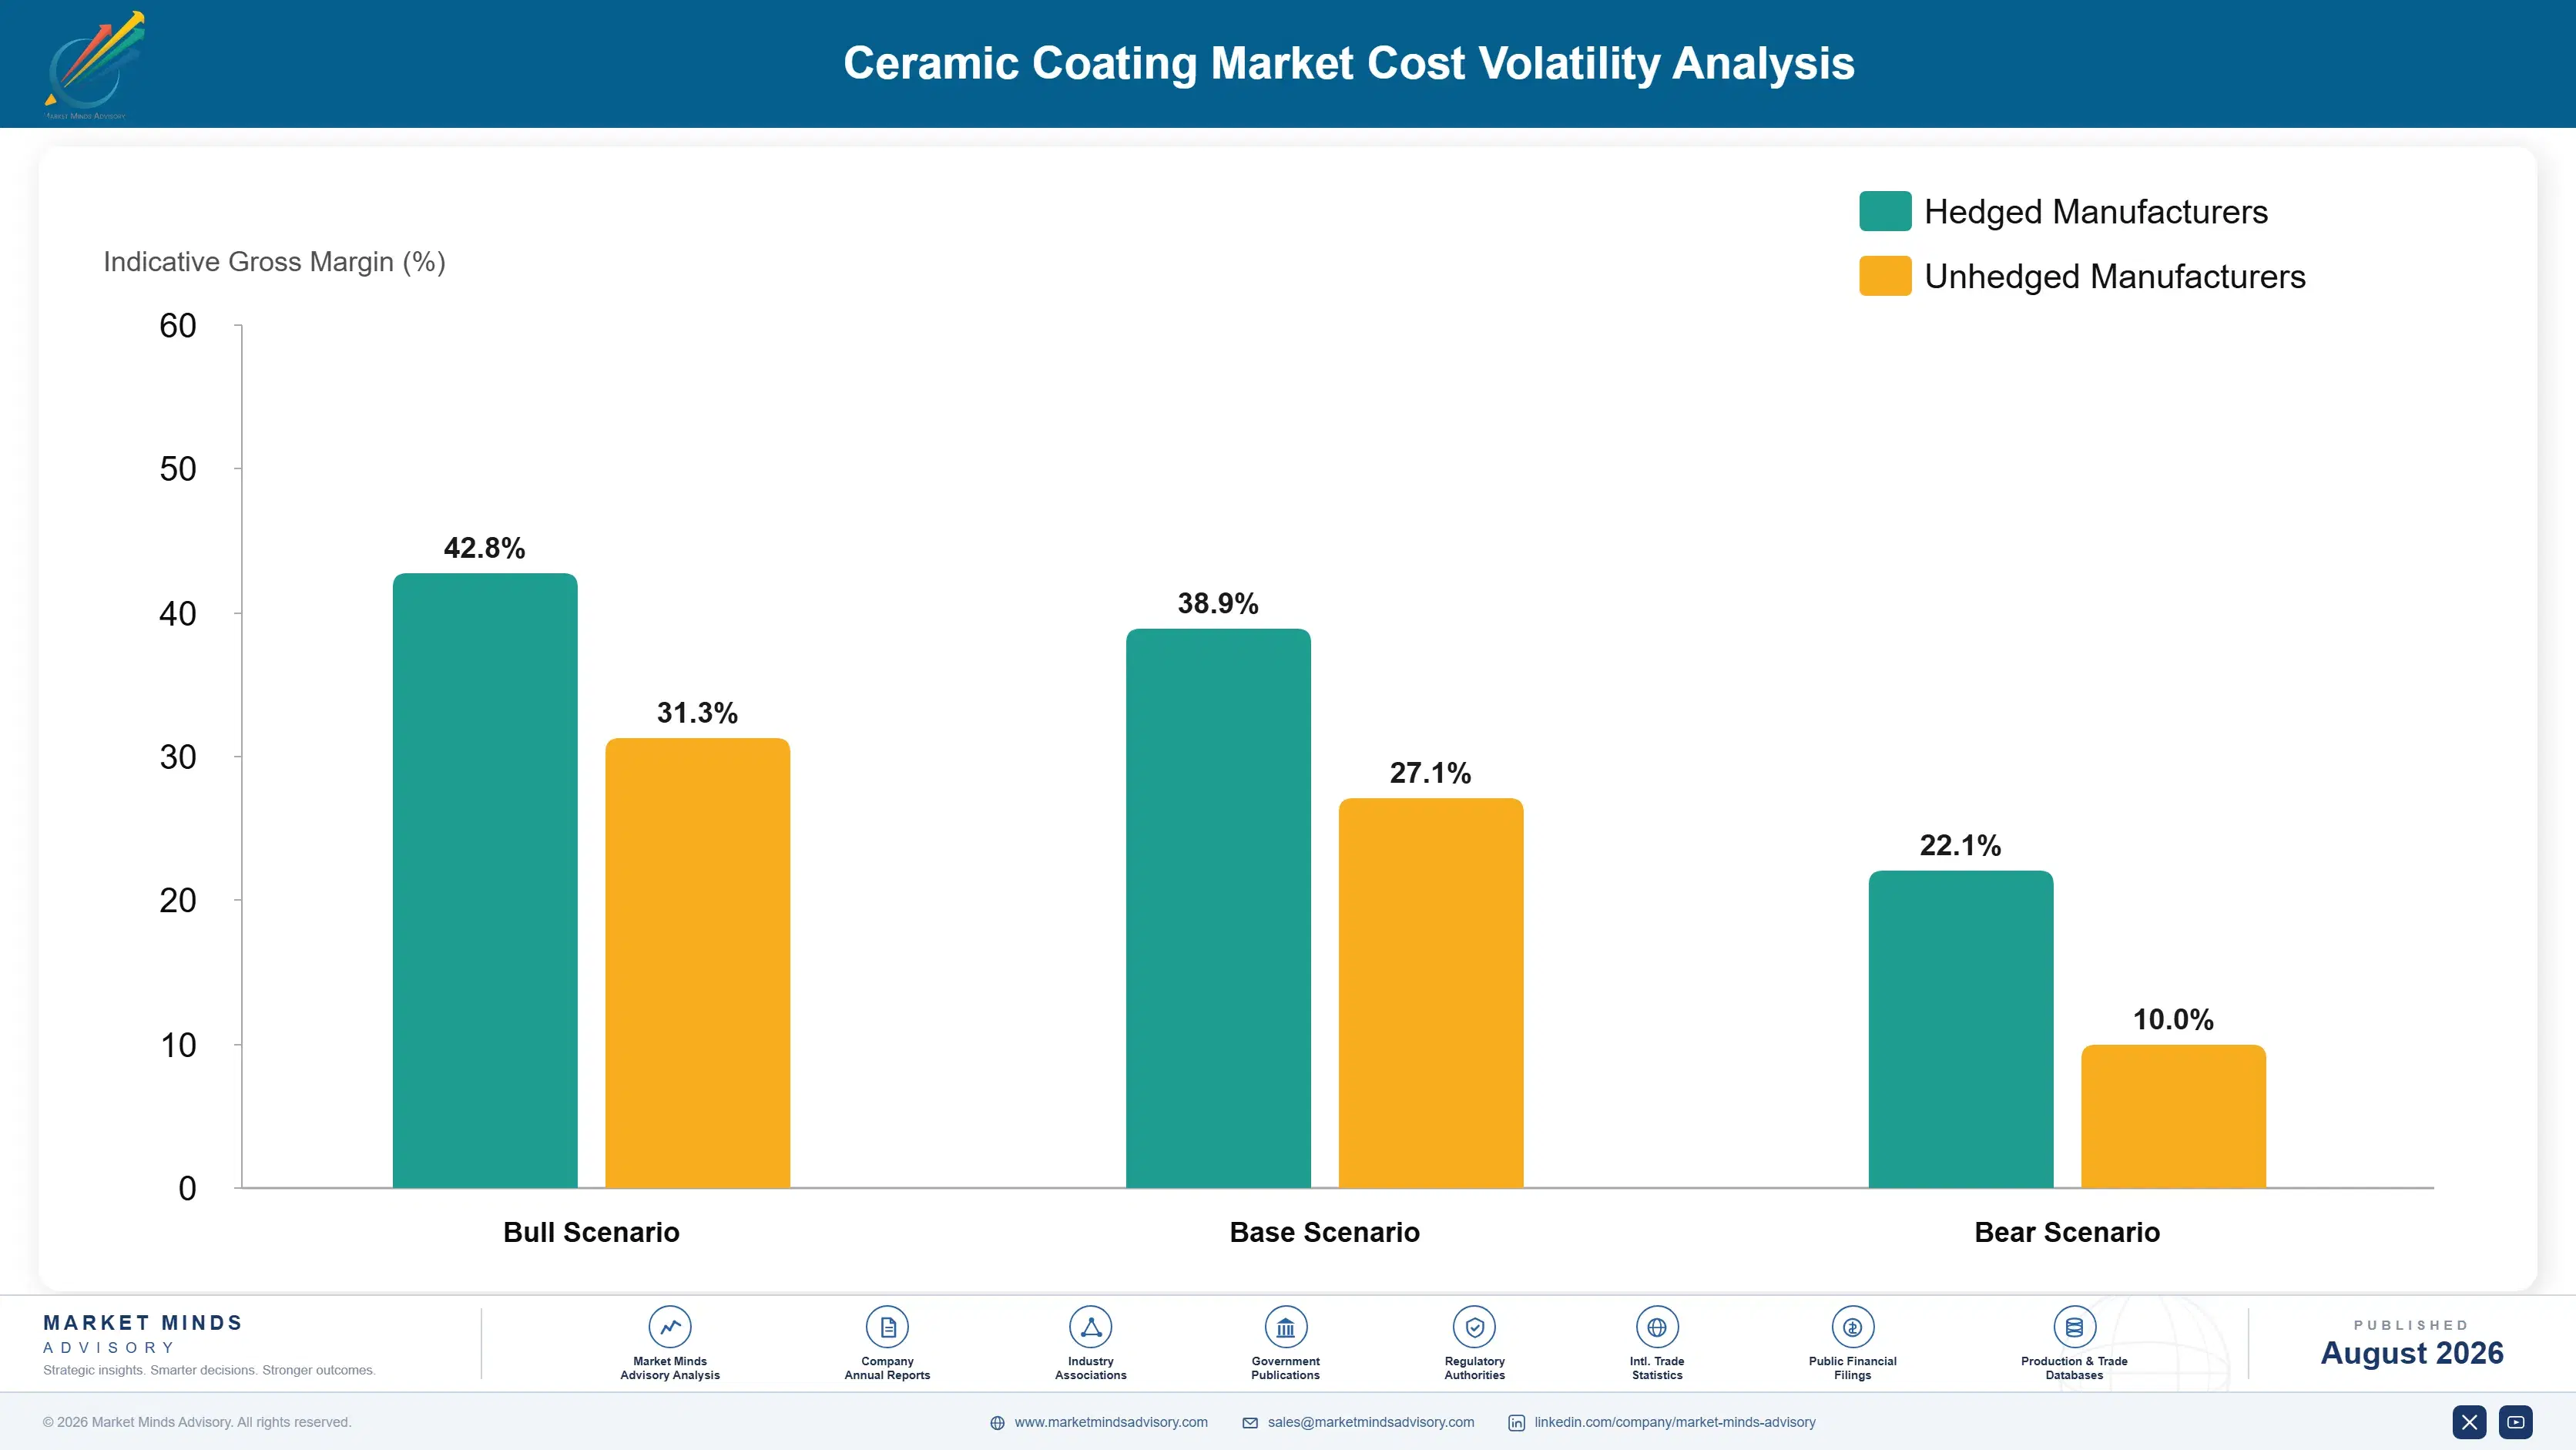
Coating cost divides between ceramic powders, sputtering targets, and process gases at roughly 31%, process energy for plasma spray and vapour deposition near 24%, skilled operator and inspection labour around 22%, equipment maintenance and consumable tooling about 13%, and quality systems, freight, and overhead the balance. Energy is unusually high here because plasma and vacuum processes draw substantial power for every part coated.
Industrial electricity prices and yttria-stabilised zirconia powder costs both rose sharply through 2022, and several surface engineering and materials companies disclosed energy and raw material pressure in filings covering that year, with IEA data tracking the underlying power movement. Rare earth stabiliser pricing moved separately again. Pass-through was slower than the cost movement because coating is priced per part on annual customer agreements. Annual agreements absorb very little of either movement.

The competitive disadvantage mechanism runs through regional power pricing rather than through powder purchasing. Powders and targets cost broadly the same for every coater of reasonable scale, while industrial electricity differs by a factor of two or more between regions and flows straight into cost per part. European coaters running plasma spray and vacuum deposition carry a disadvantage that no process improvement
ceramic-coating-market-cost-volatility-analysis-1787302679250

Index customer agreements to published power and powder movement

Process energy and ceramic powders together carry over half of coating cost and both move on cycles no coater influences, while pricing per part is typically fixed on annual customer agreements. Indexation clauses referenced to published data shift that exposure to customers better placed to absorb it across a component's total cost. Customers resist indexation and accept it

Improve first pass yield rather than reducing coating cost

First pass yield near 94% means roughly six percent of parts need rework or replacement, and the value at risk is the component rather than the coating job. Yield improvement therefore returns far more than any input cost programme could, since a single scrapped high-value part can exceed a month of that customer's coating spend. Most coaters measure

Schedule batch loading to raise line utilisation deliberately

Equipment maintenance and process energy are largely fixed per cycle rather than per part, so a partly loaded vacuum chamber or spray booth carries almost the same cost as a full one. Mixed-batch scheduling across many small customers raises utilisation in a way dedicated captive lines cannot match. That advantage is the merchant coater's clearest answer to integration.

Portfolio Architecture for Margin Defence

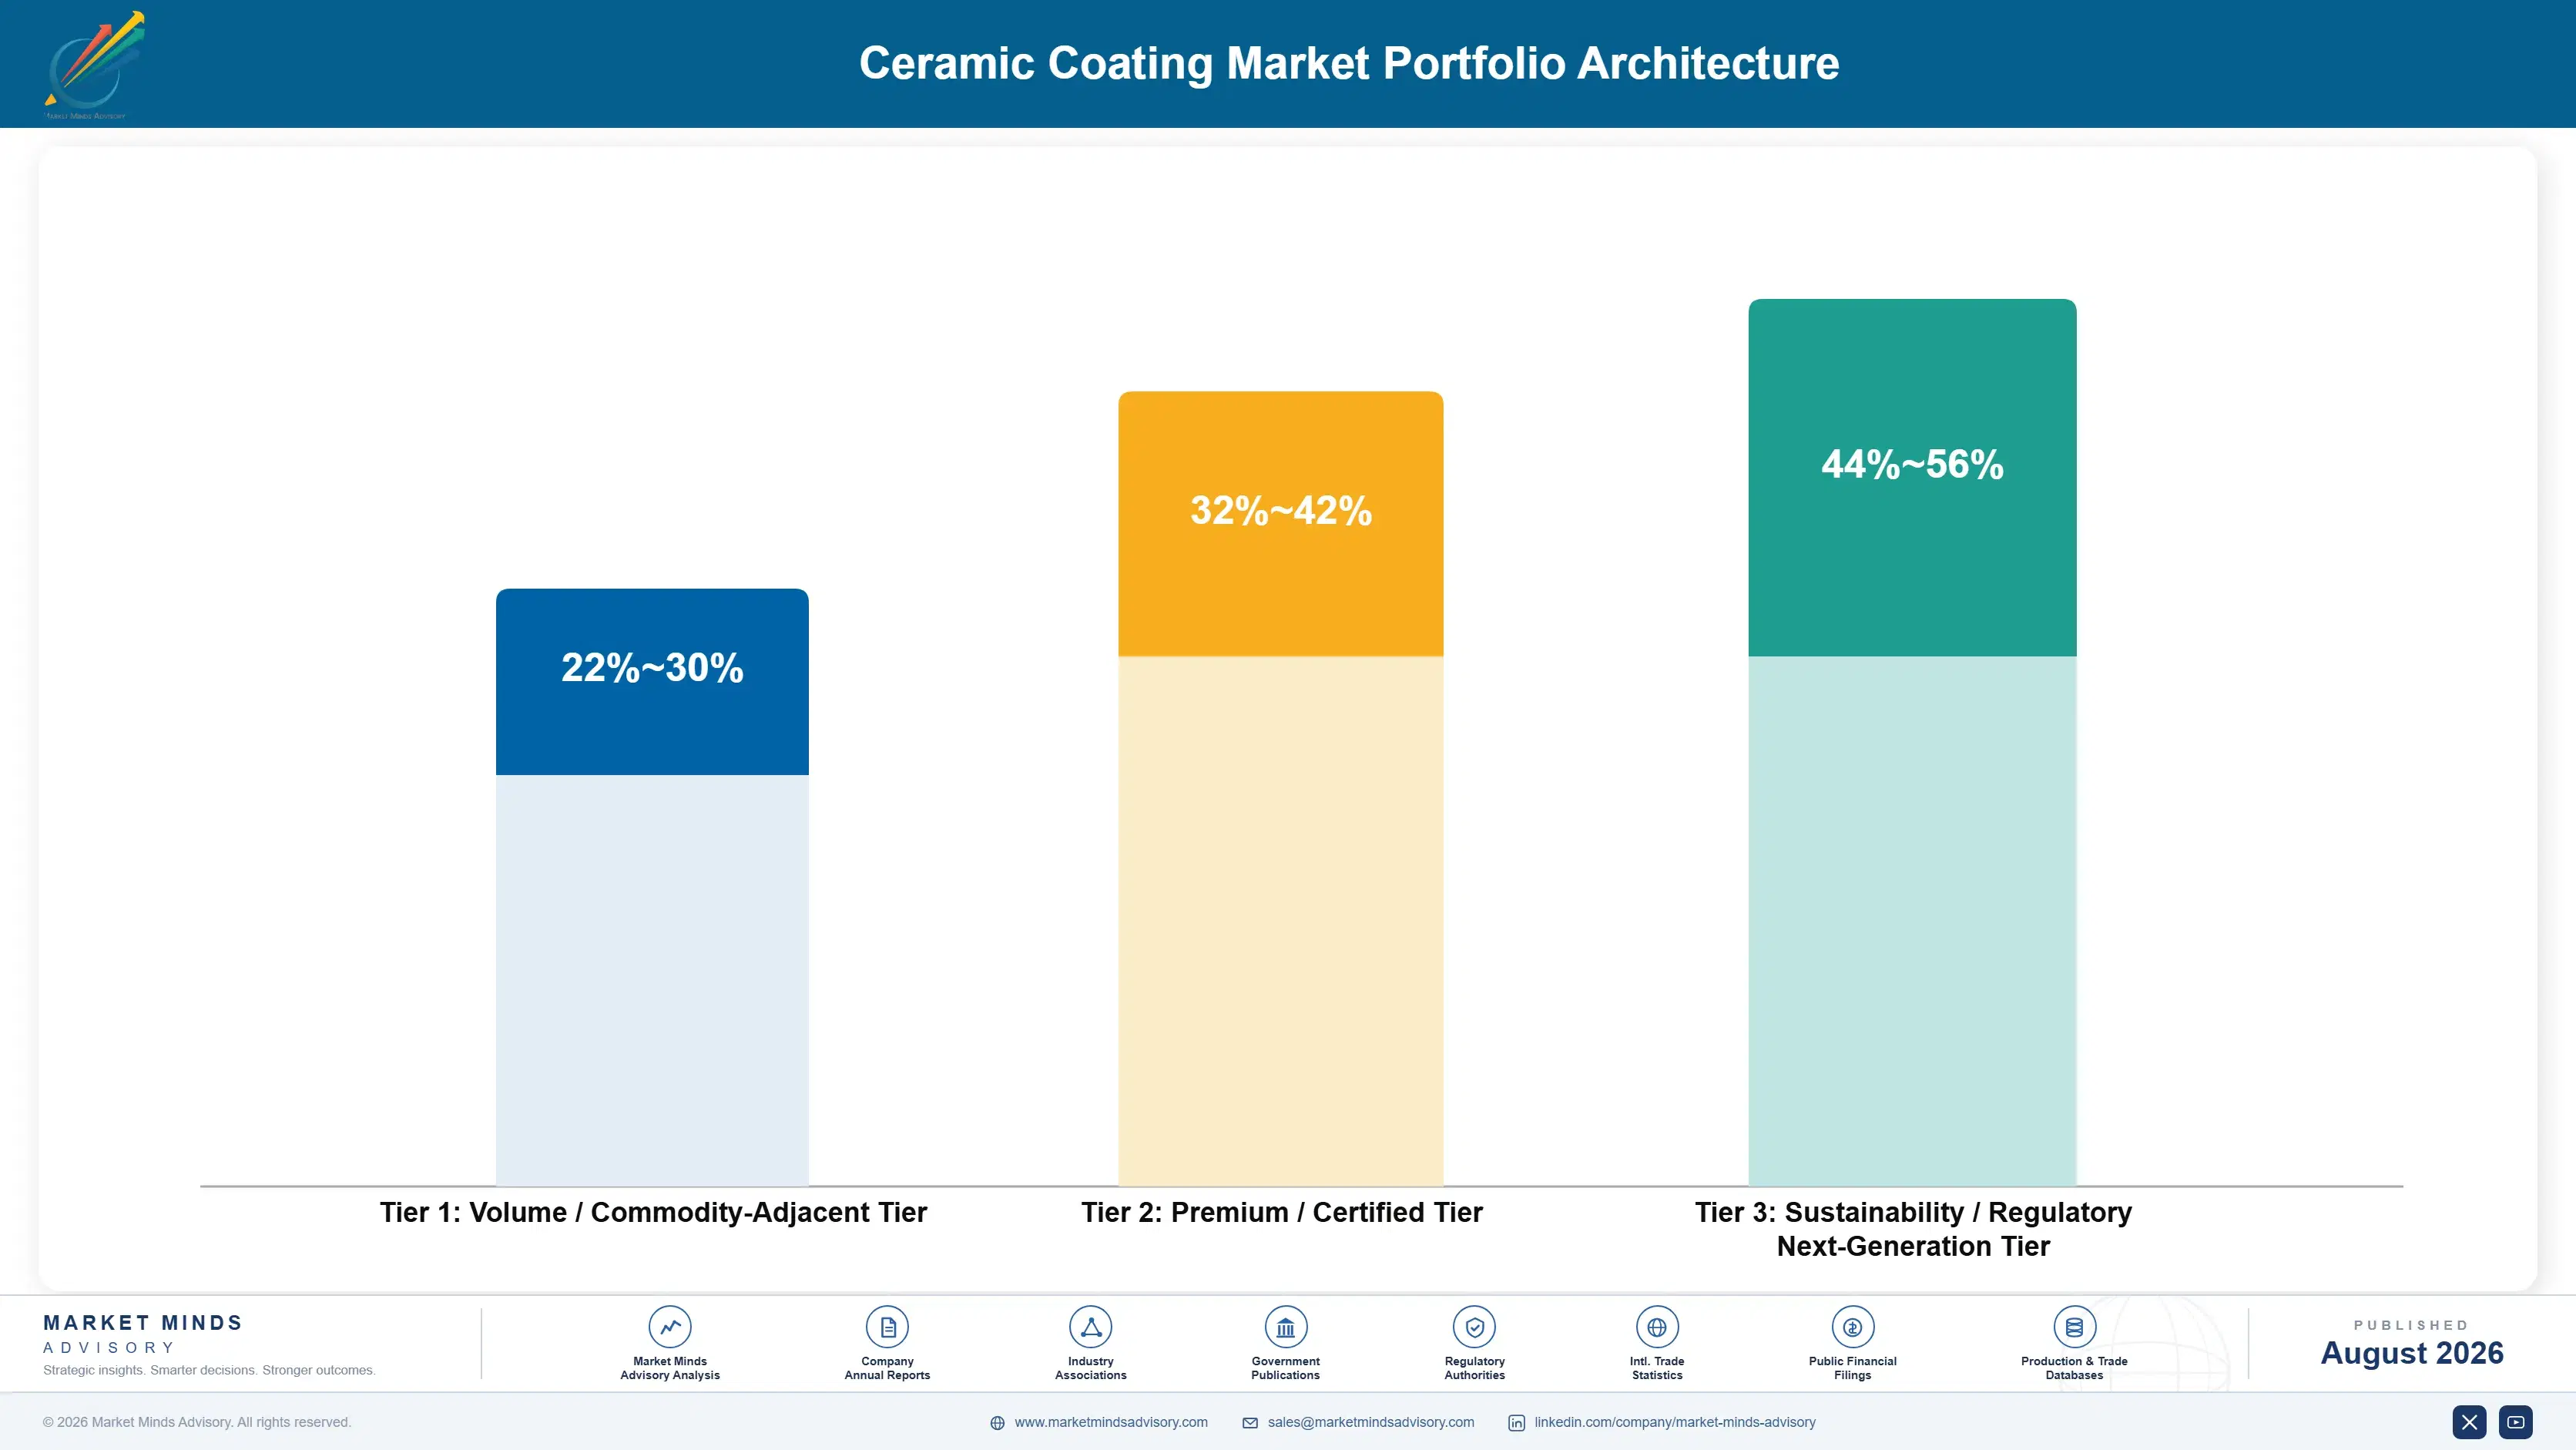
Three tiers describe this business and the spread follows the value of the part being protected rather than the coating's complexity. Decorative and general industrial wear work sits at the bottom, where parts are inexpensive and regional coaters compete on price. Tooling and die coating occupies the middle. Aerospace turbine and semiconductor equipment coating sits at the top, where the component at risk is worth orders
The tension is that low-value work fills line capacity while contributing least, and it is also the work most exposed to price competition from regional coaters with lower cost bases. A coater weighted there is competing on cost per part in a business where cost per part decides almost nothing at the top. One weighted toward aerospace carries the deepest qualifications and the sharpest cyclical exposure together.

High-value pools concentrate where a coating failure is expensive rather than where the coating is difficult. Aerospace turbine hot section work is the clearest case, since a scrapped blade set or an unplanned engine removal costs multiples of any coating contract and customers select accordingly. Semiconductor equipment coating is the second such pool, where a contaminated chamber component costs a fab far more than any coating contract.

Volume / Commodity-Adjacent Tier

Decorative coatings and general industrial wear protection on inexpensive parts where regional coaters compete on price. Fills line capacity and contributes the thinnest margin available in the portfolio. Retendered on price most years.
Gross Margin: 22-30%

Premium / Certified Tier

Cutting tool, die, and mould coatings where throughput per shift rather than tool cost drives the argument. Mixed-batch scheduling gives merchant coaters a genuine advantage over dedicated captive lines. Turnaround time matters more than qualification.
Gross Margin: 32-42%

Sustainability / Regulatory / Next-Generation Tier

Aerospace turbine thermal barriers and semiconductor equipment coatings where the protected component is worth orders of magnitude more. Best margin available and the deepest qualification barriers anywhere. Positions take years of audited demonstration.
Gross Margin: 44-56%
ceramic-coating-market-portfolio-architecture-1787302679751

Qualifications, Radii and Recoats

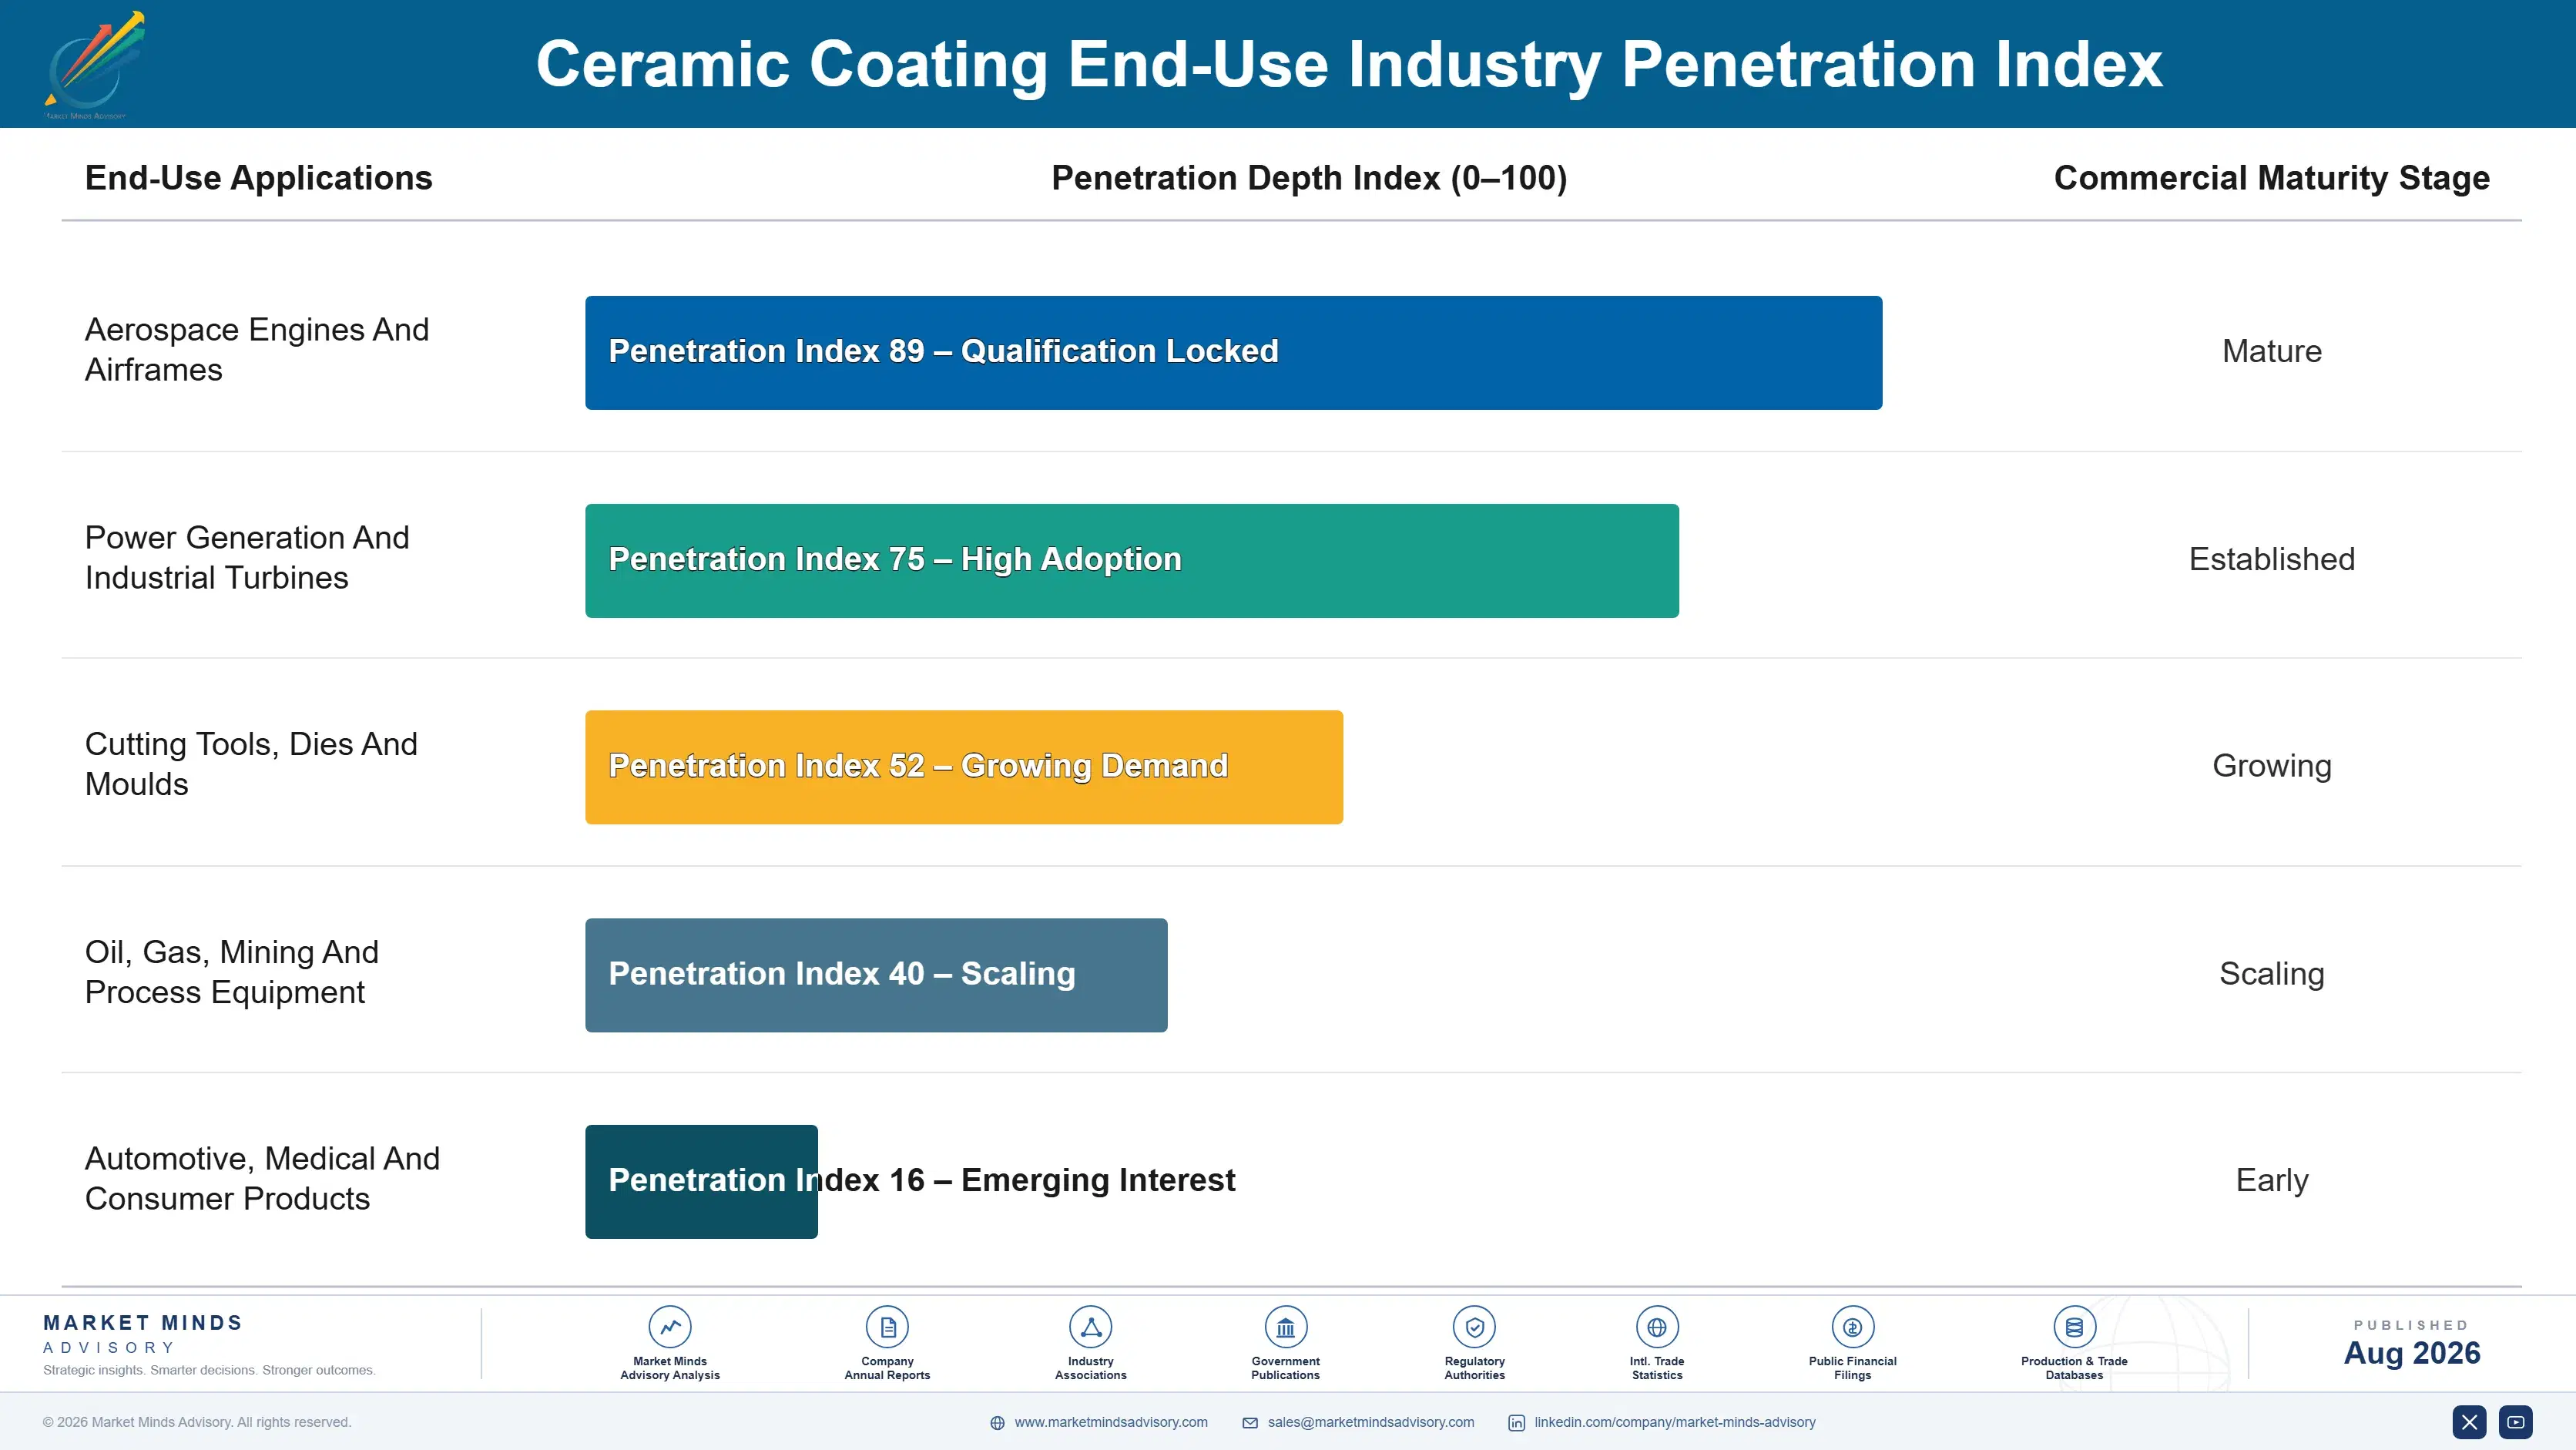
Demand arrives as recurring job flow tied to a customer's own production or maintenance schedule rather than as any purchasing cycle. A qualified coater receives parts continuously against that schedule with almost no commercial activity between contract renewals, which makes revenue unusually predictable once a position is established. Losing a position means losing that entire flow rather than a single order.
Stickiness varies sharply by tier and by industry. Aerospace and power generation qualifications are effectively permanent, since requalifying a coating process means audited demonstration that no customer undertakes for a price difference. Tooling coating sits in the middle, where relationships and turnaround time matter more than qualification. Decorative and general wear work sticks hardly at all and is retendered on price routinely.

Buyer profiles shifted as part values rose and captive integration advanced. The earlier buyer was a purchasing manager comparing coating prices per part across nearby suppliers. The current conversation increasingly involves a quality or operations lead assessing process control evidence and scrap liability, or a manufacturing engineer deciding whether to install a captive line rather than continue buying the service at all.
ceramic-coating-market-end-use-penetration-index-1787302680250

What We Would Tell a Board

These are among the four positions where our research anticipates prominent divergence between winners and laggards over the coming forecast period. Each is grounded in the demand model, the regulatory perimeter, and the announced capacity pipeline.
01 / LIABILITY VALUE SELLING

You are selling protection, not surface treatment

A component arriving at a coating line is worth roughly seventy times the coating it will receive, so a customer negotiating a few percent off the coating price is optimising something very close to nothing at all. First pass yield near 94% means the genuine conversation concerns the remaining six percent and who carries the liability for it. Coaters selling demonstrated process control and clear liability terms very rarely need to discount, while those competing on price per part almost always end up doing so.
02 / SITE DENSITY BUILDING

Reach is site count, never national coverage

Parts must travel to the coating line and then back again, which caps a practical service radius near 350 kilometres and explains concentration at only 32% across the top five participants here. National scale confers remarkably little here, while site density inside the manufacturing clusters themselves confers a very great deal indeed. Distributed regional sites and in-plant cells operated inside the customer's own facilities are the only two structures that economically reach any demand sitting beyond that radius at all.
03 / CAPTIVE RESIDUE TARGETING

Chase the work integration cannot absorb

Roughly 44% of ceramic coating is now captive because manufacturers integrated their highest and steadiest volumes in order to control scheduling and liability rather than to save any money. What remains merchant is varied, lower volume, and technically demanding work that a dedicated captive line could never fill its own schedule with at all. Coaters pursuing the volume that integration keeps taking are competing hard for precisely the work that they are least well placed of anybody to win at all.
04 / TURBINE QUALIFICATION INVESTMENT

Engine qualifications are the most durable revenue available

Thermal barrier coatings grow at 10.5% against 7.0% for the wider market, and qualification into any gas turbine engine programme is aerospace-grade and effectively permanent once it has finally been obtained. Service life around 24,000 hours also creates a recurring recoating aftermarket that new engine deliveries alone would never come anywhere close to supporting by themselves. Those positions take years of audited process demonstration and real capital to reach, and nothing else available anywhere in surface engineering defends nearly as well.

Engagement Snapshot From the Field

A live engagement with an industry participant carrying material or product regulatory and market exposure ahead of a defining policy shift, showing how our research translates into a defensible multi-year portfolio strategy.
MARKET MINDS ADVISORY · CLIENT ENGAGEMENT SUMMARY
Ceramic Coating Producer Strategic Portfolio Review and Transition Roadmap 2026·Investment Scenario on Ceramic Coating Exposure Evaluation 2025-26
CLIENT PROFILE
A merchant surface engineering group with approximately 280 million dollars in annual revenue (client-reported, unverified by MMA), operating eleven coating sites across four countries with a mix of thermal spray and vapour deposition capability. Two large customers had integrated coating in house within three years, and pricing pressure had increased across the general industrial base.
STRATEGIC CHALLENGE
The board wanted to know how much further customer integration would go, which parts of the revenue base were genuinely defensible against it, and whether the pricing pressure reflected competition or the group's own commercial approach. Nobody had separated integration losses from genuinely competitive ones in the lost work analysis.
MMA APPROACH
We assessed every customer for integration economics against its own coating volume and part mix. Lost work was analysed to separate integration from competitive loss. Revenue was decomposed by part value at risk rather than by coating type, and site coverage was mapped against customer locations by freight radius. In-plant cell economics were then costed per site.
KEY FINDINGS
  1. Roughly a third of revenue sat with customers whose volumes made integration economically attractive within five years, and two more had already begun evaluating it internally.
  2. Pricing pressure concentrated almost entirely in low part-value work, while high part-value aerospace and turbine customers had never contested price in any recorded negotiation.
  3. The group priced every job per part regardless of the component's value, which meant its most valuable work was priced as though it were general industrial coating.
  4. Four significant customers sat outside the practical freight radius of any group site, and none had been offered an in-plant cell arrangement at all.
CLIENT PROFILE
A merchant surface engineering group with approximately 280 million dollars in annual revenue (client-reported, unverified by MMA), operating eleven coating sites across four countries with a mix of thermal spray and vapour deposition capability. Two large customers had integrated coating in house within three years, and pricing pressure had increased across the general industrial base.
STRATEGIC CHALLENGE
The board wanted to know how much further customer integration would go, which parts of the revenue base were genuinely defensible against it, and whether the pricing pressure reflected competition or the group's own commercial approach. Nobody had separated integration losses from genuinely competitive ones in the lost work analysis.
MMA APPROACH
We assessed every customer for integration economics against its own coating volume and part mix. Lost work was analysed to separate integration from competitive loss. Revenue was decomposed by part value at risk rather than by coating type, and site coverage was mapped against customer locations by freight radius. In-plant cell economics were then costed per site.
KEY FINDINGS
  1. Roughly a third of revenue sat with customers whose volumes made integration economically attractive within five years, and two more had already begun evaluating it internally.
  2. Pricing pressure concentrated almost entirely in low part-value work, while high part-value aerospace and turbine customers had never contested price in any recorded negotiation.
  3. The group priced every job per part regardless of the component's value, which meant its most valuable work was priced as though it were general industrial coating.
  4. Four significant customers sat outside the practical freight radius of any group site, and none had been offered an in-plant cell arrangement at all.
RECOMMENDED STRATEGY
Phase 1: Phase 1 (months one to nine): reprice high part-value work against liability and process control rather than against cost per part. Phase 2: Phase 2 (months nine to twenty-four): offer in-plant coating cells to the four customers outside the freight radius under service contracts. Phase 3: Phase 3 (months twenty-four to forty-two): redirect capacity toward varied low-volume work that captive lines cannot schedule economically. Exit the lowest value tenders entirely.
OUTCOME
Repricing on high part-value work was implemented across two quarters with no customer losses and a measurable margin improvement. Two in-plant cell proposals were accepted, and the group stopped bidding on the lowest part-value tenders entirely (client-reported, unverified by MMA). Integration risk was added to the standing account review process.

Frequently Asked Questions

Foundational context covering the market sizes, CAGR, scope, country, region and competition that inform every finding below. This section is provided to cover basics and most often pre-purchase conversations, answered from the MMA Primary Research Dataset.

What is the current size of the Ceramic Coating Market?

The market is valued at USD 12.5 billion in 2025, rising to USD 13.38 billion in 2026. Scope covers ceramic coating services and the materials consumed applying them, not deposition equipment or bulk technical ceramics.

How large will the Ceramic Coating Market be by 2036?

MMA forecasts USD 26.32 billion by 2036, an increase of USD 12.94 billion over the 2026 base. That represents an expansion multiple of 1.97 times across the forecast period.

What is the CAGR for the Ceramic Coating Market 2026 to 2036?

The base case CAGR is 7.0%, with a bull case of 8.2% and a bear case of 5.8%. The historical rate from 2020 to 2025 was 5.9%, disrupted by the aerospace collapse and recovery.

Which segment is growing fastest?

Thermal barrier coatings at 10.5%, exactly 1.50 times the market rate. Rising turbine firing temperatures and hydrogen-capable combustion both push hot section duty beyond what superalloys tolerate unaided.

Who are the major companies in the Ceramic Coating Market?

Oerlikon, Bodycote, Praxair Surface Technologies, IHI Ionbond, and Chromalloy lead on coating service revenue. The top five hold just 32%, since parts must travel to the line and back.

Which country is growing fastest?

India at 9.8%, where tooling, automotive component, and power generation demand are expanding while coating capacity follows behind. Merchant coaters serve customers lacking the volume to integrate.

Report Segmentation Architecture

The full report scope spans multiple orthogonal segmentation dimensions, with cross-tabulated demand data provided for each dimension pair. Coverage extends further to regional breakdowns, trend trajectories, and the competitive detail needed to support segment-level decision-making.

By Coating Function And Deposition Route

  • Thermal Barrier Coatings
  • Wear And Abrasion Resistant Coatings
  • Corrosion And Oxidation Resistant Coatings
  • Hard Tooling Coatings
  • Decorative And Consumer Surface Coatings

By End-Use Industry

  • Aerospace Engines And Airframes
  • Power Generation And Industrial Turbines
  • Cutting Tools, Dies And Moulds
  • Oil, Gas, Mining And Process Equipment
  • Automotive, Medical And Consumer Products

By Commercial Model

  • Merchant Job Coating Services
  • In-Plant Cells Operated Under Service Contracts
  • Coating Materials Supply To Captive Operations
  • Qualified Aerospace And Turbine Programme Work
  • Distributor And Regional Agent Channels

By Region

  • East Asia
  • North America
  • Western Europe
  • South Asia and Pacific
  • Latin America
  • Eastern Europe
  • Middle East and Africa

Scope, Methodology, and Coverage

Every figure in this report is reproducible from documented input assumptions. The scope below maps the historical period, the forecast horizon, the segmentation dimensions, and the countries covered, alongside the underlying primary and qualitative methodology.
Historical Period
2020 to 2025
Forecast Period
2026 to 2036
Base Year
2025 (USD billions; MMA Primary Research Dataset, August 2026)
Market Definition
This market comprises ceramic coating services applied to components and the ceramic coating materials consumed in applying them, measured at supplier revenue across merchant job coating, in-plant service contract, materials supply, qualified programme, and distribution channels. Coverage spans thermal barrier coatings applied by plasma spray and electron beam deposition, wear and abrasion resistant coatings, corrosion and oxidation resistant coatings, hard tooling coatings applied by physical and chemical vapour deposition, and decorative and consumer ceramic surface coatings. Coating and deposition equipment sold as capital plant, metallic, polymer and paint coatings containing no ceramic phase, bulk technical ceramic components and substrates, surface preparation, cleaning and stripping services sold independently of a coating job, component repair and refurbishment beyond recoating, and coating design and qualification consultancy fall outside scope.
Quantitative Units
USD billions (current prices); parts coated by function; price per part by coating class; first pass yield across coating lines
Segmentation Dimensions
By Coating Function And Deposition Route; By End-Use Industry; By Commercial Model; By Region
Regions Covered
East Asia, North America, Western Europe, South Asia and Pacific, Latin America, Eastern Europe, Middle East and Africa
Countries Covered
China, Japan, South Korea, Taiwan, United States, Canada, Mexico, Germany, Switzerland, United Kingdom, France, Italy, Sweden, India, Vietnam, Thailand, Australia, Brazil, Saudi Arabia, United Arab Emirates, South Africa, Poland, Czechia, Slovakia, and additional markets relevant to this sector
Key Companies Profiled
Oerlikon, Bodycote, Praxair Surface Technologies, IHI Ionbond, Chromalloy, Hoganas, Saint-Gobain, Kennametal, Curtiss-Wright Surface Technologies, APS Materials, Metallisation, Zircotec, Sulzer, CemeCon, Platit, Hauzer Techno Coating, Aremco Products, Element Solutions, Flame Spray Technologies, Nippon Steel
Quantitative Methodology
Primary survey, n=3,800 respondents, Q4 2025, six countries; demand-side model with trade association cross-validation
Qualitative Methodology
47 expert interviews, Q4 2025; applied to validate demand model assumptions, identify emerging dynamics, and assess competitive positioning
Report Format
PDF and XLSX data workbook (Word format preview document)
Publisher
Market Minds Advisory
Report Code
MMA-2026-CHM-882
Published
August 2026
Contact
sales@marketmindsadvisory.com | www.marketmindsadvisory.com

Purchase the full Ceramic Coating Market Report (2026 to 2036).

The full report sizes ceramic coating across five coating functions, five end-use industries, five commercial models, and seven regions, with revenue decomposed by part value at risk rather than by coating type alone. Captive integration economics are modelled customer by customer, since that determines which merchant volume is genuinely defensible. Freight radius coverage is mapped against customer manufacturing locations. Competitive profiling covers twenty participants on coating service revenue, and aerospace qualification positions are assessed separately from general industrial capability. Regional demand is built from manufacturing cluster geography rather than industrial output.
Revenue decomposed by part value at risk
Captive integration economics modelled customer by customer across regions
Freight radius coverage mapped against customer manufacturing site locations
Aerospace qualification positions assessed separately from general industrial capability
First pass yield benchmarked against part value and liability exposure
Hydrogen turbine coating requirements assessed against existing qualified systems

Built For The People Who Decide

From boardroom strategy to bench-side execution, this report is read cover-to-cover by leaders shaping the next decade of their industry, turning demand scenarios, market dynamics and valuation benchmarks into decisions.
CXOs/ Presidents/ VPs/ Managers
M&A and Corporate Development
Strategy Teams and R&D Heads
Procurement and Product Directors
Regulatory and Compliance Leaders
Investor Relations and Equity Analysts