Market Minds Advisory
Calcium Hydrogen Sulphite Market

Calcium Hydrogen Sulphite Market: Mostly Water, Mostly Made On Site

Around 61% of this chemical is generated where it is consumed, and the merchant business that remains is limited by a freight radius beyond which buyers are paying to move water.

Lead Analyst

Bilal Shaikh

Published

August 2026

Make Smarter Decisions with Customized Research Insights

Request a free sample report and evaluate market opportunities, growth trends, and competitive dynamics relevant to your business needs.

2025 MARKET VALUE$0.4BMarket Size 2025
2036 FORECAST VALUE$0.6BBase Case , 2026 to 2036
CAGR 2026 TO 20364.6 %Bull 5.8% / Bear 3.4%
INCREMENTAL OPPORTUNITY$0.2BNet 10- year value creation
EXPANSION MULTIPLE1.58x2036 value over 2026 base
Strategic Levers
M&A Pipeline
Regional Outlook
Country Rankings
Competitive Intelligence
Segmental Deep-dive
Call-Us : 91 93563 13602

Executive Snapshot and Market Trajectory

Roughly 61% of calcium hydrogen sulphite is generated on site, at pulp mills that burn sulfur and absorb the gas into lime slurry as part of their own process. The merchant market is what remains, limited by a delivered concentration near nine percent that makes freight dominant.
Growth runs at 4.6% and water treatment leads it. Dechlorination grade grows at 6.9%, exactly 1.50 times the market rate, as discharge consent limits on residual chlorine tighten across municipal and industrial outfalls. East Asia holds 34%, above band, because Chinese paper production and municipal wastewater expansion both sit there. Sulfite pulping decline works against the market underneath all of it. Reagent demand sits beneath it, small and stable.
Concentration is very low at 29% across the top five measured on merchant tonnes supplied, and regional producers hold positions inside their freight radii that no national competitor can profitably contest. Sulfur dioxide feedstock carries roughly 44% of merchant production cost, and a producer without secured sulfur supply is exposed to a market it does not participate in. Sodium bisulfite competes where calcium hardness is unwelcome. Shelf life prevents buyers stockpiling against outages.
Market Definition
This market covers calcium hydrogen sulphite supplied as aqueous solution and related bisulfite preparations, spanning technical grade solution, pulping liquor grade, water treatment grade, food grade, and reagent and analytical grade. Sodium and ammonium bisulfite and metabisulfite products, sulfur dioxide sold as gas or liquid, calcium sulfite and sulfate by-products, on-site generation equipment, and sulfite pulping process licensing fall outside scope. Captive volumes generated and consumed within the same facility are quantified separately and excluded from market value.
Base Year Value
$0.4B in 2025 (MMA Primary Research Dataset, August 2026)
Forecast Period
2026 to 2036, eleven discrete annual values
CAGR
4.6% base case. Bull 5.8%. Bear 3.4%.
Fastest Growth Segment
Water Treatment Grade: 6.9% CAGR
Fastest Growth Country
India: 7.1% CAGR
Fastest Growth Region
South Asia and Pacific: 6.6% CAGR
Largest Region
East Asia: 34% of 2025 global value
Market Leaders
Solvay, Grillo-Werke, Esseco Group, BASF, Shandong Kailong New Material. Source: MMA Analysis based on company annual reports.
Primary Survey
n=3,800 procurement and R&D decision-makers, Q4 2025, six countries
Methodology
Demand-side build-up, cross-validated against public data, 47 expert interviews

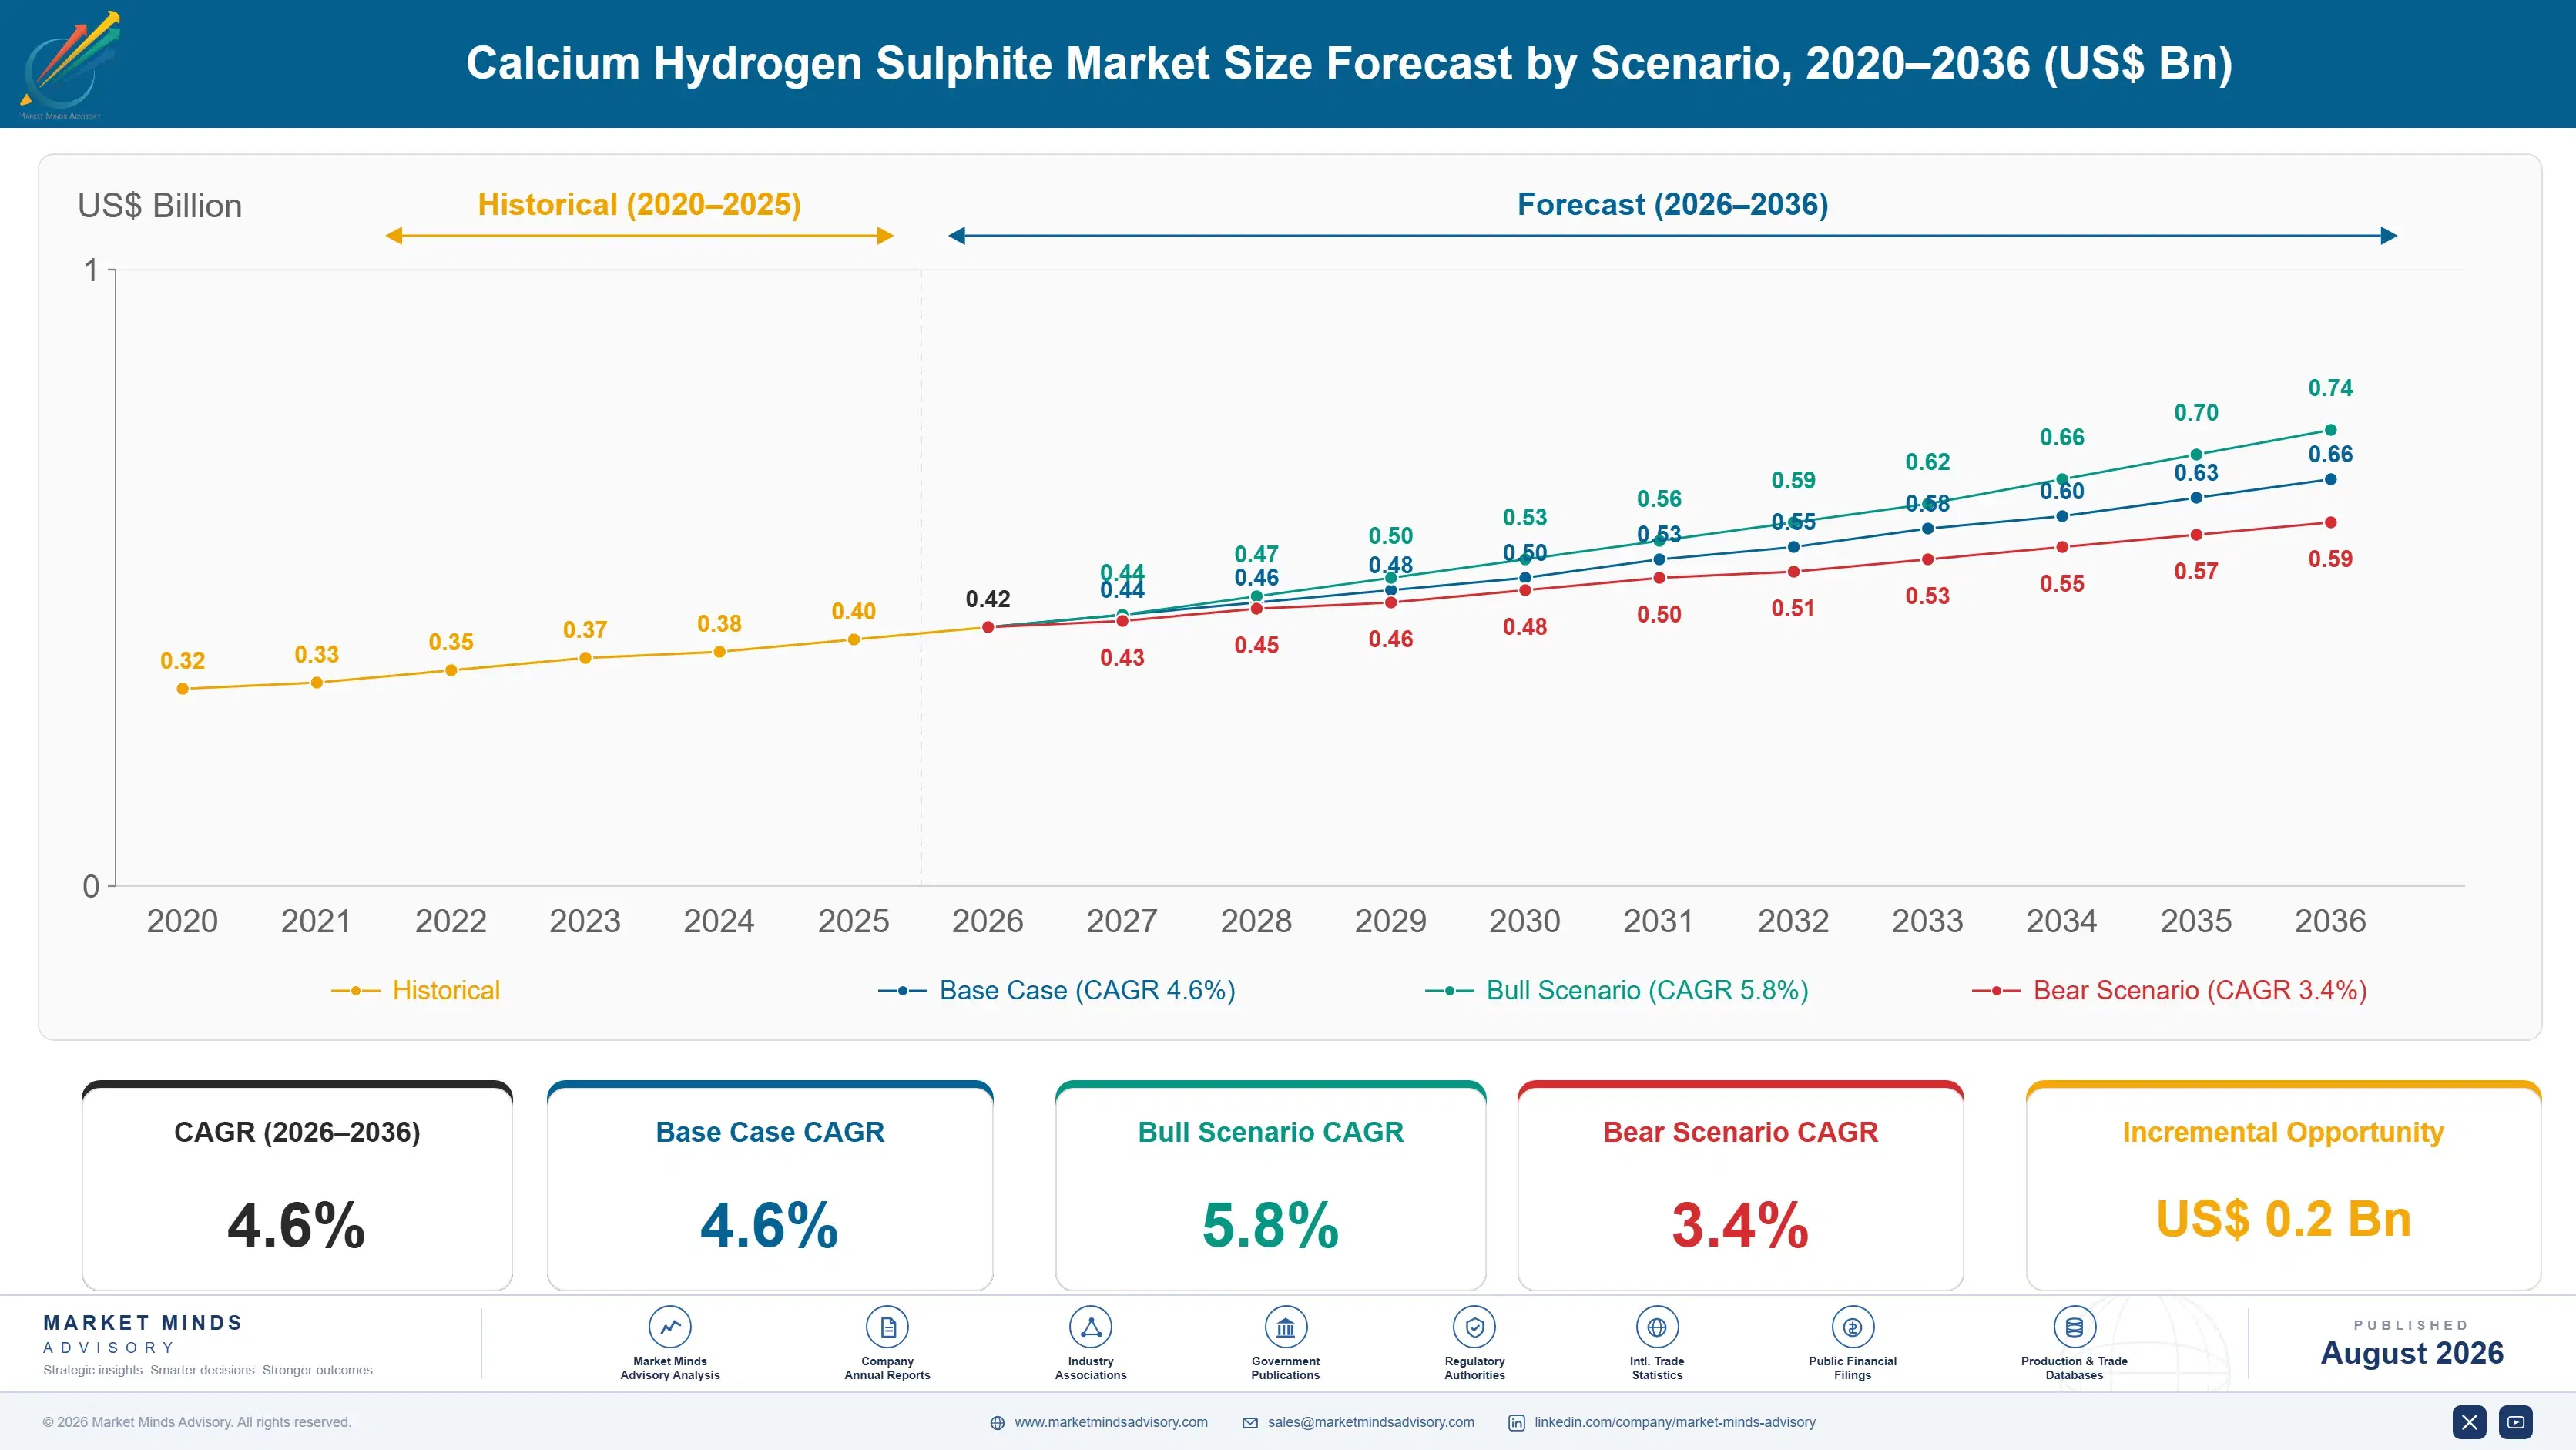
Calcium Hydrogen Sulphite Market Forecast Scenarios

calcium-hydrogen-sulphite-market-size-forecast-scenario-1787302671059
The 2020 to 2025 period ran at 4.1% and two opposing forces produced that number. Sulfite pulping capacity continued its long decline in North America and Western Europe as mills closed or converted to kraft, removing captive and merchant volume together. Water treatment demand grew steadily against it, pulled by discharge consent tightening rather than by any rise in treated volume.
Three mechanisms carry the 4.6% base case. Municipal dechlorination is the largest, since consent limits on residual chlorine are tightening across most regulated jurisdictions rather than in any single one. Industrial process water and reverse osmosis pretreatment is the second, growing with desalination and industrial reuse capacity. And food preservation demand is the third, smaller but stable and priced considerably better than technical grades. None of the three depends on pulping.
The 5.8% bull case rests on industrial water reuse mandates broadening faster than currently legislated, which would add dechlorination demand across sectors that discharge rather than recycle today. The 3.4% bear case is accelerated sulfite pulping closure across two or three remaining regions at once, since those mills carry merchant volume that has no alternative outlet nearby.

Freight Radius Defines The Market

This is a chemical that mostly does not get sold. Around 61% of it is generated inside the facility that consumes it, at pulp mills burning sulfur and absorbing the resulting gas into lime slurry as part of their own liquor preparation. Merchant supply serves everyone else: water treatment plants, food processors, and industrial users without the equipment or the volume to justify making it.
TOP FIVE CONCENTRATION29%Very fragmented, with regional producers serving local freight radii
CAPTIVE PRODUCTION SHARE61%Generated on site at mills rather than purchased merchant
SOLUTION STRENGTH SUPPLIED9%As delivered concentration in bulk aqueous solution form
FREIGHT RADIUS LIMIT400 kmBeyond which water in the solution defeats delivered economics
SHELF LIFE WINDOW90 daysBefore oxidation degrades the active reducing agent content
SULFUR SHARE OF COST44%Of merchant production cost from sulfur dioxide feedstock
Delivered concentration around nine percent explains the market structure. A tanker carries mostly water, so freight cost per unit of active reducing agent rises steeply with distance and beyond roughly 400 km the buyer is better served by a nearer producer or a different chemistry entirely. Concentration at 29% follows directly from that, and no consolidation has changed it because scale does not travel.
Shelf life adds a second constraint that buyers underestimate. Bisulfite solution oxidises in storage and loses reducing capacity over roughly 90 days, faster when warm or aerated, so inventory is not a hedge against supply interruption in the way it is for most industrial chemicals. Buyers who learned that during a supply outage now hold qualified second sources rather than tanks.
"Every few years somebody proposes consolidating this market and building one big plant. The freight maths kills it in about a week. You cannot ship water four hundred kilometres and expect anybody to pay for it."
Director, Industrial Chemicals and Water Treatment Practice · MMA Chemicals and

Market Trends

Discharge Consent Tightening Drives Dechlorination Demand

Residual chlorine limits in discharge consents are tightening across municipal and industrial outfalls in most regulated jurisdictions, and bisulfite is the standard reducing agent for meeting them. Water treatment grade grows at 6.9% against 4.6% for the market. The demand follows regulation rather than treated volume, which means it grows in regions where water throughput is flat, and it has already offset the volume that sulfite pulping decline removed. Reverse osmosis pretreatment is the least price sensitive part of that demand. A dosing failure destroys membranes. Buyers price supply security accordingly.
Market Impact: Solution runs about 9% strength
Sulfite Pulping Decline Removes Captive And Merchant Volume

Sulfite pulping capacity has been closing or converting to kraft for decades across North America and Western Europe, and each closure removes captive generation and the merchant top-up volume around it simultaneously. Around 61% of total production remains captive, concentrated in those mills. Producers serving mill clusters have watched their local demand base shrink permanently, and the remaining mills are increasingly the specialty dissolving pulp operations rather than commodity paper. Water treatment growth replaces the volume nationally without replacing it inside any particular radius. That distinction decides individual plant viability. National figures hide it completely.
Market Impact: Freight limit sits near 400 km

Market Opportunities and Growth Drivers

Bisulfite Remains The Default Dechlorination Chemistry

Sulfur dioxide gas, sodium bisulfite, and calcium bisulfite all dechlorinate, and calcium grades hold position where the receiving stream tolerates hardness and where lime is locally cheap. Alternatives exist and none has displaced it on cost across the applications where it fits. Plant operators change dechlorination chemistry rarely, because the dosing equipment, storage, and discharge monitoring are all configured around whatever was specified when the plant was commissioned. Requalifying a different reducing agent means revalidating discharge monitoring alongside the dosing equipment. Few operators undertake that voluntarily. Inertia favours the incumbent chemistry.
Market Impact: Freight radius caps at 400 km

Desalination And Reuse Add Pretreatment Demand

Reverse osmosis membranes are destroyed by residual oxidant, so dechlorination ahead of the membrane train is mandatory rather than optional in desalination and industrial water reuse. That demand grows directly with installed capacity, which is expanding fastest across the Gulf, India, and Chinese coastal industry. Dosing is continuous and the consequence of failure is membrane replacement, which makes buyers considerably less price sensitive than municipal outfall users. Gulf desalination capacity alone exceeds any other regional concentration of this demand by a considerable distance. Indian and Chinese coastal capacity follows. All of it doses continuously.
Market Impact: Shelf life runs about 90 days

Market Restraints and Challenges

Freight Economics Cap Any Producer's Reachable Market

Delivered solution runs around nine percent active, so a tanker carries mostly water and the root cause of the constraint is simply that nobody will pay freight on the other ninety-one percent. Beyond roughly 400 km a nearer producer wins on landed cost regardless of production efficiency. Commercial impact is that scale does not travel and consolidation does not pay. Mitigation runs through distributed small plants, toll arrangements with local producers, and supplying concentrated intermediates for dilution at the customer site. None of those mitigations changes the arithmetic itself. They work around it.
Market Impact: Water treatment grade grows 6.9%

Oxidation Limits Shelf Life And Inventory Cover

Bisulfite solution loses reducing capacity to oxidation over roughly 90 days, faster when warm or aerated, and the root cause is that the reducing agent doing the useful work is equally reactive toward atmospheric oxygen. Commercial impact is that buyers cannot hold inventory as supply insurance the way they do for stable chemicals. Mitigation runs through nitrogen blanketing on storage, qualified second sources within freight radius, and shorter delivery cycles at higher logistics cost. Buyers who discovered this during an outage now hold qualified second sources instead of larger tanks. The lesson tends to stick.
Market Impact: Captive supply is 61% of production
3 additional market trends, 4 additional growth drivers, and 2 additional restraints and challenges are covered in the full report. Contact sales@marketmindsadvisory.com to access the complete intelligence.

Segment CAGR and Growth Architecture

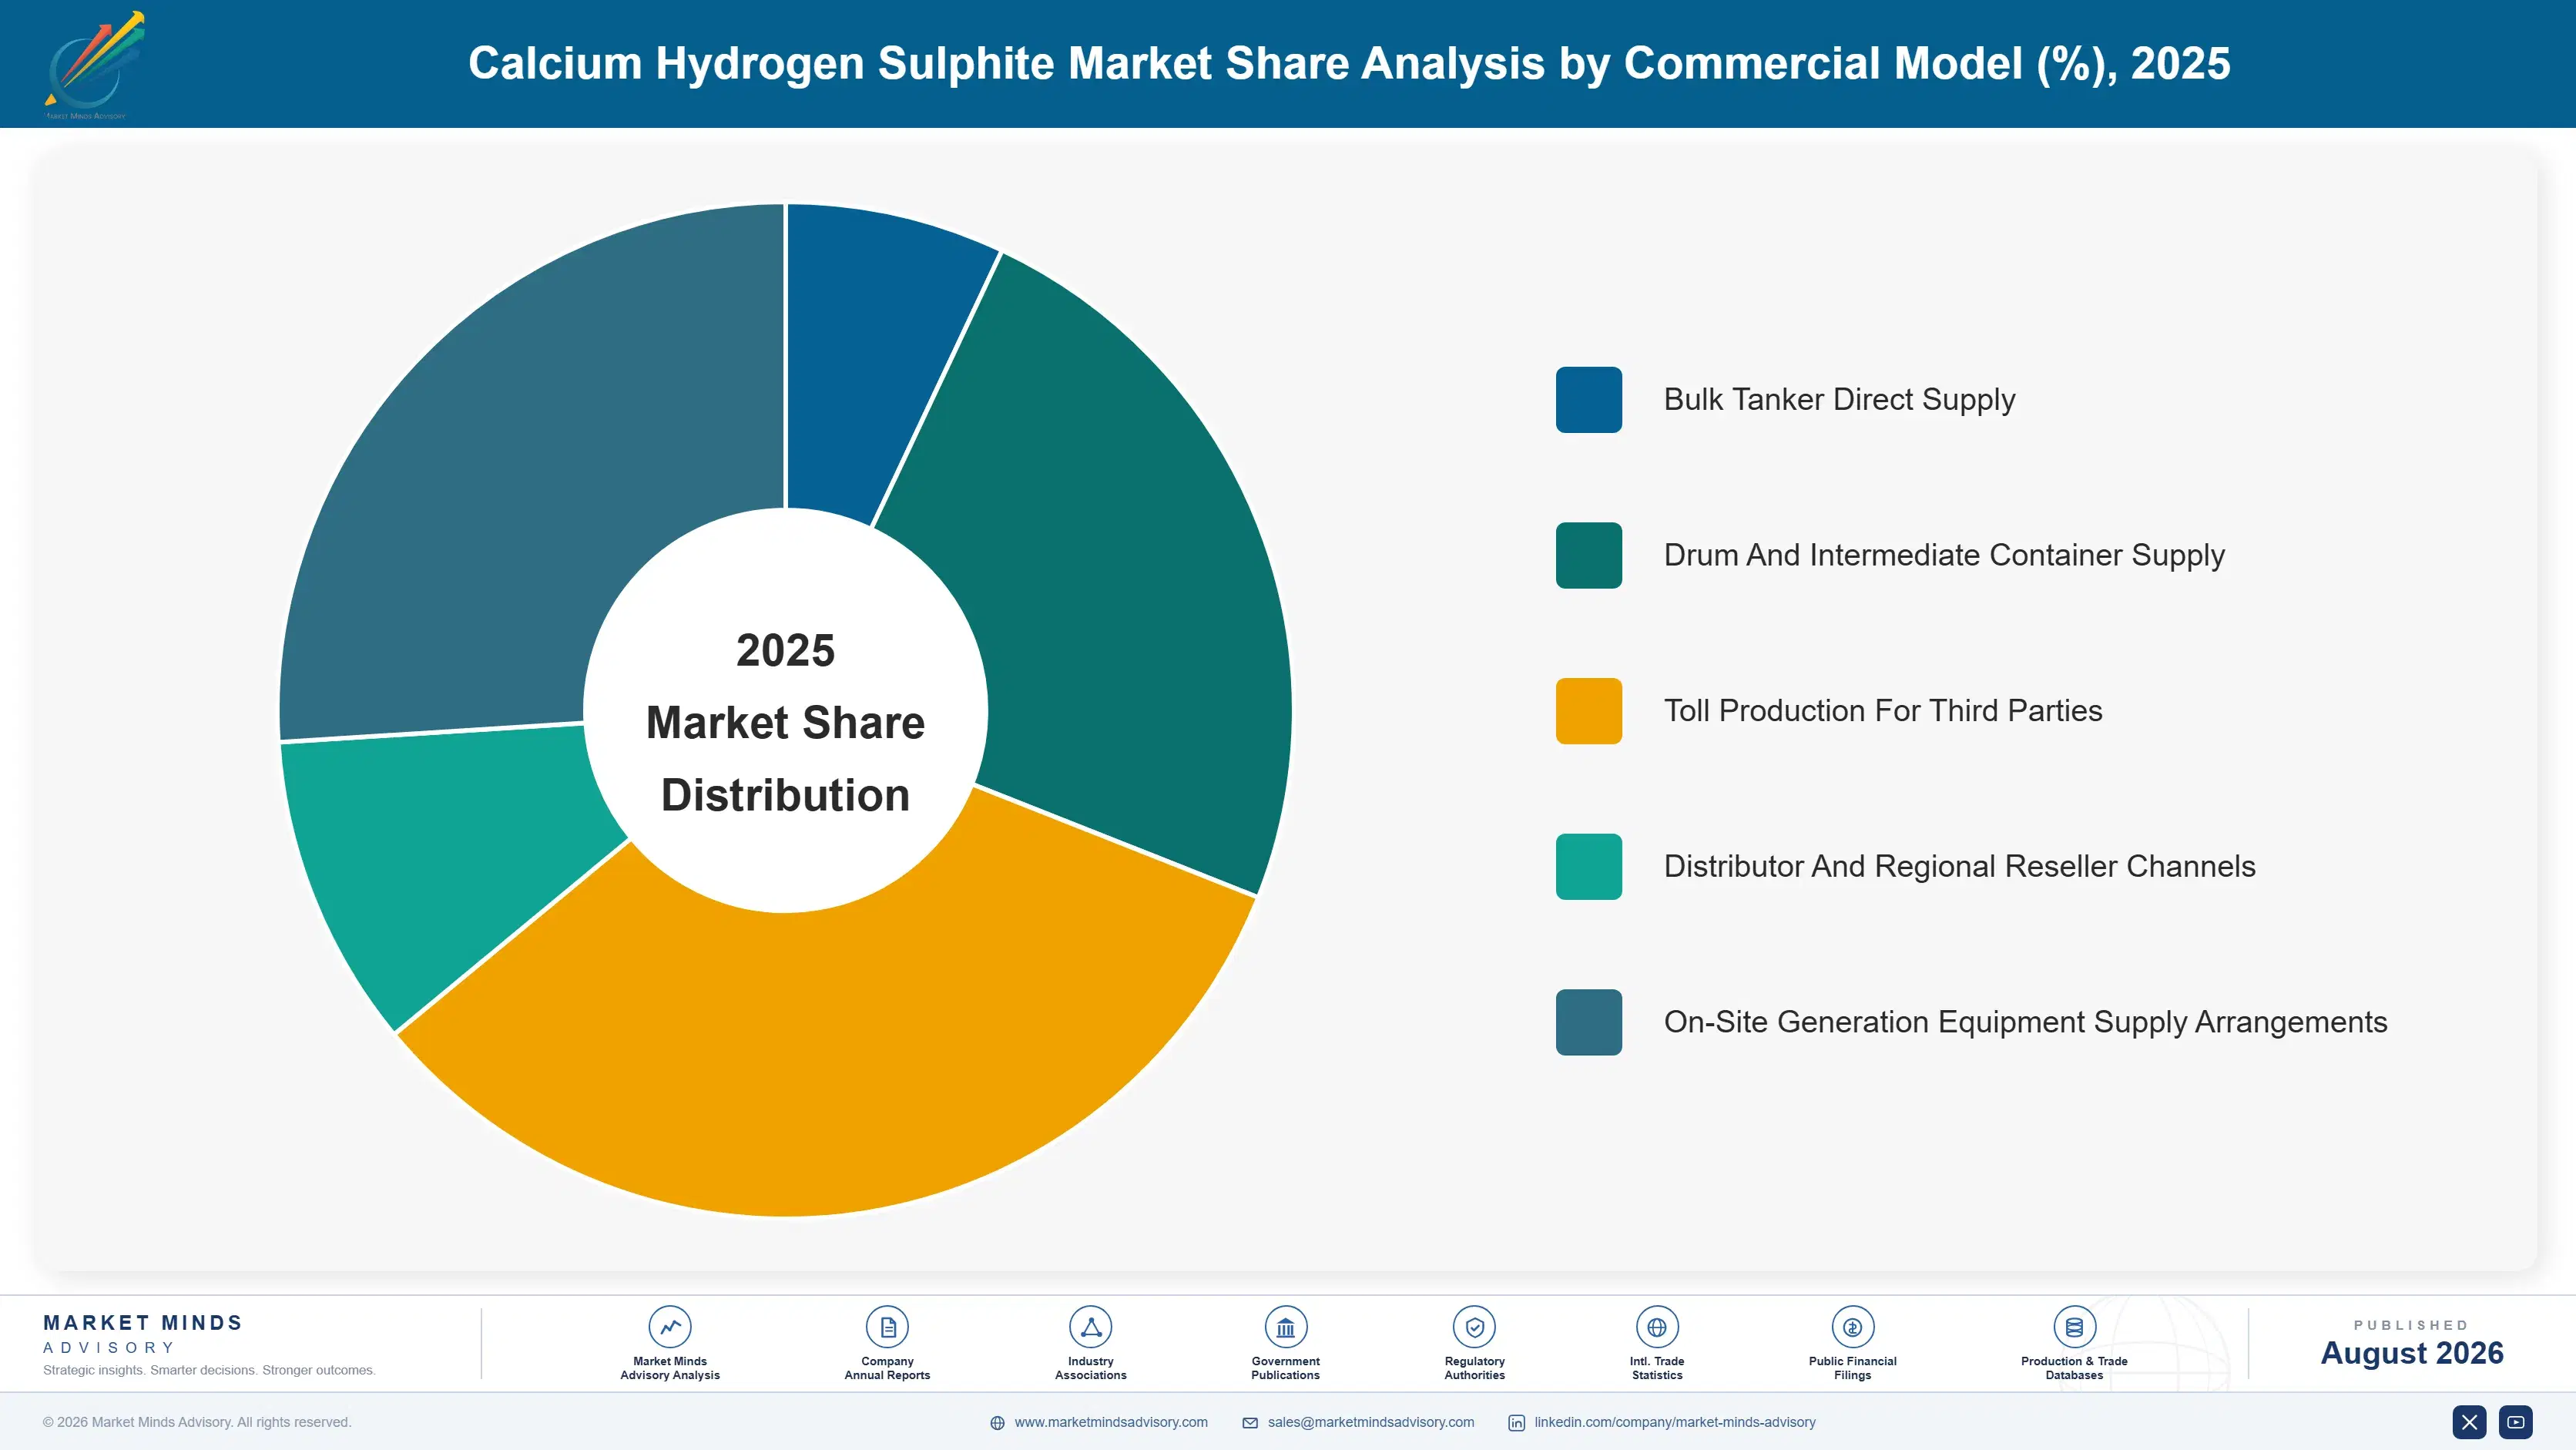
Segmentation follows product grade and the specification it is made to, because that determines purity control, permitted impurities, certification requirement, and price per tonne of active material. Delivery format and customer industry both cut across every grade rather than separating them cleanly, which makes either a weaker primary dimension for this market. Grade is what the buyer actually specifies.
calcium-hydrogen-sulphite-market-market-share-analysis-1787302671598

Water Treatment Grade

The fastest grade at 6.9%, exactly 1.50 times the market rate, supplying municipal dechlorination, industrial outfall treatment, and reverse osmosis pretreatment. Growth follows discharge consent tightening rather than treated water volume, so it rises in regions where throughput is flat. Reverse osmosis pretreatment is the least price sensitive application in the whole market, since a dosing failure destroys a membrane train worth far more than a year of chemical supply. Certification requirements are modest compared with food grade, which keeps the field of qualified suppliers reasonably wide. Municipal outfall users retender on price more readily, though usually among the same two or three producers who can physically deliver. Choice is narrower than it appears.
CAGR 6.9%

Food Grade

Second fastest at 5.4%, supplying preservation, browning control, and processing applications where sulfite chemistry is permitted and declared. Volumes are small against technical grades and pricing is considerably better, because certification, traceability, and heavy metal specification limits all restrict who can supply it. Regulatory pressure cuts both ways here: sulfite labelling requirements and allergen declarations constrain use in some categories while permitted applications remain stable in others. Producers holding food certification treat it as a margin business rather than a volume one. Heavy metal specification limits are the practical barrier rather than any difficulty in making the material itself. Feedstock purity decides whether a site can qualify. Not every sulfur source will pass.
CAGR 5.4%
Full segment breakdown across 5 segments available in the complete report.

Regional Architecture and Country Demand Map

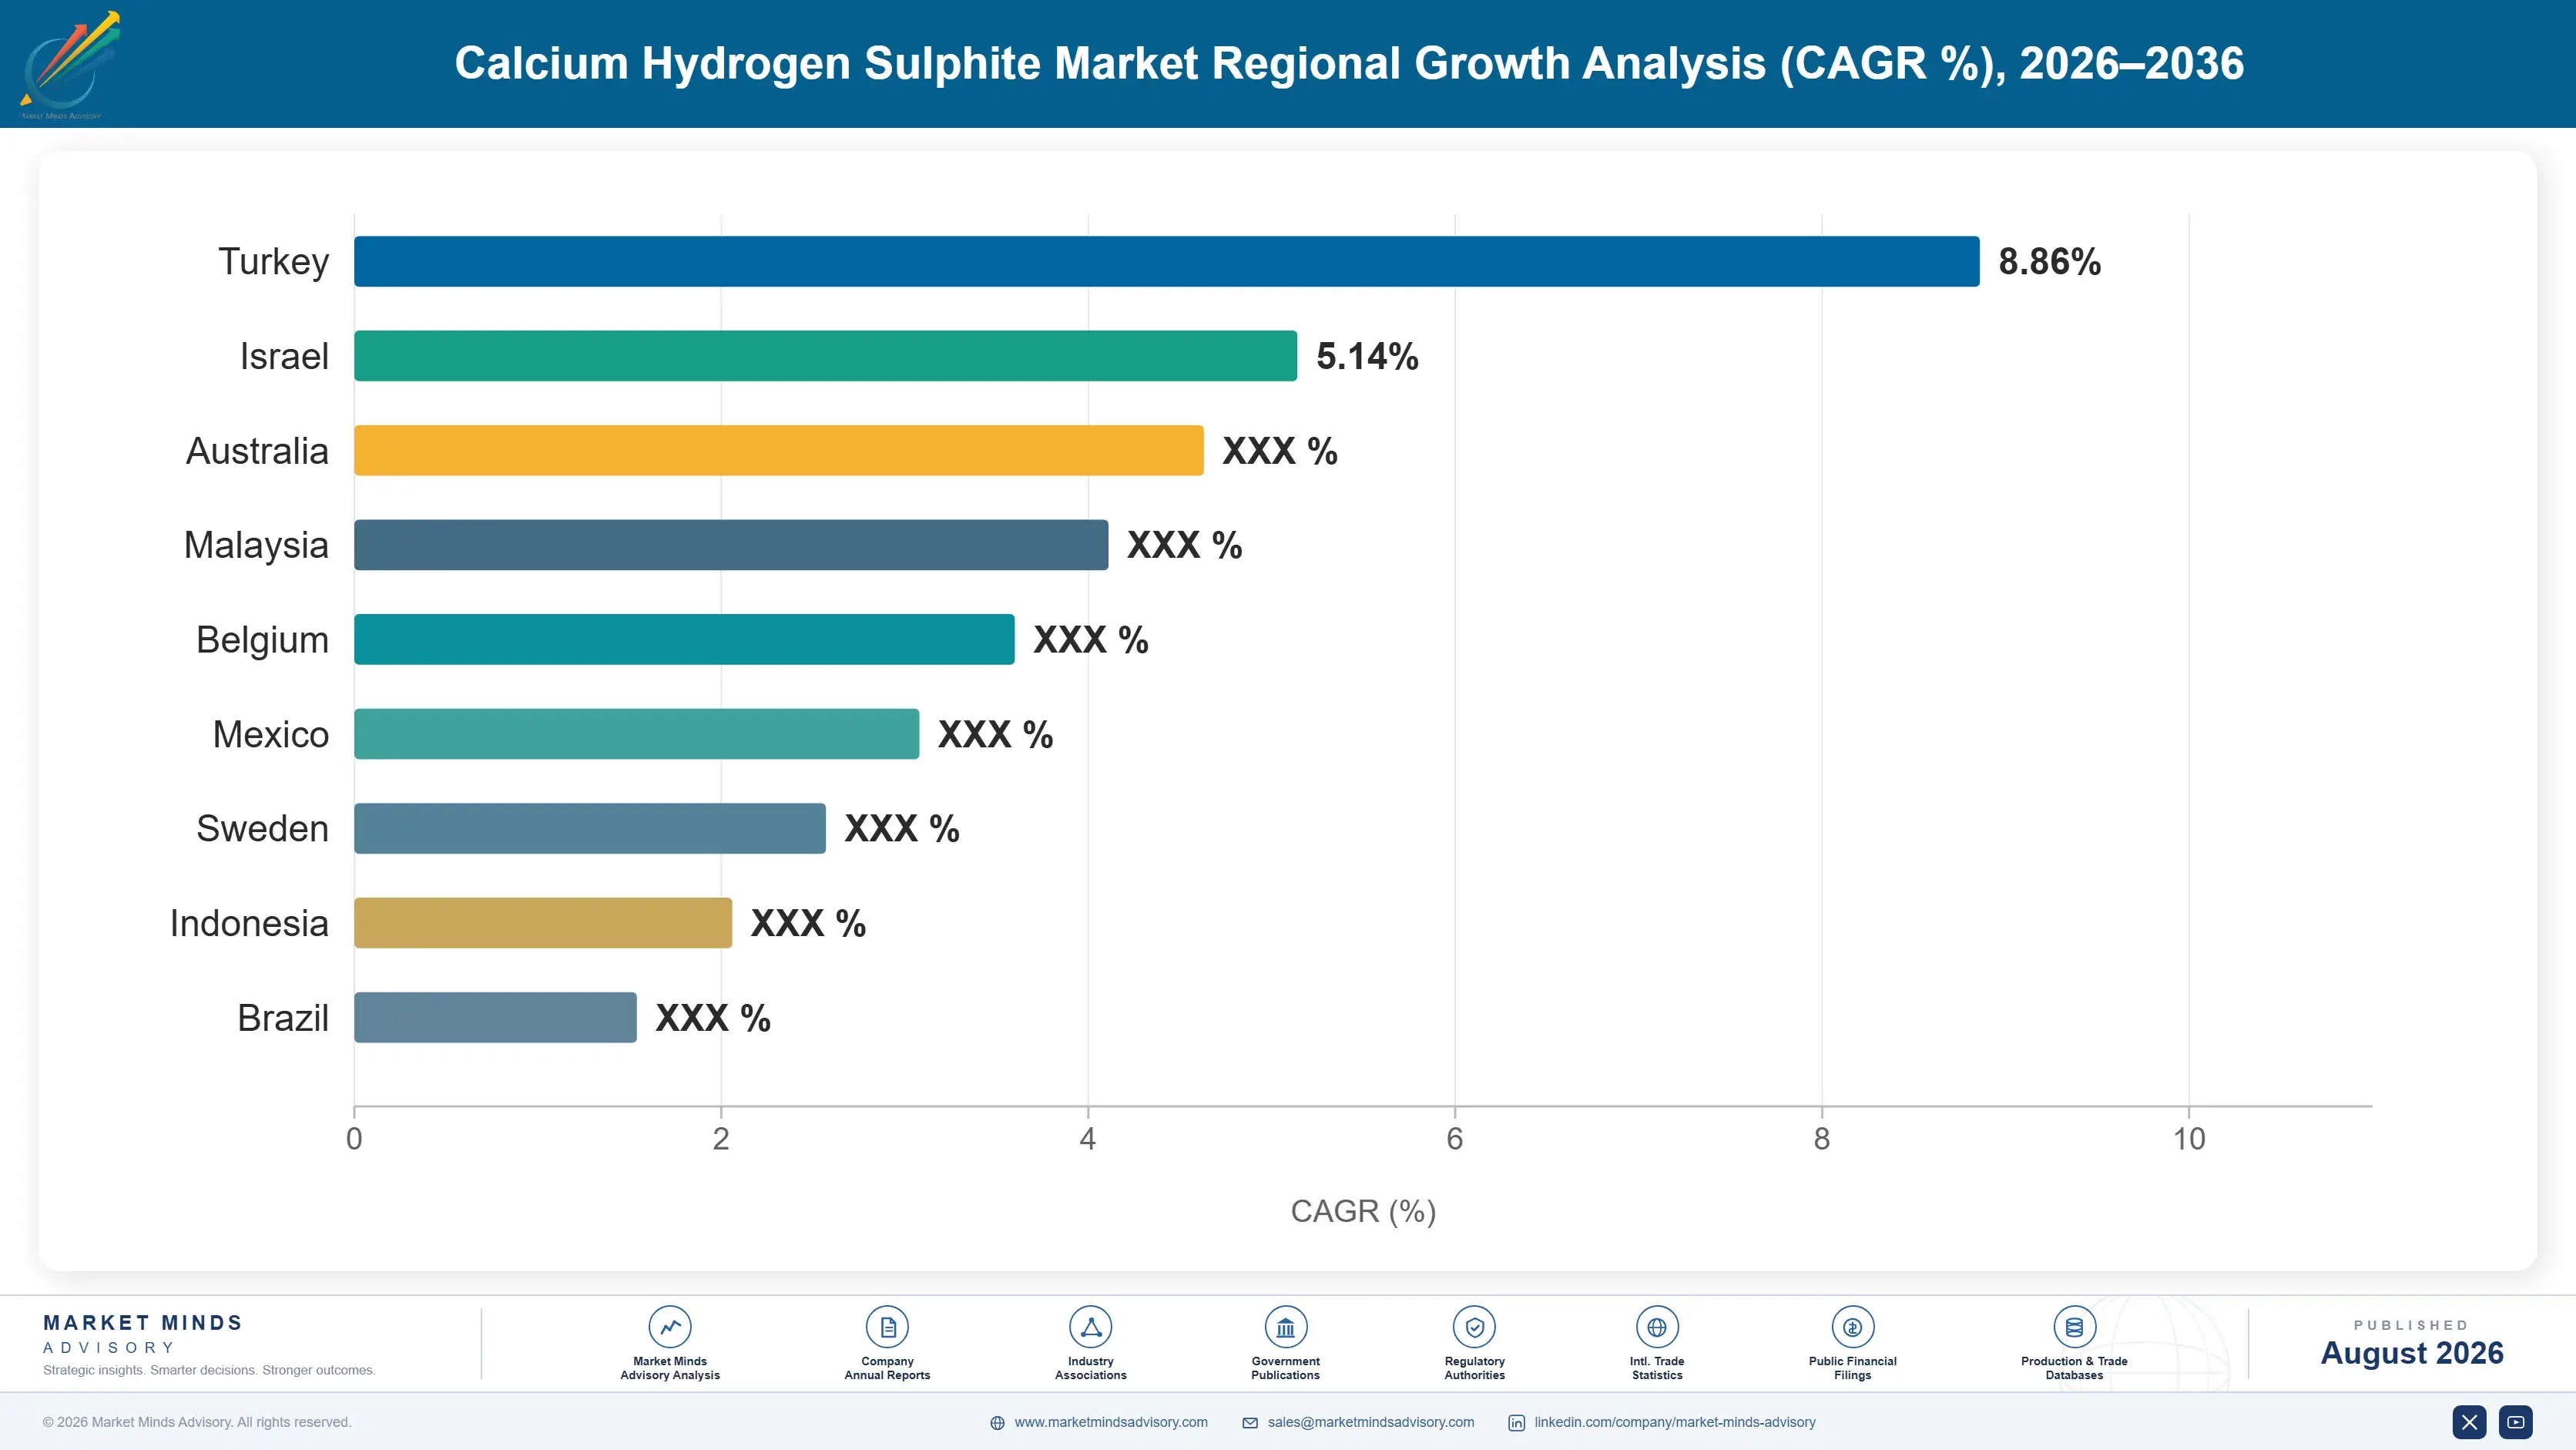
East Asia leads at 34%, above band, because Chinese paper production and municipal wastewater expansion both concentrate there. North America and Western Europe follow on water treatment. India grows fastest. Four regional shares sit outside their framework bands. Paper production and treatment capacity explain them.

East Asia

Thirty-four percent, above the framework band, and justified because Chinese paper and board production exceeds any other country by a wide margin while municipal wastewater treatment capacity has expanded faster there than anywhere else this century. Both consume bisulfite, one captively and one merchant. Chinese producers are numerous, regional, and rarely export, which fits the freight economics exactly. Japanese and Korean demand is smaller and weighted toward food and reagent grades. Growth at 5.5% runs above the market rate on wastewater discharge standards tightening steadily. Chinese producers compete inside overlapping radii around industrial clusters rather than nationally, which is why no domestic consolidation has occurred despite the scale involved. Freight arithmetic applies identically there.
Share: 34% | CAGR: 5.5% (2026 to 2036)

North America

Twenty percent, below the framework band because merchant demand follows treatment plants and mills rather than industrial output generally, and the mix here has shifted decisively from pulping toward water treatment. Sulfite mill closures removed captive and merchant volume across two decades, while municipal dechlorination requirements under discharge permitting grew steadily against that. Regional producers serve defined freight radii and rarely compete with each other. Growth at 4.2% sits near the market rate, with water treatment gains only modestly ahead of continuing pulping decline. Reverse osmosis pretreatment demand is growing along the southern and coastal states as reuse capacity expands, adding customers considerably less sensitive to price than municipal outfall users. Membrane operators contract differently.
Share: 20% | CAGR: 4.2% (2026 to 2036)
Regional intelligence for 5 additional markets available in the complete report: Western Europe, South Asia and Pacific, Latin America, Middle East and Africa, Eastern Europe. Contact sales@marketmindsadvisory.com.
calcium-hydrogen-sulphite-market-country-cagr-analysis-1787302672112

Radius, Grade And Feedstock Security

Captive generation covers 61% of production, freight radius caps at roughly 400 km, shelf life runs 90 days, and sulfur carries 44% of merchant cost. Value comes from siting inside demand clusters, from certified grades, and from feedstock security nobody else in the radius holds. Scale is worth remarkably little here. Density beats efficiency.

Site Capacity Inside Demand Clusters Rather Than Centrally

Delivered solution runs around nine percent active, so freight beyond roughly 400 km is paid mostly to move water and a nearer producer wins on landed cost regardless of plant efficiency. Concentration at 29% follows from that directly. A producer building central capacity and shipping outward is competing against physics rather than against competitors, and several have discovered this after commissioning. Distributed small plants beat one efficient large one in this market consistently. Demand density inside a radius decides plant viability more than the size of the plant does. Mapping it before siting avoids the problem entirely.
Market Impact: Freight radius caps near 400 km whe

Hold Food And Reagent Certification For Margin

Food grade grows at 5.4% against 4.6% for the market and prices considerably above technical grades, because certification, traceability, and heavy metal specification limits restrict who can supply it at all. The volumes are small and the margin per tonne is not. Producers treating certification as a compliance cost rather than a commercial asset are leaving the best pricing in the market to competitors who maintain it deliberately across their sites. Heavy metal specification limits are the practical barrier, and feedstock purity decides whether a site can qualify at all. Not every sulfur source passes.
Market Impact: Food grade grows at 5.4% every sing

Secure Sulfur Dioxide Feedstock Within The Radius

Sulfur dioxide carries roughly 44% of merchant production cost and is itself awkward to transport, so a producer without local sulfur burning capacity or a nearby smelter offgas source is exposed on the largest single cost line. Feedstock proximity matters as much as customer proximity in this business. Producers who secured smelter or refinery offgas arrangements hold a cost position inside their radius that no competitor can replicate without the same access. Feedstock proximity therefore belongs in the siting decision alongside demand density rather than being resolved afterwards. Most producers treat it as a purchasing question.
Market Impact: Sulfur carries roughly 44% of total

Sell Second Source Qualification To Membrane Operators

Bisulfite loses reducing capacity over roughly 90 days, so buyers cannot hold inventory as supply insurance the way they do with stable chemicals. Reverse osmosis operators face membrane destruction if dosing fails, which makes supply security worth far more to them than unit price. Qualifying as a second source inside the freight radius is a low-volume position that converts to full supply whenever the incumbent has an outage, and outages do happen. Qualification costs little and the position converts whenever the incumbent misses a delivery. Outages happen often enough to matter.
Market Impact: Shelf life limits inventory cover t

Who Controls the Margin Pool

Concentration is very low at 29% across the top five measured on merchant tonnes supplied, and the freight radius rather than any competitive weakness explains it. Producers hold positions inside roughly 400 km that no national competitor can profitably contest, so the market is a collection of local monopolies and duopolies rather than one contested arena. The leader to challenger gap is meaningless at national level and decisive within any given radius.
Competitive activity runs on three fronts. Feedstock proximity is the first and least visible, since sulfur dioxide carries 44% of merchant cost and is itself awkward to move any distance. Certification breadth is the second, where food and reagent grades price well above technical volumes. And second source qualification is the third, which matters more than usual because shelf life prevents buyers from stockpiling.

Pressure arrives from two directions. Sodium bisulfite competes directly where the receiving stream will not tolerate calcium hardness, and it ships at higher active concentration. And sulfite pulping closures keep removing demand clusters entirely rather than merely shrinking them. Rankings shift on plant siting decisions rather than on any commercial activity.
calcium-hydrogen-sulphite-market-company-positioning-matrix-1787302672637

Competitive Moat and Risk Dimensions

SOLVAY

Moat: Sulfur chemistry breadth and siting

Positions across sulfur derivative chemistry give feedstock flexibility and multiple sites inside separate demand radii, which is the only structure that works in a market where freight caps reach. Certification across food and technical grades at several plants widens what each site can serve. Neither advantage can be assembled quickly by a new entrant working from one location.
SOLVAY

Risk: Exposure to pulping demand decline

Demand clusters built around sulfite pulping disappear entirely when a mill closes rather than shrinking gradually, and closures have continued across North America and Western Europe for decades. A site positioned for a mill cluster has no alternative demand within its radius. Water treatment growth replaces the volume nationally without replacing it locally.
GRILLO-WERKE

Moat: Integrated sulfur dioxide production

Sulfur dioxide carries roughly 44% of merchant production cost and is awkward to transport, so integrated production behind the bisulfite plant removes the largest cost exposure and the largest supply risk simultaneously. Competitors buying sulfur dioxide from third parties carry both. That integration is expensive to replicate and pays continuously rather than cyclically.
GRILLO-WERKE

Risk: Concentration in European demand

Western European growth at 3.0% is the slowest of any region, reflecting discharge standards tightened earlier than elsewhere and treated volumes that are flat. A European-weighted position is weighted toward the slowest part of a slow market. Freight economics prevent serving faster growing regions from existing sites without building new ones there.

Players Tracked

Prominent Players

Solvay
Grillo-Werke
Esseco Group
BASF
Shandong Kailong New Material

Other Key Players

Nouryon
Arkema
Merck KGaA
Calabrian Corporation
Chemtrade Logistics
Otsuka Chemical
Mitsui Chemicals
Zhejiang Juhua
Hubei Xingfa Chemicals
Aditya Birla Chemicals
Tata Chemicals
Gujarat Alkalies and Chemicals
Jiangsu Kolod Food Ingredients
Thermo Fisher Scientific
American Elements

Recent Developments

JANUARY 2025

Producer commissions plant beside desalination cluster

A specialty chemical producer commissioned bisulfite capacity adjacent to a Gulf desalination cluster, siting the plant inside the delivery radius of several reverse osmosis facilities rather than serving them from an existing regional site. The investment was organic capacity construction rather than any acquisition or partnership arrangement.
Signal: Siting inside the freight radius remains t
APRIL 2025

Sulfite pulp mill closure removes regional demand cluster

A sulfite pulp mill ceased production, ending captive generation and the merchant top-up volume that had supported a nearby producer for years. The closure was a mill operator capacity decision rather than any supply dispute, regulatory action, or commercial arrangement involving the chemical producer. No replacement demand existed nearby.
Signal: Mill closures remove entire demand cluster
JULY 2025

Membrane operator qualifies second bisulfite supplier

A large reverse osmosis operator completed qualification of a second bisulfite supplier within its delivery radius, citing the ninety day shelf life that prevents holding inventory as supply insurance. The qualification was internal supply risk management rather than any dispute or performance failure by the incumbent supplier.
Signal: Short shelf life pushes buyers toward qual

Sulfur, Lime and Delivery

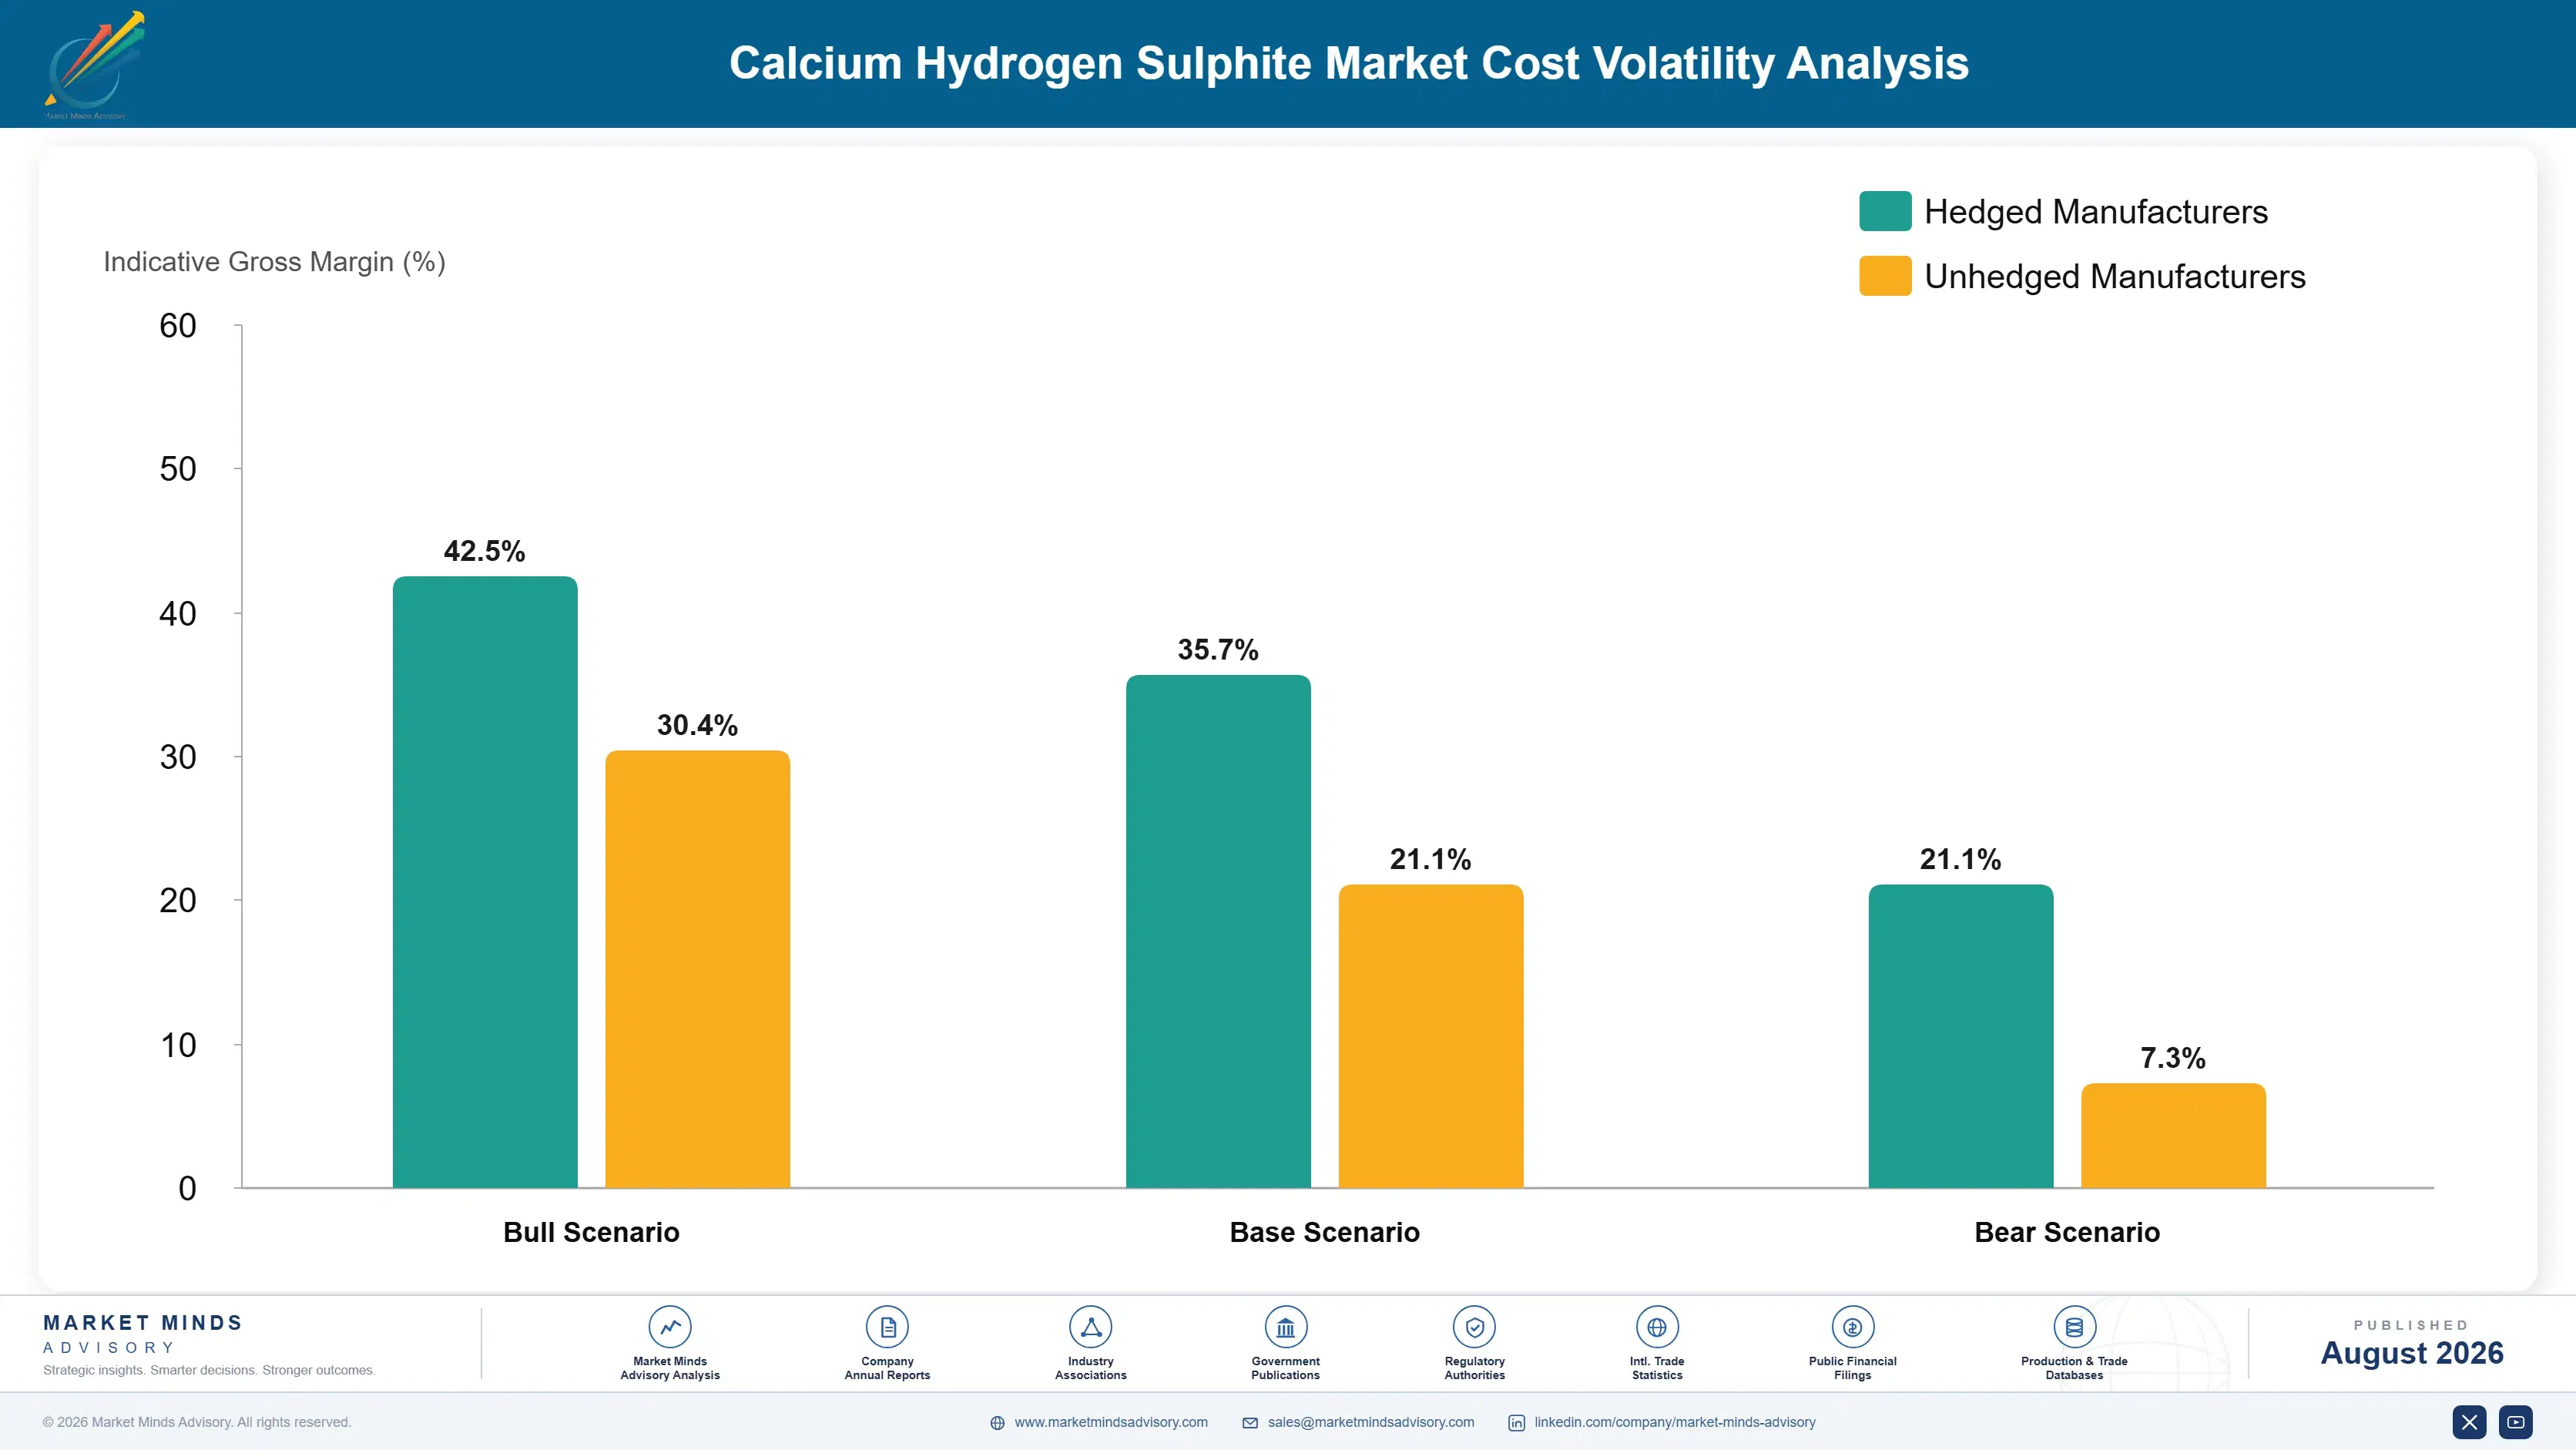
Merchant production cost divides between sulfur dioxide feedstock at roughly 44%, lime or limestone near 17%, absorption energy and process utilities around 12%, outbound delivery about 15%, and storage, testing, labour, and overhead the balance. Sulfur pricing follows refinery and smelter output rather than any demand from this market, and delivery cost rises steeply with distance because the product is mostly water.
Sulfur pricing moved sharply through 2022 as refinery run cuts and fertiliser demand tightened availability, and several diversified chemical producers disclosed sulfur derivative input cost pressure in filings covering that year. Lime pricing rose separately on energy costs affecting kiln operation. Neither exposure could be passed through quickly, since regional contracts in this market are typically annual and negotiated against local competition rather than input indices.

The competitive disadvantage mechanism runs through feedstock proximity rather than through purchasing scale. A producer with integrated sulfur burning or a nearby smelter offgas source holds a cost position competitors inside the same radius cannot match, since sulfur dioxide is itself expensive to transport any distance. Producers buying sulfur dioxide from third parties carry both the price exposure and the supply risk in full.
calcium-hydrogen-sulphite-market-cost-volatility-analysis-1787302672833

Integrate sulfur dioxide generation behind the bisulfite plant

Sulfur dioxide carries roughly 44% of merchant production cost and transports poorly, so buying it from a third party means carrying both the price exposure and a supply risk with no local alternative. Integrated sulfur burning or a smelter offgas arrangement removes both at once. The capital is significant and the payback runs continuously rather than depending on

Contract lime supply against kiln energy indexation

Lime and limestone carry around 17% of production cost and move with kiln energy pricing rather than with any chemical market, which makes the exposure genuinely uncorrelated with what customers will accept. Indexed lime contracts shift that to a supplier better placed to manage it. Regional lime producers resist indexation and accept it more readily on multi-year volume commitments.

Optimise delivery routing across the served radius

Outbound delivery carries about 15% of cost and rises steeply with distance because the product is roughly nine percent active by weight. Route density inside the served radius matters more than fleet efficiency, since a full tanker serving three nearby customers beats an efficient one serving a distant single site. Producers who mapped demand density before siting rarely

Portfolio Architecture for Margin Defence

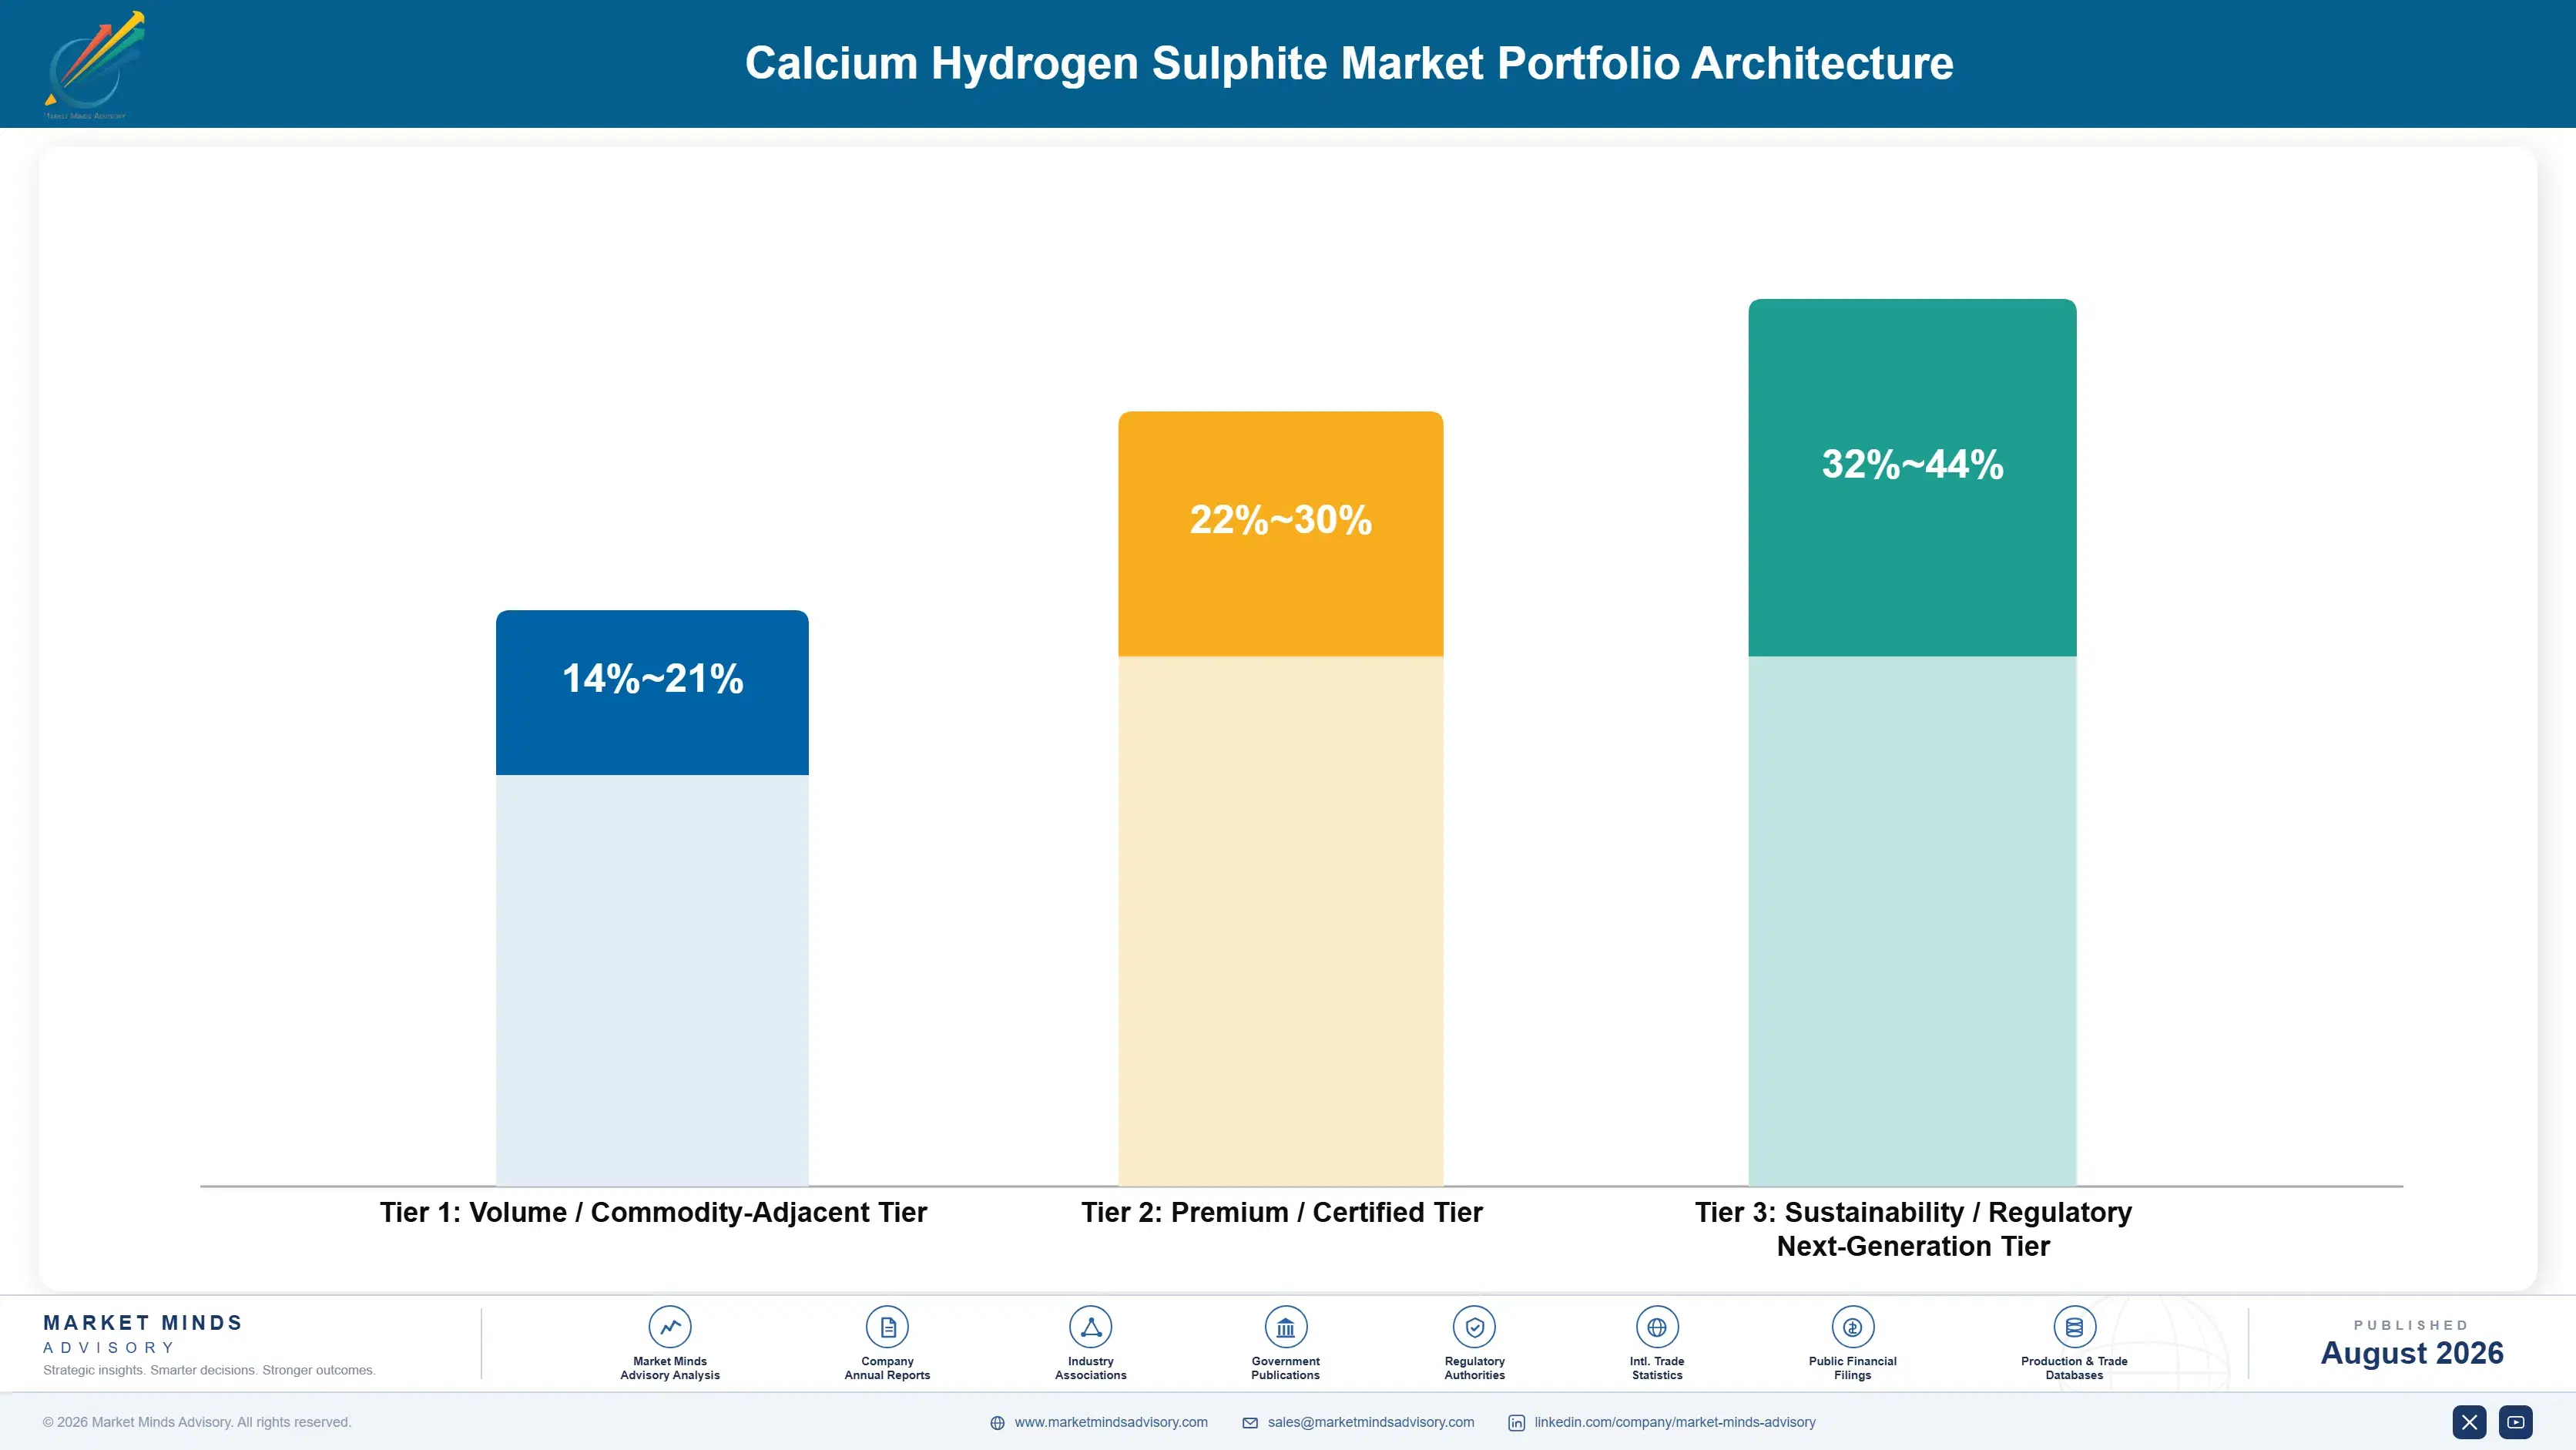
Three tiers describe this business and the spread follows certification rather than volume. Technical and pulping liquor grades sit at the bottom, where the product is a commodity reducing agent competing on delivered price inside a radius. Water treatment grade occupies the middle. Food and reagent grades sit at the top, where certification, traceability, and heavy metal specification limits restrict the supplier field considerably.
The tension is that the bottom tier carries the volume that keeps an absorption plant running economically, and that volume is exactly what disappears when a mill closes. A producer weighted there watches its addressable demand vanish rather than shrink. One weighted toward food and reagent grades holds margin on volumes too small to fill a plant, and has to serve technical demand anyway to make the site work.

High-value pools concentrate where failure is expensive rather than where purity is highest. Reverse osmosis pretreatment is the clearest case, since a dosing failure destroys a membrane train worth far more than a year of chemical supply, and that makes those buyers the least price sensitive in the market. Food grade is the second such pool, where certification restricts supply far more than production capability does.

Volume / Commodity-Adjacent Tier

Technical grade solution and pulping liquor grade competing on delivered price inside a freight radius. Volume keeps the absorption plant running economically and disappears entirely when a nearby mill closes.
Gross Margin: 14-21%

Premium / Certified Tier

Water treatment grade for municipal dechlorination, industrial outfalls, and reverse osmosis pretreatment. Membrane operators are the least price sensitive buyers in the market because dosing failure is expensive. Dosing runs continuously against measured residual.
Gross Margin: 22-30%

Sustainability / Regulatory / Next-Generation Tier

Food grade and reagent grade where certification, traceability, and heavy metal specification limits restrict supply. Best margin per tonne by a clear distance and volumes far too small to fill a plant.
Gross Margin: 32-44%
calcium-hydrogen-sulphite-market-portfolio-architecture-1787302673333

Radii, Dosing and Consents

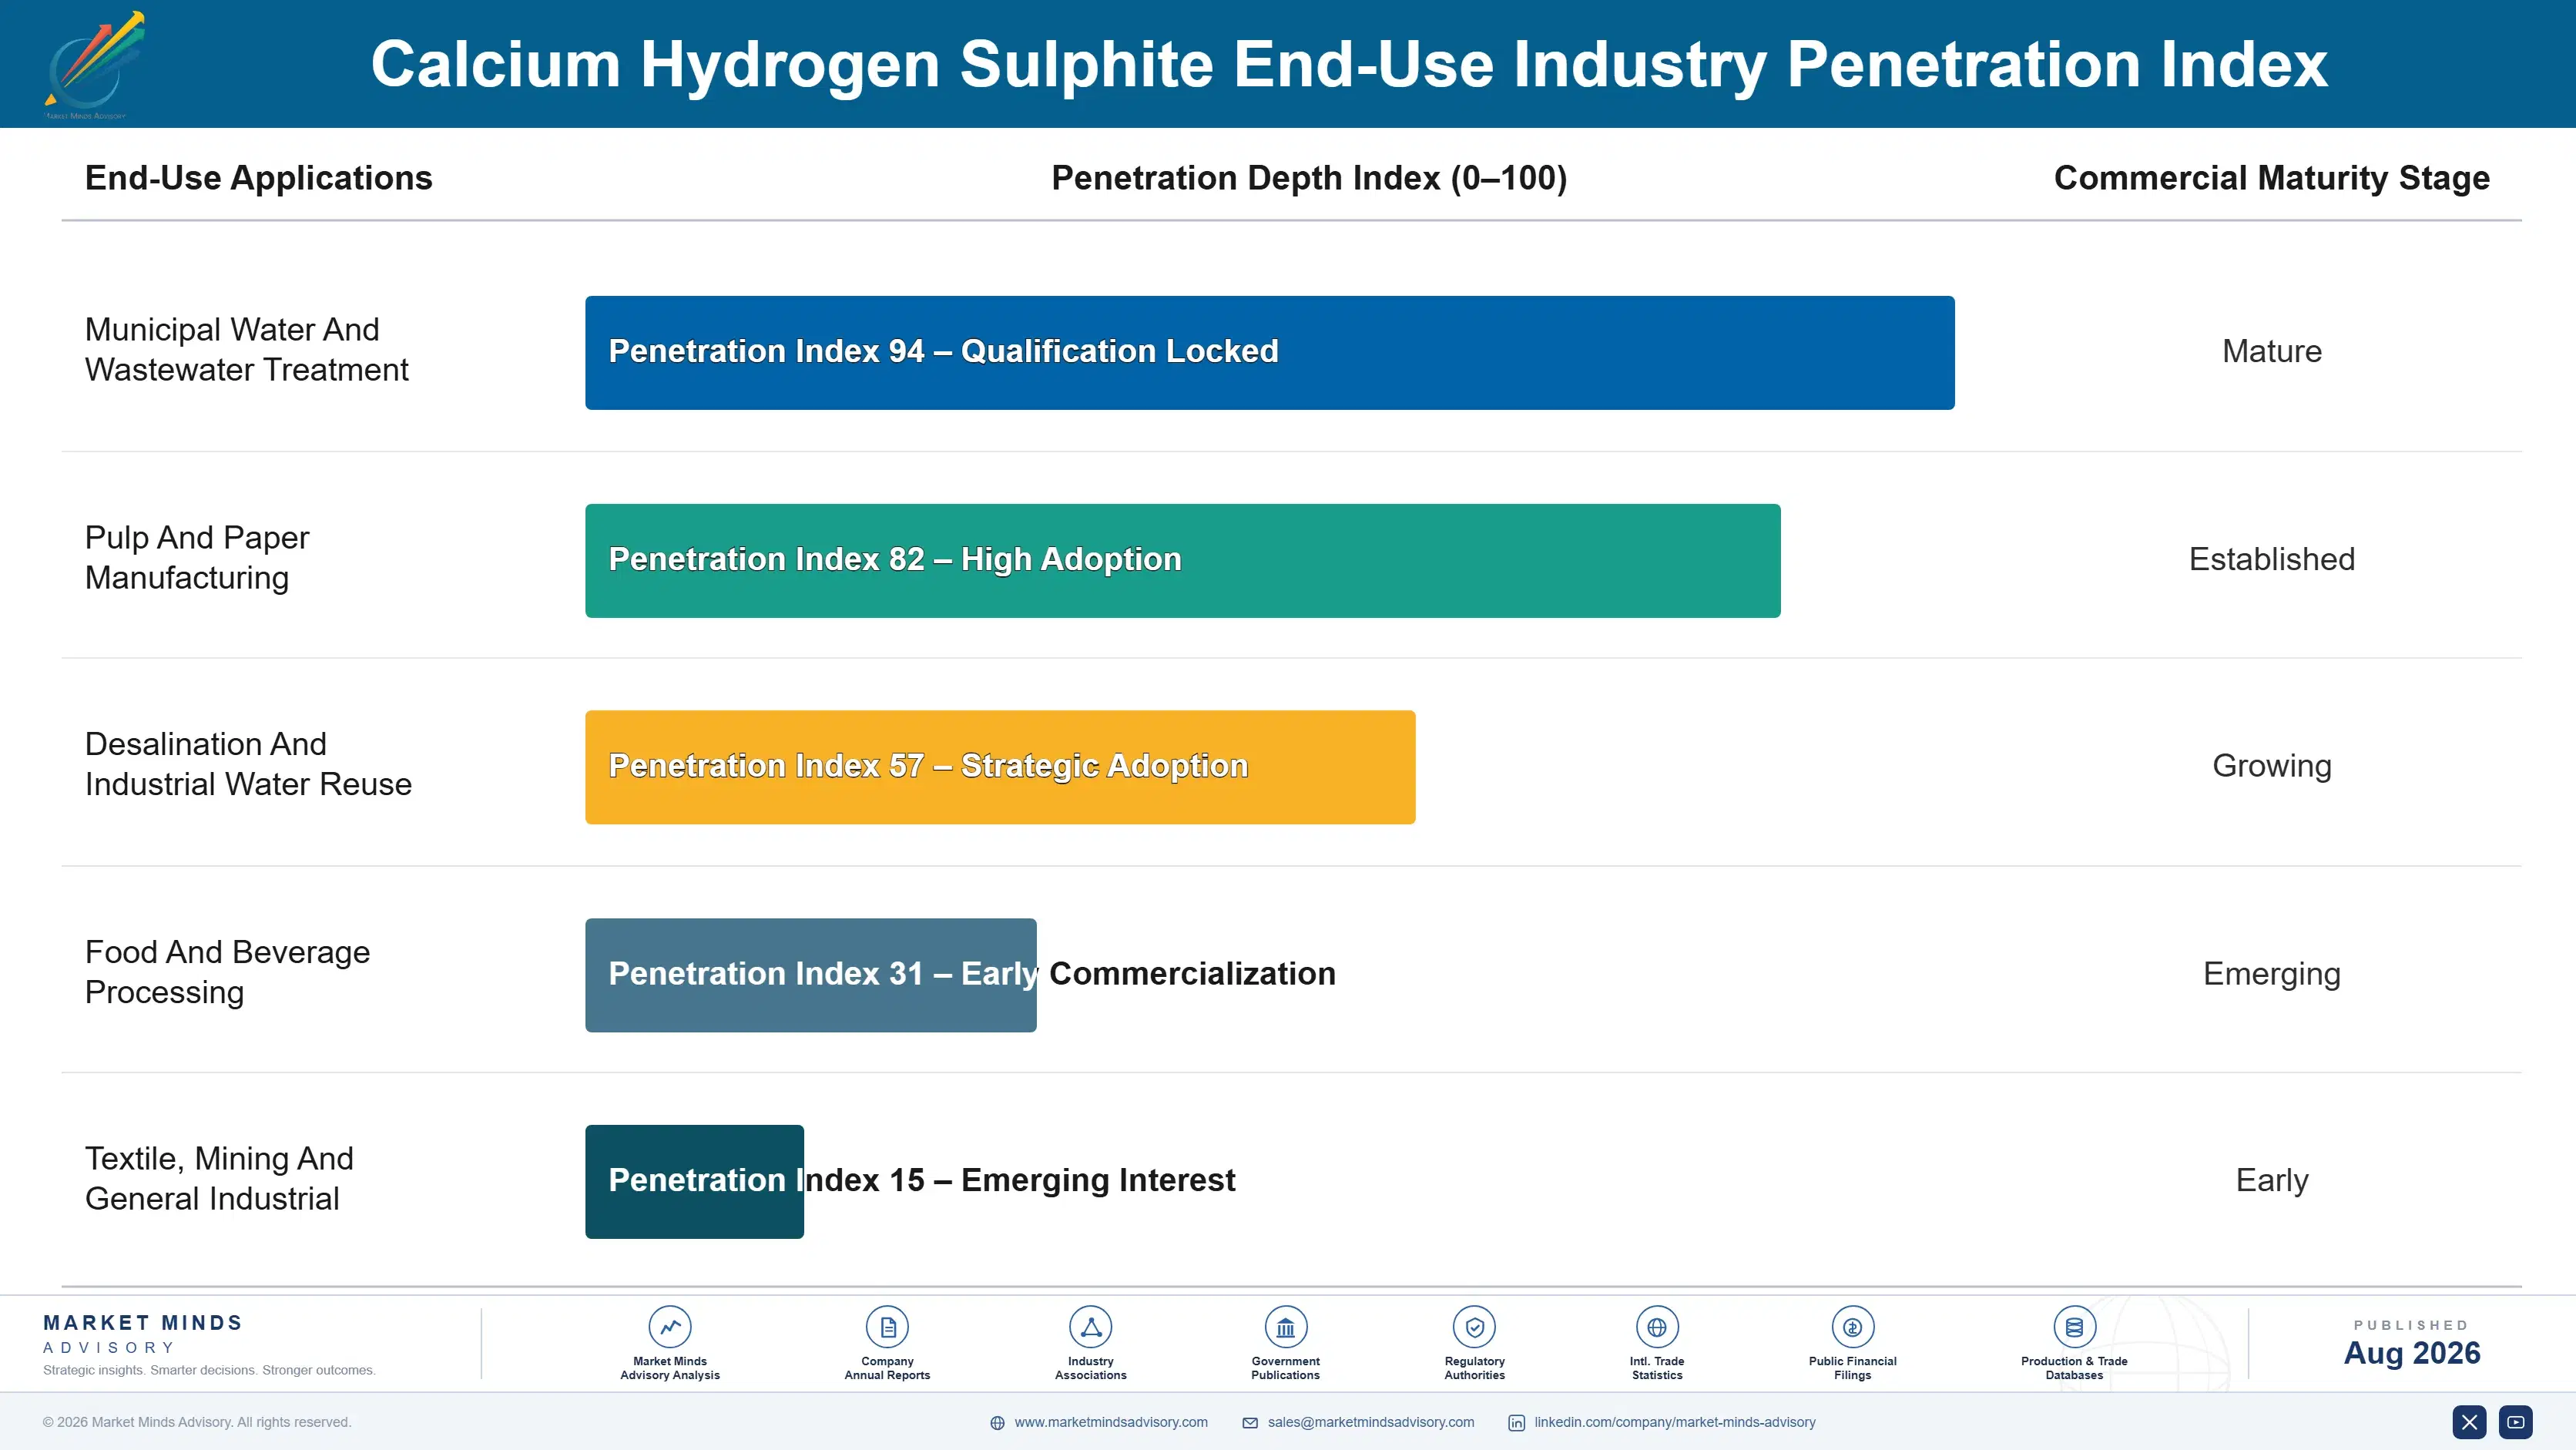
Demand behaves as a continuous dosing requirement rather than as any project or replacement cycle, which makes volumes unusually predictable once a customer is supplied. A water treatment plant doses against flow and residual chlorine continuously, and consumption varies with throughput rather than with any purchasing decision. That predictability is the compensation for a market where the reachable customer base is fixed by geography.
Stickiness runs through proximity and qualification rather than through contracts. Inside a freight radius a customer has few alternatives, and shelf life prevents holding inventory long enough to bridge a switch. Reverse osmosis operators are the firmest, since dosing failure destroys membranes. Municipal outfall users are looser and do retender on price, though usually among the same two or three producers who can actually deliver.

Buyer profiles shifted as pulping declined and water treatment grew. The earlier buyer was a mill purchasing manager treating bisulfite as one line in a large chemical spend. The current conversation is more often with a water treatment plant operator or a membrane system engineer who cares about delivered consistency and supply security considerably more than about price per tonne.
calcium-hydrogen-sulphite-market-end-use-penetration-index-1787302673830

What We Would Tell a Board

These are among the four positions where our research anticipates prominent divergence between winners and laggards over the coming forecast period. Each is grounded in the demand model, the regulatory perimeter, and the announced capacity pipeline.
01 / PLANT SITING DISCIPLINE

Site inside demand clusters or do not build

Delivered solution runs around nine percent active, so freight beyond roughly 400 km is paid mostly to move water and a nearer producer wins on landed cost regardless of any plant efficiency advantage. Concentration at 29% across the top five follows directly from that physical constraint rather than from any competitive failure or shortage of capital in the industry. A central plant shipping outward is competing against freight arithmetic rather than against competitors, and several producers have discovered exactly that only after commissioning the capacity.
02 / FEEDSTOCK PROXIMITY SECURING

Sulfur access decides your cost position

Sulfur dioxide carries roughly 44% of merchant production cost and transports poorly over any distance, which makes local generation or a nearby smelter offgas arrangement worth more than any operating improvement available inside the plant. Producers buying it from third parties carry both the price exposure and the supply risk together, with no local alternative available to them when either one moves. Feedstock proximity therefore belongs in the siting decision alongside demand density, and it matters just as much as customer proximity whenever new capacity is being placed anywhere.
03 / CERTIFICATION PORTFOLIO BUILDING

Certification is the margin, not a compliance cost

Food and reagent grades price well above technical volumes because certification, traceability, and heavy metal specification limits genuinely restrict who is able to supply them at all. Food grade grows at 5.4% against 4.6% for the wider market, on volumes that are far too small to fill an absorption plant by themselves at any point. Producers treating certification as an overhead cost are handing the best pricing available in this market to competitors who maintain it deliberately across every one of their sites.
04 / PULPING EXPOSURE REDUCTION

Mill clusters vanish rather than gradually shrinking

Sulfite pulping capacity has closed or converted across North America and Western Europe for decades, and each closure removes captive generation and the merchant volume around it at the same time. Roughly 61% of total production remains captive and concentrated in exactly those mills, which is why national volume figures conceal what is happening inside any given radius. A site positioned for a mill cluster has no alternative demand at all inside its radius, so that exposure has to be reduced well before the closure is announced rather than afterwards.

Engagement Snapshot From the Field

A live engagement with an industry participant carrying material or product regulatory and market exposure ahead of a defining policy shift, showing how our research translates into a defensible multi-year portfolio strategy.
MARKET MINDS ADVISORY · CLIENT ENGAGEMENT SUMMARY
Calcium Hydrogen Sulphite Producer Strategic Portfolio Review and Transition Roadmap 2026·Investment Scenario on Calcium Hydrogen Sulphite Exposure Evaluation 2025-26
CLIENT PROFILE
A regional producer of sulfite and bisulfite chemicals with approximately 62 million dollars in annual revenue (client-reported, unverified by MMA), operating two absorption plants serving industrial and municipal customers across a single country. Technical grade carried most of the volume, food certification was held at one site only, and sulfur dioxide was purchased from a third party at both plants.
STRATEGIC CHALLENGE
A sulfite pulp mill inside one plant's delivery radius had announced closure, removing roughly a quarter of that site's volume, and the board wanted to know whether to relocate capacity, seek new demand within the same radius, or exit the site altogether. Nobody had mapped what demand remained inside that radius.
MMA APPROACH
We mapped demand density inside both freight radii by customer type and application. Municipal discharge consent schedules were reviewed for pending tightening that would add dechlorination volume. Sulfur dioxide sourcing options were assessed at each location, and food certification economics were modelled against the second site's addressable demand. Relocation options were then costed against demand density.
KEY FINDINGS
  1. Municipal dechlorination demand inside the affected radius was scheduled to grow on published consent tightening, replacing roughly two thirds of the lost mill volume within four years.
  2. A nearby smelter had offgas capture capacity uncontracted, which would have removed a substantial share of the site's largest single production cost line.
  3. Food certification at the second site would have addressed processor demand inside its radius that the client had never quoted, at pricing far above technical grade.
  4. Relocating capacity was uneconomic, since no alternative location offered demand density comparable to the existing site even after the mill closure. Demand density was the binding constraint everywhere.
CLIENT PROFILE
A regional producer of sulfite and bisulfite chemicals with approximately 62 million dollars in annual revenue (client-reported, unverified by MMA), operating two absorption plants serving industrial and municipal customers across a single country. Technical grade carried most of the volume, food certification was held at one site only, and sulfur dioxide was purchased from a third party at both plants.
STRATEGIC CHALLENGE
A sulfite pulp mill inside one plant's delivery radius had announced closure, removing roughly a quarter of that site's volume, and the board wanted to know whether to relocate capacity, seek new demand within the same radius, or exit the site altogether. Nobody had mapped what demand remained inside that radius.
MMA APPROACH
We mapped demand density inside both freight radii by customer type and application. Municipal discharge consent schedules were reviewed for pending tightening that would add dechlorination volume. Sulfur dioxide sourcing options were assessed at each location, and food certification economics were modelled against the second site's addressable demand. Relocation options were then costed against demand density.
KEY FINDINGS
  1. Municipal dechlorination demand inside the affected radius was scheduled to grow on published consent tightening, replacing roughly two thirds of the lost mill volume within four years.
  2. A nearby smelter had offgas capture capacity uncontracted, which would have removed a substantial share of the site's largest single production cost line.
  3. Food certification at the second site would have addressed processor demand inside its radius that the client had never quoted, at pricing far above technical grade.
  4. Relocating capacity was uneconomic, since no alternative location offered demand density comparable to the existing site even after the mill closure. Demand density was the binding constraint everywhere.
RECOMMENDED STRATEGY
Phase 1: Phase 1 (months one to nine): open smelter offgas discussions and quote municipal dechlorination volumes ahead of the pending consent changes. Phase 2: Phase 2 (months nine to twenty-four): certify the second site for food grade and quote processor demand inside its existing delivery radius. Phase 3: Phase 3 (months twenty-four to forty): reassess the affected site only after consent-driven volume has been contracted or declined. Judge the site on contracted volume.
OUTCOME
The site closure was shelved. A smelter offgas supply agreement was signed within three quarters, and municipal dechlorination contracts replaced roughly half of the lost mill volume within the first year (client-reported, unverified by MMA). Food certification work at the second site began in the following quarter.

Frequently Asked Questions

Foundational context covering the market sizes, CAGR, scope, country, region and competition that inform every finding below. This section is provided to cover basics and most often pre-purchase conversations, answered from the MMA Primary Research Dataset.

What is the current size of the Calcium Hydrogen Sulphite Market?

The merchant market is valued at USD 0.38 billion in 2025, rising to USD 0.40 billion in 2026. Captive volumes generated and consumed at the same facility are quantified separately and excluded from that figure.

How large will the Calcium Hydrogen Sulphite Market be by 2036?

MMA forecasts USD 0.63 billion by 2036, an increase of USD 0.23 billion over the 2026 base. That represents an expansion multiple of 1.58 times across the forecast period.

What is the CAGR for the Calcium Hydrogen Sulphite Market 2026 to 2036?

The base case CAGR is 4.6%, with a bull case of 5.8% and a bear case of 3.4%. The historical rate from 2020 to 2025 was 4.1%, held down by sulfite pulping closures.

Which segment is growing fastest?

Water treatment grade at 6.9%, exactly 1.50 times the market rate. Growth follows discharge consent tightening on residual chlorine rather than any increase in treated water volume.

Who are the major companies in the Calcium Hydrogen Sulphite Market?

Solvay, Grillo-Werke, Esseco Group, BASF, and Shandong Kailong New Material lead on merchant tonnes supplied. The top five hold only 29%, because freight economics keep supply regional.

Which country is growing fastest?

India at 7.1%, driven by municipal wastewater investment and desalination capacity requiring reverse osmosis pretreatment. Indian producers build close to industrial clusters rather than as national suppliers.

Report Segmentation Architecture

The full report scope spans multiple orthogonal segmentation dimensions, with cross-tabulated demand data provided for each dimension pair. Coverage extends further to regional breakdowns, trend trajectories, and the competitive detail needed to support segment-level decision-making.

By Product Grade And Specification

  • Technical Grade Solution
  • Pulping Liquor Grade
  • Water Treatment Grade
  • Food Grade
  • Reagent And Analytical Grade

By End-Use Industry

  • Municipal Water And Wastewater Treatment
  • Pulp And Paper Manufacturing
  • Desalination And Industrial Water Reuse
  • Food And Beverage Processing
  • Textile, Mining And General Industrial

By Commercial Model

  • Bulk Tanker Direct Supply
  • Drum And Intermediate Container Supply
  • Toll Production For Third Parties
  • Distributor And Regional Reseller Channels
  • On-Site Generation Equipment Supply Arrangements

By Region

  • East Asia
  • North America
  • Western Europe
  • South Asia and Pacific
  • Latin America
  • Middle East and Africa
  • Eastern Europe

Scope, Methodology, and Coverage

Every figure in this report is reproducible from documented input assumptions. The scope below maps the historical period, the forecast horizon, the segmentation dimensions, and the countries covered, alongside the underlying primary and qualitative methodology.
Historical Period
2020 to 2025
Forecast Period
2026 to 2036
Base Year
2025 (USD billions; MMA Primary Research Dataset, August 2026)
Market Definition
This market comprises calcium hydrogen sulphite supplied as aqueous solution and related calcium bisulfite preparations, measured at producer revenue across bulk tanker, packaged container, toll production, distribution, and supply arrangement channels. Coverage spans technical grade solution, pulping liquor grade, water treatment grade, food grade, and reagent and analytical grade material. Sodium bisulfite, sodium metabisulfite, ammonium bisulfite and other non-calcium sulfite chemistries, sulfur dioxide sold as compressed gas or liquid, calcium sulfite and calcium sulfate produced as by-products or from flue gas desulfurisation, on-site generation and absorption equipment, and sulfite pulping process technology licensing fall outside scope. Captive volumes generated and consumed within the same facility are quantified separately and excluded from market value.
Quantitative Units
USD billions (current prices); merchant tonnes supplied; price per tonne of active reducing agent; delivered solution concentration
Segmentation Dimensions
By Product Grade And Specification; By End-Use Industry; By Commercial Model; By Region
Regions Covered
East Asia, North America, Western Europe, South Asia and Pacific, Latin America, Middle East and Africa, Eastern Europe
Countries Covered
China, Japan, South Korea, United States, Canada, Mexico, Germany, Sweden, Finland, Austria, France, Italy, India, Australia, Indonesia, Brazil, Chile, Saudi Arabia, United Arab Emirates, South Africa, Poland, Czechia, Russia, and additional markets relevant to this sector
Key Companies Profiled
Solvay, Grillo-Werke, Esseco Group, BASF, Shandong Kailong New Material, Nouryon, Arkema, Merck KGaA, Calabrian Corporation, Chemtrade Logistics, Otsuka Chemical, Mitsui Chemicals, Zhejiang Juhua, Hubei Xingfa Chemicals, Aditya Birla Chemicals, Tata Chemicals, Gujarat Alkalies and Chemicals, Jiangsu Kolod Food Ingredients, Thermo Fisher Scientific, American Elements
Quantitative Methodology
Primary survey, n=3,800 respondents, Q4 2025, six countries; demand-side model with trade association cross-validation
Qualitative Methodology
47 expert interviews, Q4 2025; applied to validate demand model assumptions, identify emerging dynamics, and assess competitive positioning
Report Format
PDF and XLSX data workbook (Word format preview document)
Publisher
Market Minds Advisory
Report Code
MMA-2026-CHM-791
Published
August 2026
Contact
sales@marketmindsadvisory.com | www.marketmindsadvisory.com

Purchase the full Calcium Hydrogen Sulphite Market Report (2026 to 2036).

The full report sizes merchant calcium hydrogen sulphite across five product grades, five end-use industries, five commercial models, and seven regions, with captive generation quantified separately at every step. Freight radius economics are modelled by delivered concentration and route density, since those determine which customers any given plant can profitably reach. Sulfur dioxide feedstock sourcing is assessed by site and by proximity option. Competitive profiling covers twenty producers on merchant tonnes supplied, and certification breadth is assessed separately from production capability. Regional demand is built from treatment plant and mill locations rather than industrial output.
Captive generation quantified separately from merchant market value
Freight radius economics modelled by concentration and route density
Sulfur dioxide feedstock sourcing assessed by site and proximity
Discharge consent tightening schedules mapped against dechlorination demand
Certification breadth assessed separately from underlying production capability
Sulfite pulping closure exposure quantified by individual demand cluster

Built For The People Who Decide

From boardroom strategy to bench-side execution, this report is read cover-to-cover by leaders shaping the next decade of their industry, turning demand scenarios, market dynamics and valuation benchmarks into decisions.
CXOs/ Presidents/ VPs/ Managers
M&A and Corporate Development
Strategy Teams and R&D Heads
Procurement and Product Directors
Regulatory and Compliance Leaders
Investor Relations and Equity Analysts