Market Minds Advisory
Battery Energy Storage Systems (BESS) Market

Battery Energy Storage Systems (BESS) Market: Battery Energy Storage Systems: Grid Flexibility Becomes A Priced Commodity

A commercial reading of grid-scale and distributed storage, where frequency regulation and capacity payments now rival energy arbitrage as revenue, Chinese cell manufacturers set global pricing, and safety incidents keep testing regulatory patience.

Lead Analyst

Gabriel Dias

Published

August 2026

Make Smarter Decisions with Customized Research Insights

Request a free sample report and evaluate market opportunities, growth trends, and competitive dynamics relevant to your business needs.

2025 MARKET VALUE$45.2BMarket Size 2025
2036 FORECAST VALUE$154.2BBase Case , 2026 to 2036
CAGR 2026 TO 203611.8 %Bull 13.0% / Bear 10.5%
INCREMENTAL OPPORTUNITY$103.6BNet 10- year value creation
EXPANSION MULTIPLE3.05x2036 value over 2026 base
Strategic Levers
M&A Pipeline
Regional Outlook
Country Rankings
Competitive Intelligence
Segmental Deep-dive
Call-Us : 91 93563 13602

Executive Snapshot and Market Trajectory.

Storage used to mean backup power sitting idle most of the year, and that framing is dead. Batteries now earn revenue every hour of the day, and the operators who understand that shift are the ones capturing the margin left on the table by everyone still pricing storage as insurance.
The market stands at USD 45.2 billion in 2025 and reaches USD 154.16 billion by 2036 at a 11.8% CAGR. Grid ancillary services and frequency regulation storage grow fastest at 15.5%, about 1.31 times the overall rate, as grid operators pay premium rates for response speed no thermal generator can match. East Asia holds 30% of value on Chinese manufacturing scale, while India posts the quickest national growth at 16.8% on renewable integration mandates.
Concentration is moderate, with the top five holding roughly 48% of revenue, spanning integrated battery manufacturers and dedicated system integrators competing on quite different commercial models entirely. Two forces reshape the field now. Revenue stacking across multiple grid services has become the defining skill separating profitable operators from those still selling single-purpose capacity, and safety incidents at grid-scale sites keep triggering regulatory reviews that slow permitting considerably.
Market Definition
The battery energy storage systems market covers rechargeable battery-based storage systems, including cells, modules, power conversion equipment, and thermal management, deployed at utility, commercial, and residential scale to store and dispatch electricity. Pumped hydro, compressed air, and hydrogen storage technologies, along with electric vehicle traction batteries, are excluded.
Base Year Value
$45.2B in 2025 (MMA Primary Research Dataset, August 2026)
Forecast Period
2026 to 2036, eleven discrete annual values
CAGR
11.8% base case. Bull 13.0%. Bear 10.5%.
Fastest Growth Segment
Grid Ancillary Services and Frequency Regulation Storage: 15.5% CAGR
Fastest Growth Country
India: 16.8% CAGR
Fastest Growth Region
South Asia and Pacific: 13.9% CAGR
Largest Region
East Asia: 30% of 2025 global value
Market Leaders
CATL, BYD, Tesla Energy, Fluence Energy, LG Energy Solution. Source: MMA Analysis based on company annual reports.
Primary Survey
n=3,800 procurement and R&D decision-makers, Q4 2025, six countries
Methodology
Demand-side build-up, cross-validated against public data, 47 expert interviews

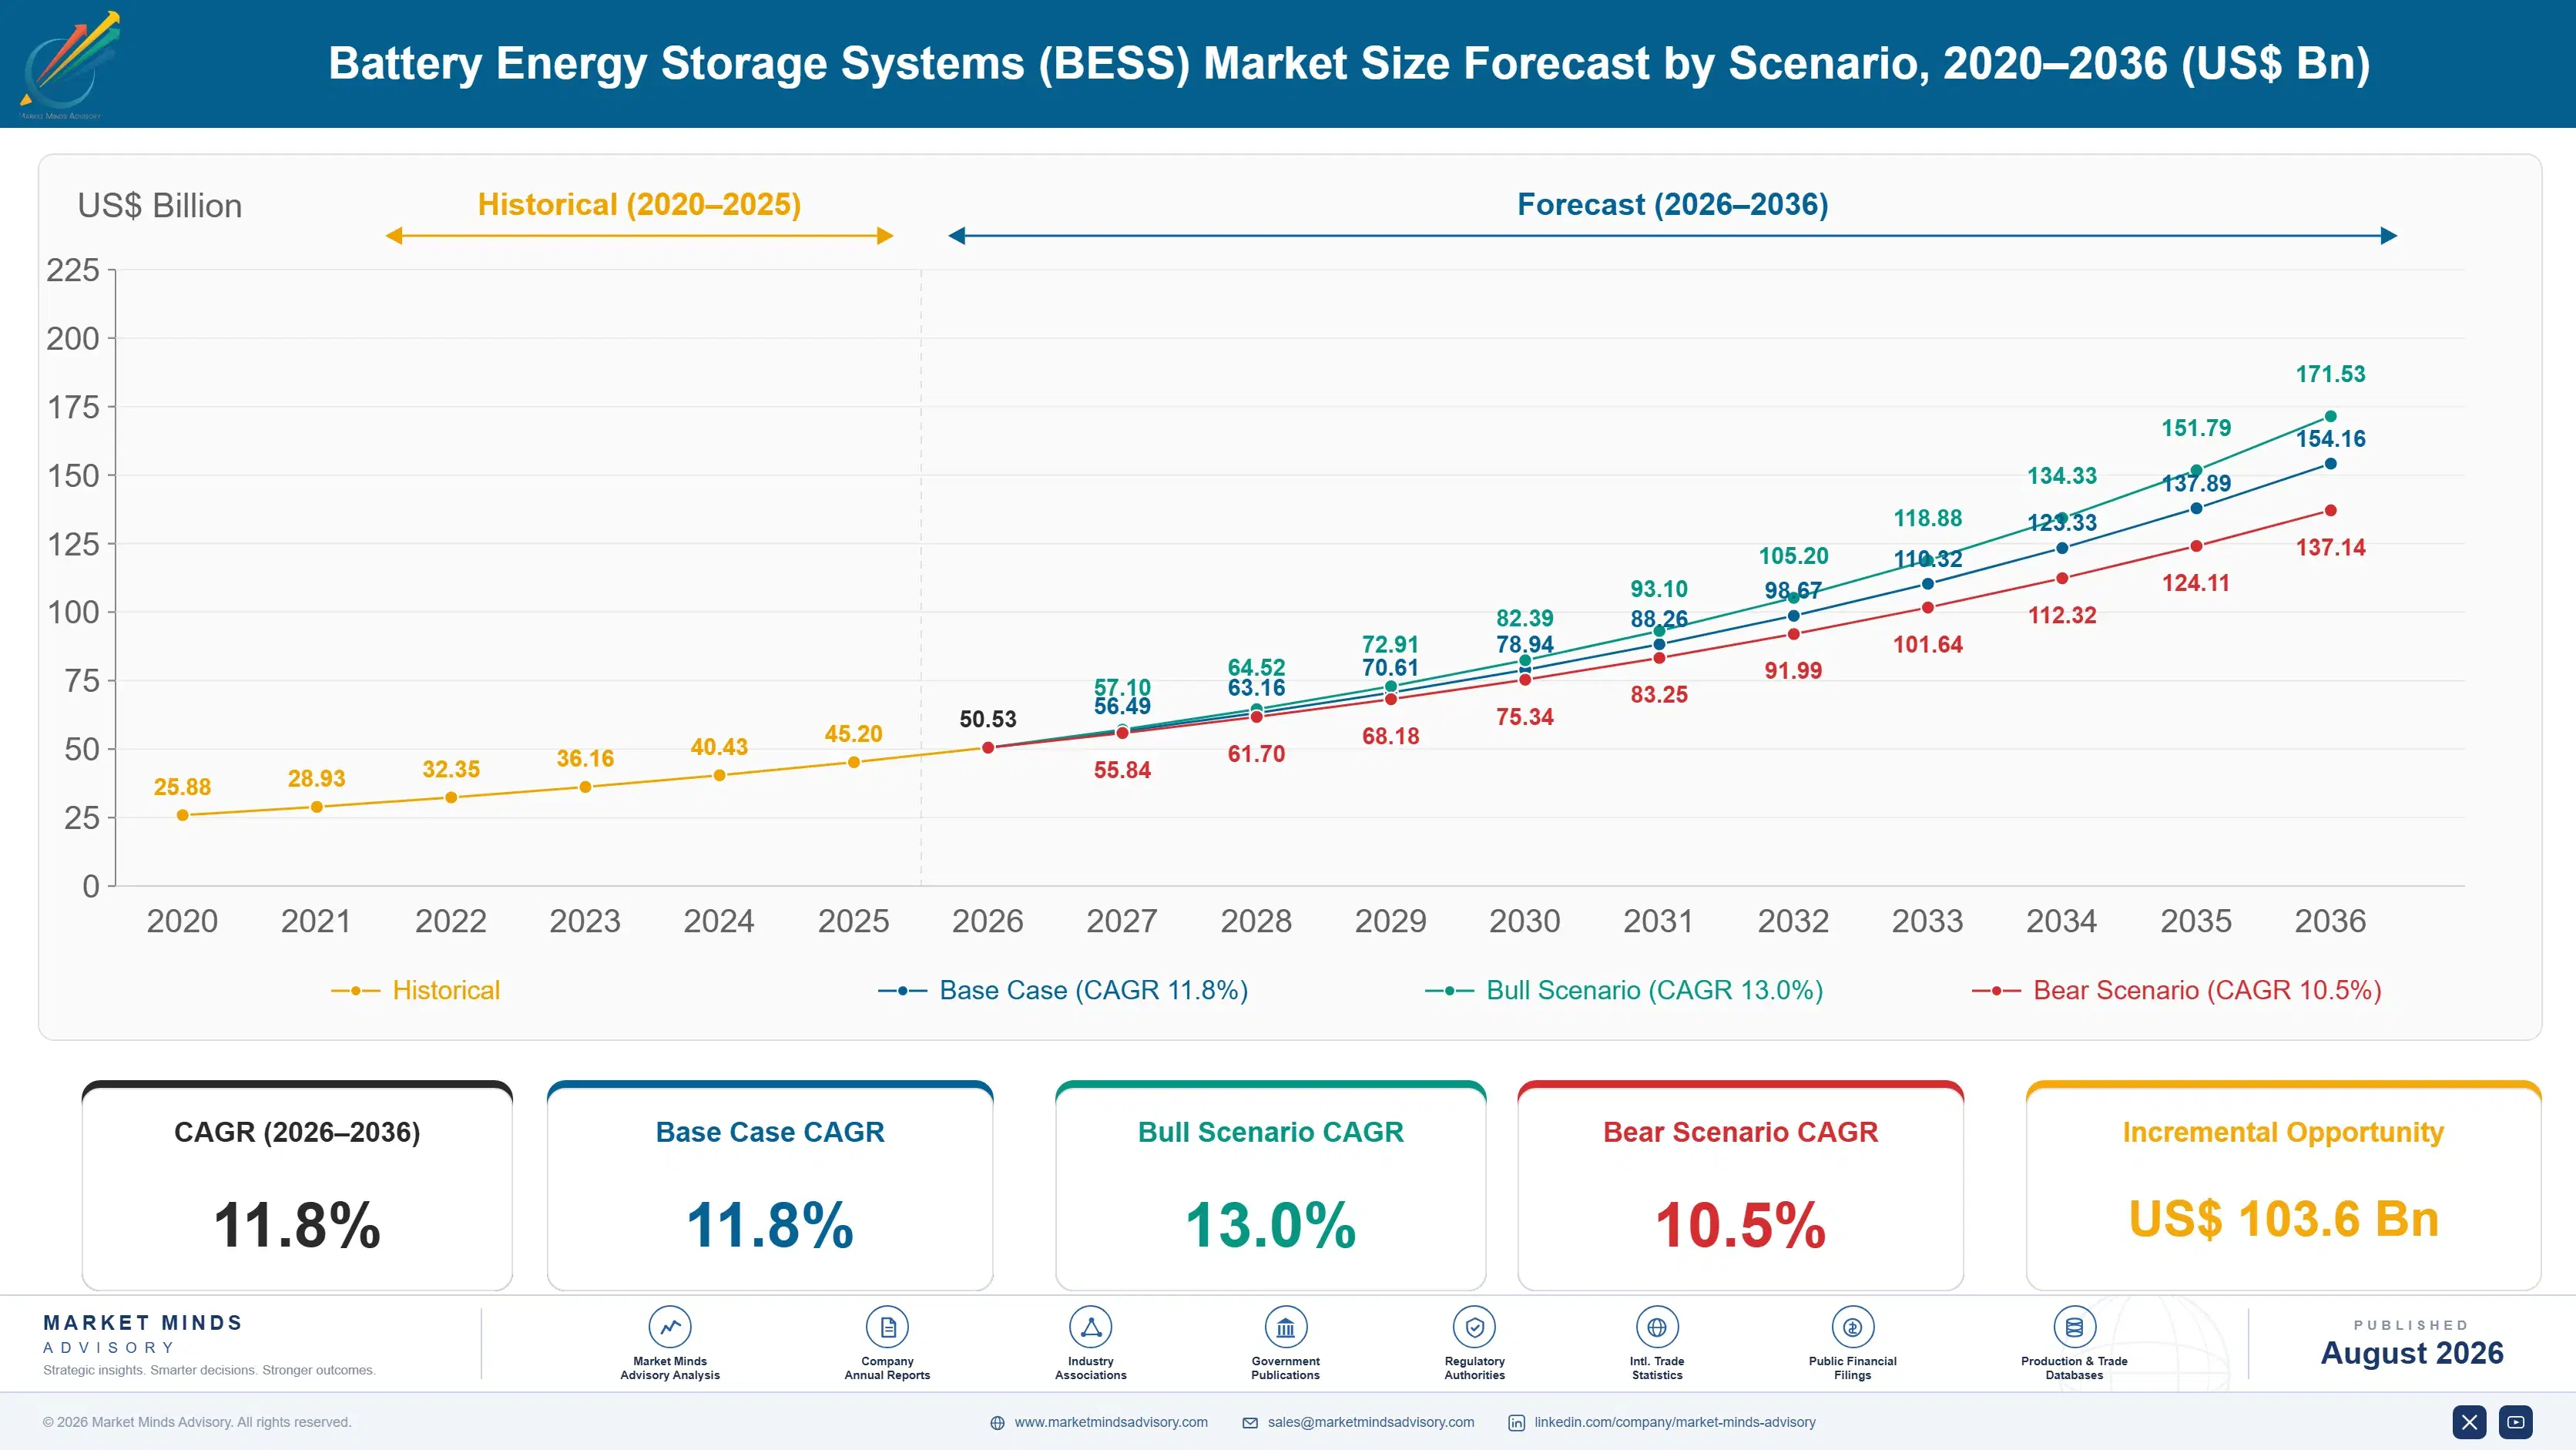
Battery Energy Storage Systems (BESS) Market Forecast Scenarios

battery-energy-storage-systems-market-size-forecast-scenario-1787324726535
Growth from 2020 to 2025 compounded near 10.8%, accelerating as utility-scale deployment scaled past residential and commercial installations that had dominated the category's earlier years by volume. Lithium iron phosphate chemistry displaced nickel manganese cobalt across most grid-scale projects during the same period, cutting system cost meaningfully while renewable curtailment losses kept climbing across major grids.
Three mechanisms carry the base case to 11.8%. First, renewable capacity additions keep outpacing grid flexibility, and every additional gigawatt of solar or wind needs storage to avoid curtailment losses that waste generation capacity outright. Second, ancillary service markets keep opening to battery participation, since batteries respond faster than any thermal generator and grid operators pay for that speed directly. Third, cell cost keeps falling as Chinese manufacturing scale expands, pulling more projects past commercial viability thresholds every year.
The bull case at 13.0% assumes ancillary service market expansion accelerates further and cell costs fall faster than current manufacturing roadmaps suggest across every major chemistry. The bear case at 10.5% assumes safety incident frequency triggers stricter permitting requirements in key markets and interest rate conditions keep project financing costs elevated longer than currently expected.

Why Revenue Stacking Now Decides Project Economics

Three converging forces set demand now. Renewable capacity additions keep outpacing grid flexibility, and every additional gigawatt of solar or wind needs storage to avoid curtailment losses that waste generation capacity utility operators already paid to build. Ancillary service markets keep opening to battery participation, since batteries respond in milliseconds where thermal generators need minutes. And falling cell costs keep pulling more projects past commercial viability thresholds every
MARKET CONCENTRATIONCR5: 48%Moderately concentrated among integrated manufacturers and system integrators
AVERAGE SELLING PRICEUSD 180 to 280 per kilowatt-hourBlended system pricing varying considerably by chemistry and scale
TOP PRODUCING COUNTRY SHAREChina: 62% of global cell manufacturing capacityChinese battery cell manufacturing scale supplying domestic and export demand
CYCLE LIFE PERFORMANCE6,000 to 10,000 cyclesTypical operating life before meaningful capacity degradation for lithium chemistry
REVENUE STACK COMPOSITION3 to 5 stacked revenue streamsAncillary services layered atop energy arbitrage for utility-scale operators
DEPLOYMENT LEAD TIME12 to 24 monthsTypical timeline from contract signing to commercial operation date
The commercial character splits along revenue model almost entirely across every deployment scale. Utility-scale operators increasingly stack multiple revenue streams, energy arbitrage, capacity payments, and frequency regulation, rather than relying on any single contract. Residential and commercial buyers purchase primarily for backup power and bill management instead, treating grid service participation as a secondary benefit their installer configures rather than the primary purchase driver.
The next decade turns on revenue stacking sophistication and safety record together across the whole industry. Operators who master multiple simultaneous revenue streams capture margin single-purpose capacity contracts alone could never reach. Safety incidents at grid-scale sites keep testing regulatory patience, and how the industry responds determines whether permitting timelines stay manageable or extend considerably.
"The projects getting funded right now are not the ones with the cheapest batteries, they are the ones with the smartest software stacking five revenue streams a competitor selling pure capacity never touches. Hardware got commoditised faster than most developers noticed."
Director, Grid Storage and Energy Systems Practice · MMA Energy / Grid and Distr

Market Trends

Revenue Stacking Becomes The Defining Operator Skill

Utility-scale operators increasingly layer energy arbitrage, capacity payments, frequency regulation, and demand response participation onto a single asset rather than contracting for one revenue stream alone, since software-controlled dispatch can now switch between services within minutes as market conditions shift. Fluence Energy and other dedicated software platforms have built genuine competitive advantage around optimisation algorithms that capture meaningfully more revenue per megawatt than manual dispatch strategies ever achieved historically. The commercial consequence is that project financing increasingly depends on demonstrated stacking software capability rather than battery specification alone, since lenders now model multiple revenue streams into their bankability assessment directly.
Market Impact: Curtailment losses top 5%
Safety Incidents Trigger Tightening Permitting Requirements

Thermal runaway incidents at several grid-scale storage sites across California, Arizona, and South Korea have drawn sustained regulatory and community attention, prompting fire code revisions and extended permitting review in multiple jurisdictions that previously approved projects on shorter timelines. Insurance premiums for battery storage projects have risen meaningfully following these incidents, adding a cost developers had not previously budgeted for at comparable scale. The commercial consequence is that manufacturers with strong safety track records and third-party certification increasingly win project selection over cheaper competitors, since developers now weigh safety record as heavily as price in vendor selection decisions.
Market Impact: Batteries clear 70% of regulation

Market Opportunities and Growth Drivers

Renewable Curtailment Losses Make Storage Economically Unavoidable

Grid operators across California, Texas, and increasingly China have curtailed meaningful volumes of solar and wind generation during periods of oversupply, wasting renewable capacity utilities already paid to build and connect to the grid. Storage captures that otherwise-wasted generation and dispatches it during periods of higher demand or pricing, converting a pure loss into genuine revenue for the project owner operating the asset. Regulators in multiple jurisdictions are now requiring or incentivising storage co-location with new renewable capacity specifically to address curtailment directly, recognising that storage economics improve every year renewable penetration continues rising across the grid.
Market Impact: Insurance premiums rise 20% to 40%

Ancillary Service Markets Keep Opening To Battery Participation

Grid operators including PJM, ERCOT, and National Grid ESO have all expanded ancillary service market rules to explicitly accommodate battery participation, recognising that batteries respond in milliseconds where thermal generators need minutes to ramp output up or down. Frequency regulation markets in particular pay a substantial premium for that response speed, and batteries have captured a rapidly growing share of these markets across every region that has opened participation rules to them. Each additional market that opens batteries adds a new revenue stream operators can stack onto existing assets, improving project economics without requiring any additional capital investment.
Market Impact: Interconnection queues now exceed 3

Market Restraints and Challenges

Safety Incidents Keep Testing Regulatory And Public Patience

Thermal runaway events at grid-scale storage sites have drawn sustained media and regulatory attention, even though the underlying incident rate remains low relative to total deployed capacity industry-wide. The root cause is that lithium-ion chemistry, particularly nickel manganese cobalt formulations, carries genuine thermal runaway risk under cell defect or damage conditions manufacturers have not eliminated entirely despite years of engineering investment. Commercially this triggers permitting delays and insurance cost increases falling on every developer regardless of which manufacturer's equipment is actually used. Manufacturers are mitigating the risk through lithium iron phosphate adoption and improved thermal management design.
Market Impact: Stacked projects earn 40% more

Interconnection Queue Delays Stall Project Timelines Broadly

Grid interconnection queues in major markets including the United States have grown to multi-year waiting periods, since transmission operators must study every proposed project's grid impact before granting connection approval regardless of how quickly storage itself could be built and commissioned. The root cause is that queue study processes were designed for a much smaller volume of applications than renewable and storage development now generates simultaneously. Commercially this delays revenue generation for completed projects still awaiting approval, tying up capital that could otherwise fund additional development. Developers are mitigating the delay through queue reform advocacy and faster-jurisdiction prioritisation.
Market Impact: Permitting extends 6 to 9 months
4 additional market trends, 3 additional growth drivers, and 2 additional restraints and challenges are covered in the full report. Contact sales@marketmindsadvisory.com to access the complete intelligence.

Segment CAGR and Growth Architecture

Segmentation follows deployment application, a single commercial logic describing where the storage system connects and what revenue model it actually serves in practice. Each application carries its own contract structure, scale, and revenue stacking potential, so commercial position tracks the application rather than battery chemistry. Chemistry and distribution channel appear separately in the framework.
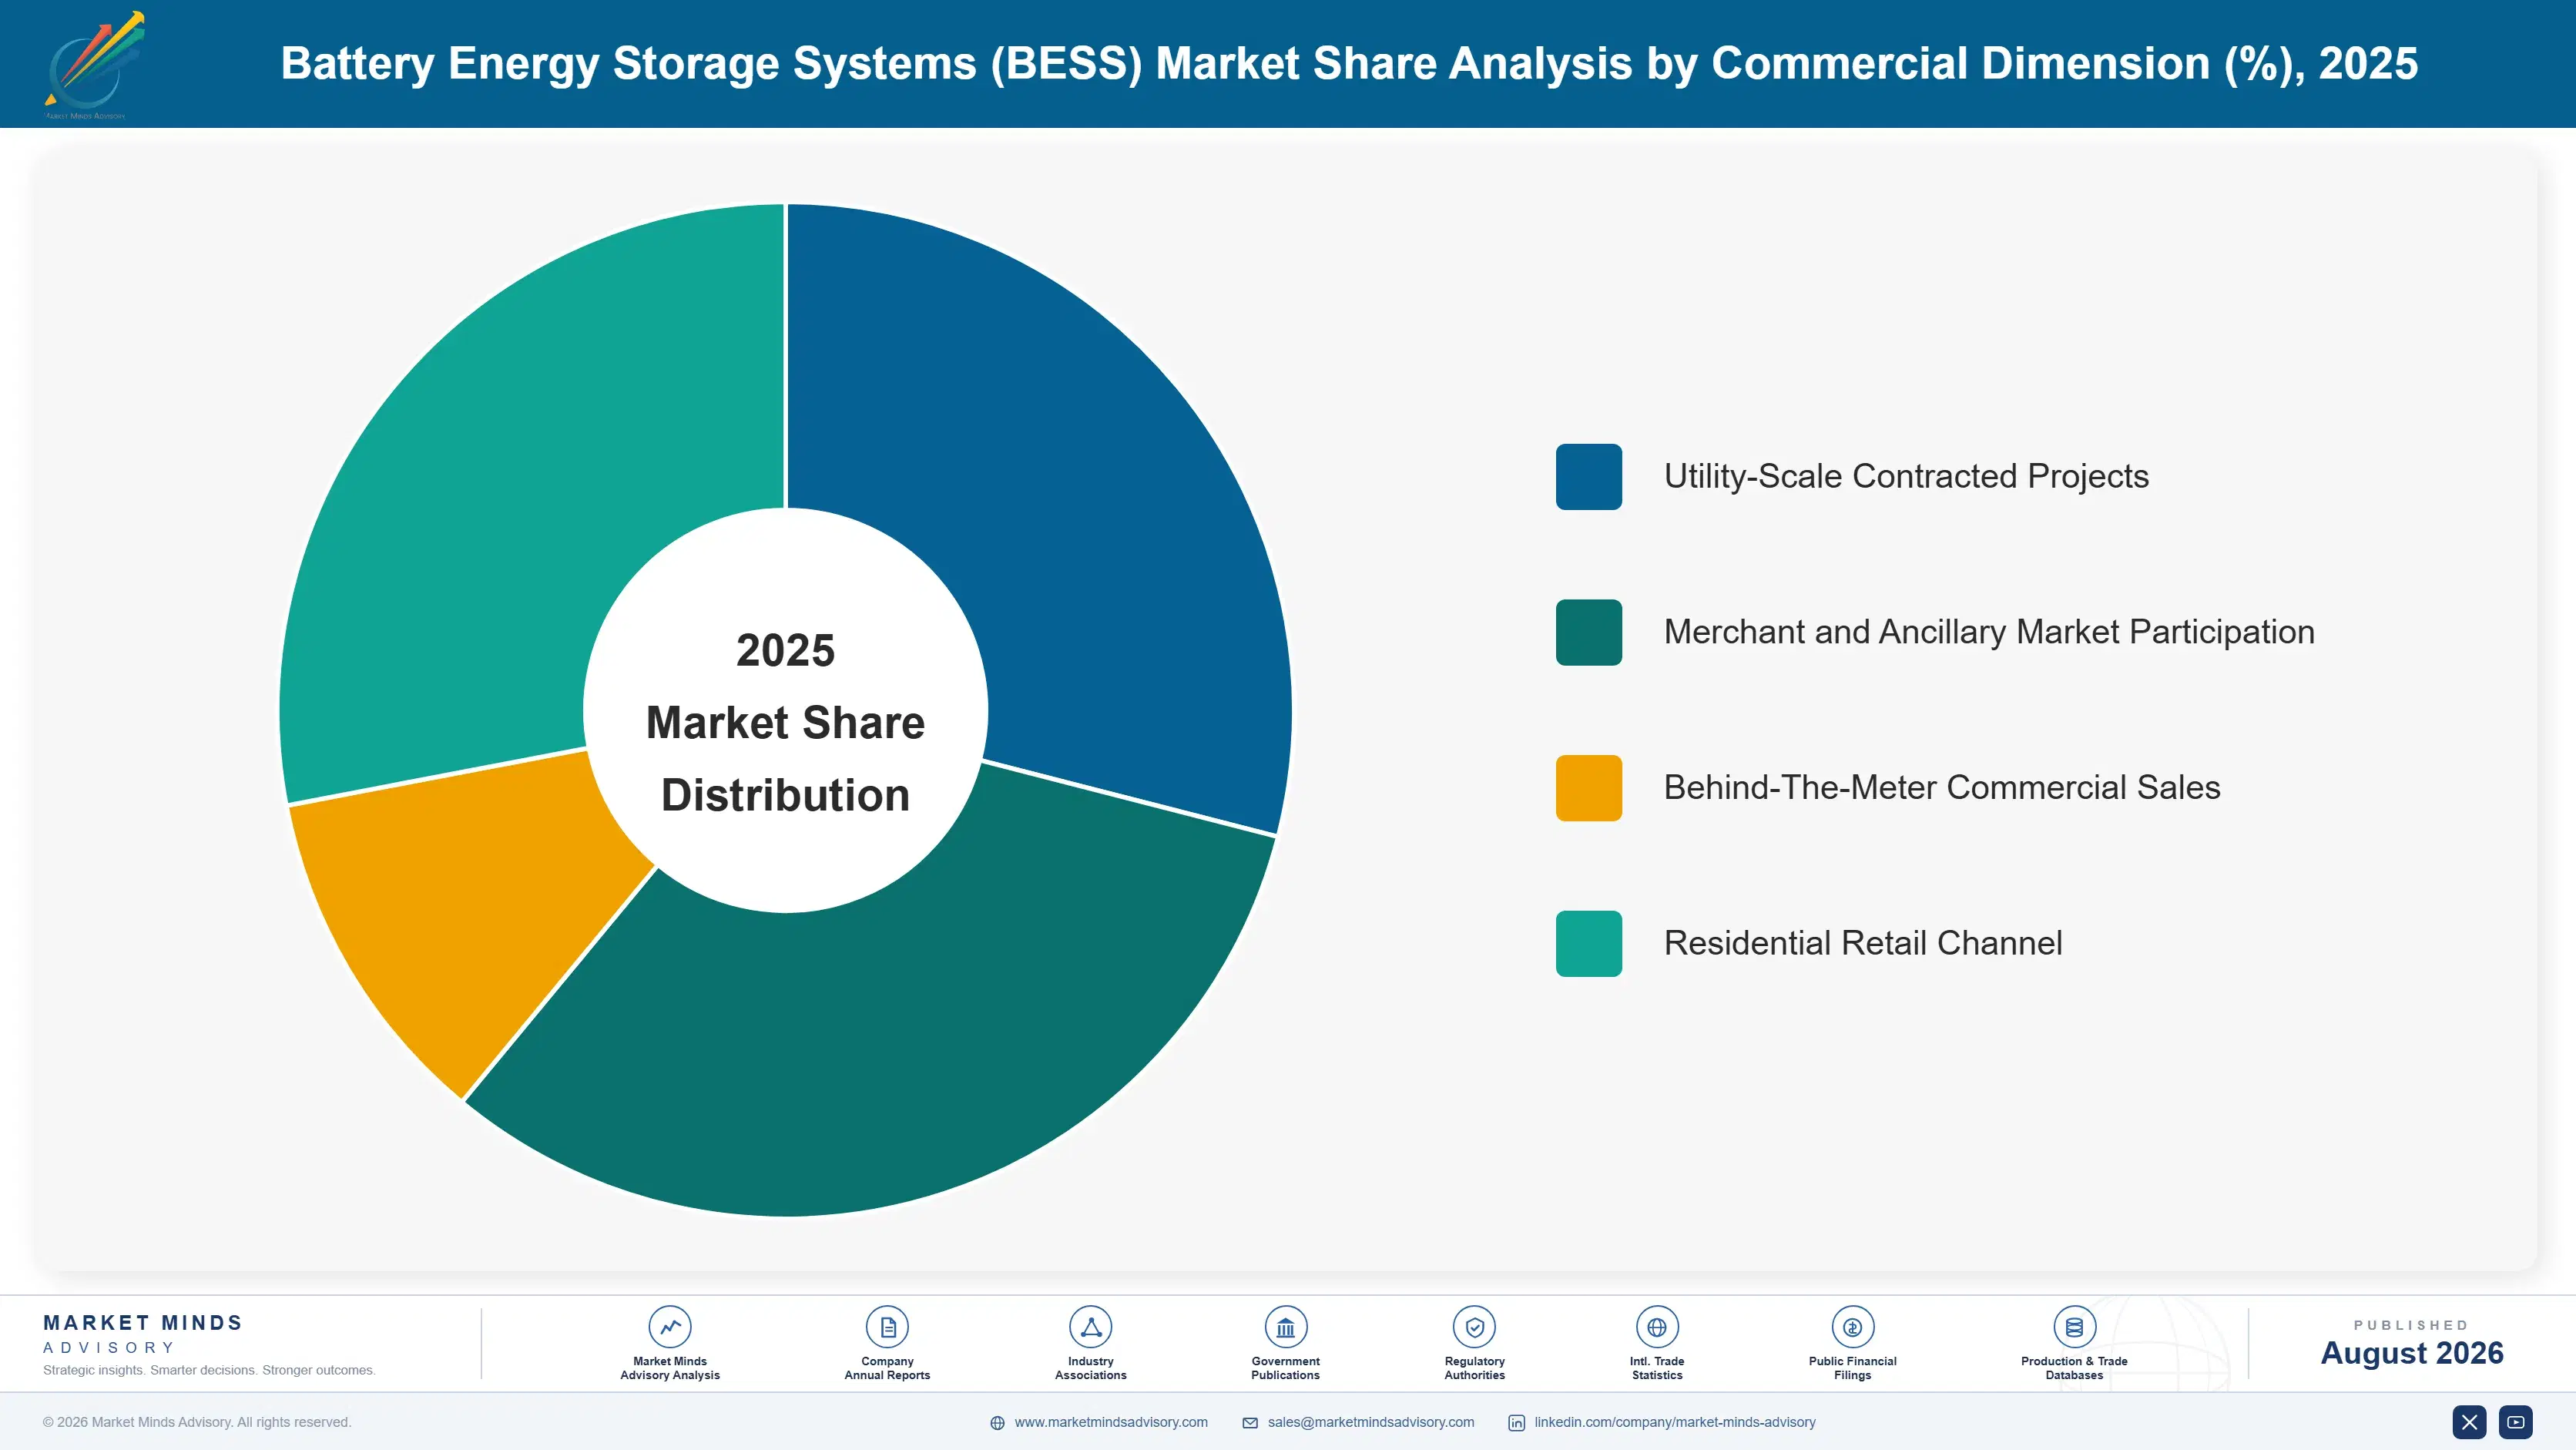
battery-energy-storage-systems-market-market-share-analysis-1787324727539

Grid Ancillary Services and Frequency Regulation Storage

Grid ancillary services and frequency regulation storage grows fastest at 15.5%, about 1.31 times the overall 11.8% rate, as grid operators including PJM and ERCOT pay substantial premiums for the millisecond response speed only batteries can deliver at scale reliably. This segment often layers onto existing utility-scale assets rather than requiring standalone deployment, since operators increasingly configure software to switch a single battery asset between energy arbitrage and frequency regulation as market conditions shift throughout the day. Fluence Energy and other dedicated optimisation platforms have built genuine competitive advantage in this segment specifically, capturing revenue manual dispatch strategies could never reach at comparable consistency across a full operating year and every season.
CAGR 15.5%

EV Charging-Integrated Storage

EV charging-integrated storage grows second-fastest at 14.2%, pairing battery storage directly with fast charging infrastructure to buffer grid demand spikes that high-power charging otherwise creates during peak usage periods at busy sites. Charging network operators increasingly specify integrated storage to avoid costly grid upgrades that pure charging infrastructure alone would require at high-traffic sites specifically across every region. Tesla and several dedicated charging infrastructure developers have both begun bundling storage directly into new charging site design rather than treating it as a separate add-on decision made later. The segment remains considerably smaller than utility-scale storage today but is growing from a genuinely low base as charging network build-out accelerates broadly worldwide.
CAGR 14.2%
Full segment breakdown across 6 segments available in the complete report.

Regional Architecture and Country Demand Map

Manufacturing scale and grid market structure together set this distribution across the seven regions tracked here almost entirely on their own. East Asia leads on Chinese cell manufacturing, while share elsewhere tracks how far each region's ancillary service markets have opened to battery participation specifically.

North America

North America holds 26% of value, and utility-scale deployment across California, Texas, and increasingly the Southeast has scaled fast enough to make the region a genuine bellwether for global project economics and financing structures worldwide. PJM and ERCOT ancillary service markets have both opened meaningfully to battery participation, giving operators multiple revenue streams to stack onto a single asset rather than relying on energy arbitrage alone. Safety incidents in California specifically have triggered fire code revisions that other states are now watching closely. Interconnection queue delays remain the binding constraint on project timelines across most of the region. Growth of 12.5% tracks utility-scale and ancillary market expansion together, reinforcing each other considerably.
Share: 26% | CAGR: 12.5% (2026 to 2036)

Western Europe

Western Europe holds 20% of value, and grid balancing needs from rapid renewable capacity additions have pushed National Grid ESO and continental transmission operators to open frequency response markets to battery participation earlier than most other regions globally. German and British projects lead on ancillary service revenue sophistication, with software-driven revenue stacking now standard practice among established developers operating at meaningful commercial scale. Regulatory frameworks favour lithium iron phosphate chemistry following safety incident concerns, shaping procurement decisions considerably across the bloc. Growth of 10.3%, among the slowest of the seven regions, reflects a maturing utility-scale base and ancillary markets that have already opened substantially compared to less mature regions elsewhere.
Share: 20% | CAGR: 10.3% (2026 to 2036)
Regional intelligence for 5 additional markets available in the complete report: East Asia, South Asia and Pacific, Latin America, Middle East and Africa, Eastern Europe. Contact sales@marketmindsadvisory.com.
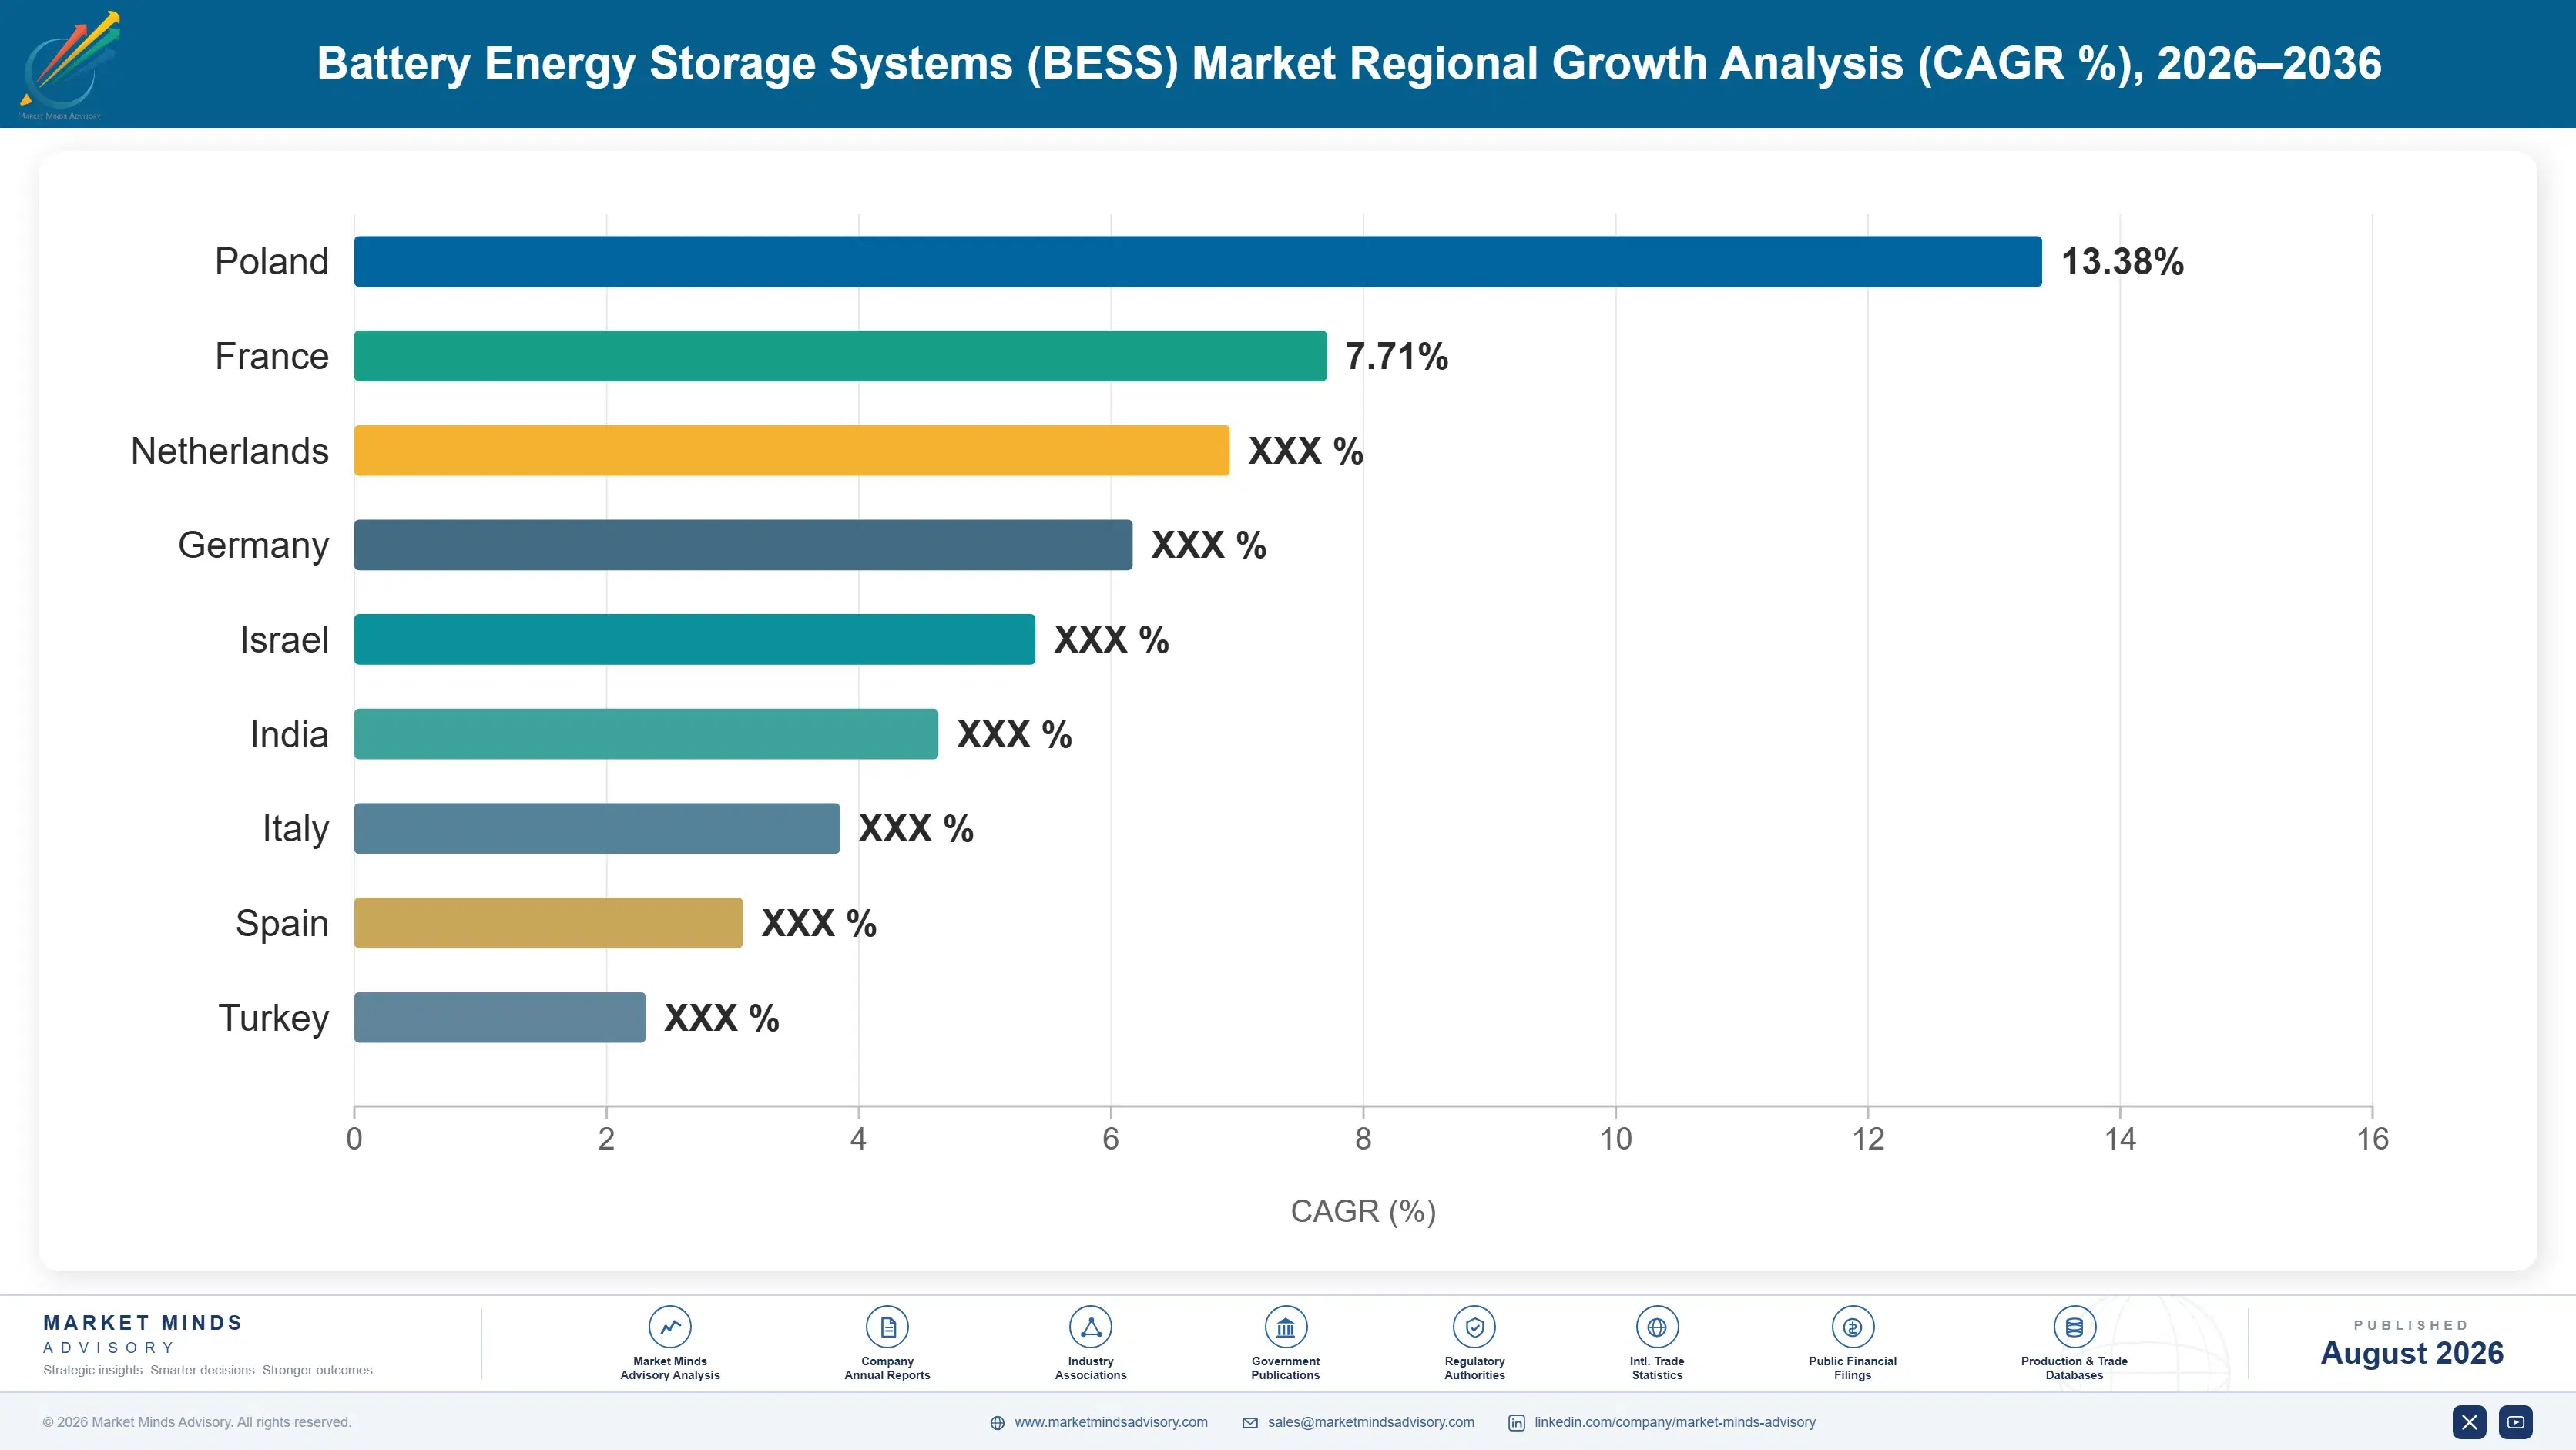
battery-energy-storage-systems-market-country-cagr-analysis-1787324728348

Where Storage Value Survives Cell Commoditisation

Selling battery cells against Chinese scale pricing is a race integrated manufacturers are already winning decisively on cost alone, year after year, across nearly every chemistry tracked here. The four moves below shift value toward positions a bulk cell comparison cannot easily erode: revenue stacking software, safety certification, ancillary market access, and interconnection-ready project development.

Build Revenue Stacking Software As A Product

Operators layering energy arbitrage, capacity payments, and frequency regulation onto a single asset earn roughly 40% more per megawatt than those relying on any single revenue stream alone, a gap that keeps widening as more ancillary markets open to battery participation broadly. Fluence Energy and other dedicated optimisation platforms have built genuine competitive advantage around dispatch algorithms that switch between services within minutes as market conditions shift throughout the day. Manufacturers and integrators who develop or license comparable software capture design-in relationships hardware-only sellers never access at all in this market.
Market Impact: Stacked-revenue operators earn 40%

Achieve Safety Certification Ahead Of Regulatory Tightening

Thermal runaway incidents have triggered fire code revisions and extended permitting review in multiple jurisdictions, and insurance premiums for battery storage projects have risen 20% to 40% following these events across the industry broadly and consistently across nearly every region. Manufacturers with strong safety track records and third-party certification increasingly win project selection over cheaper competitors, since developers now weigh safety record just as heavily as price itself. Investing in lithium iron phosphate chemistry and independent certification ahead of tightening requirements positions a manufacturer for the permitting environment already arriving.
Market Impact: Certified suppliers see 20% to 40%

Secure Ancillary Market Qualification In Priority Regions

Batteries now clear roughly 70% of frequency regulation market volume in regions where participation rules have opened, capturing premium pricing thermal generators simply cannot match given their slower ramp characteristics under normal operating conditions across the grid. Each additional ancillary market that opens adds a new stackable revenue stream operators can layer onto existing assets without requiring additional capital investment in hardware itself. Developers who qualify early for these markets in priority regions like PJM and ERCOT lock in operational experience and regulatory relationships that later entrants must build from scratch.
Market Impact: Frequency regulation clearing tops

Front-Load Interconnection Applications Before Site Selection

Grid interconnection queues have grown to multi-year waiting periods, now exceeding 3 years in major markets, and projects that submit interconnection applications early in the development process reach commercial operation considerably faster than those that wait for full site and financing certainty first before filing anything. Developers who treat interconnection timing as the primary scheduling constraint, rather than construction or equipment delivery, capture revenue years earlier than competitors following a conventional development sequence built around construction milestones instead. That timing advantage compounds across a multi-project pipeline considerably over several years.
Market Impact: Early filers cut timelines by 12 to

Who Controls the Margin Pool

Concentration is moderate: the top five hold roughly 48% of revenue, spanning integrated cell manufacturers, dedicated system integrators, and software-focused optimisation platforms competing on quite different commercial models. The gap between leaders and challengers is revenue stacking sophistication and safety record rather than manufacturing scale alone, which is increasingly accessible to well-capitalised new entrants. All participants are assessed on one basis, revenue from battery stora
Competition runs along three lines. First, revenue stacking software, since operators layering multiple grid services onto one asset earn considerably more than single-purpose competitors. Second, safety certification, where verified track record increasingly wins project selection over cheaper unverified equipment. Third, manufacturing cost, since Chinese cell suppliers continue setting the pricing floor everyone else must compete against.

Pressure is building from two directions. Chinese manufacturers including CATL and BYD keep expanding export share on cost, increasingly winning system integration contracts once reserved for Western specialists. Meanwhile software-focused platforms like Fluence are capturing margin through optimisation algorithms hardware-only competitors cannot replicate quickly. Rankings should favour companies with genuine stacking software and safety certification over those competing on cell price alone.
battery-energy-storage-systems-market-company-positioning-matrix-1787324729224

Competitive Moat and Risk Dimensions

CATL

Moat: Manufacturing scale and vertical integration

CATL supplies battery cells to a substantial share of global storage deployments, giving it manufacturing scale and cost position competitors take years to approach at comparable volume. Its integration from cell production through system assembly captures margin at every stage most single-function competitors never access.
CATL

Risk: Geopolitical exposure and trade barriers

Trade restrictions and tariffs targeting Chinese battery equipment in the United States and increasingly Europe threaten market access CATL has spent years building, regardless of underlying cost advantage. Domestic content requirements tied to subsidy programmes exclude Chinese-manufactured equipment entirely from a growing share of addressable projects.
FLUENCE ENERGY

Moat: Optimisation software and stacking depth

Fluence Energy built its business specifically around storage optimisation software rather than as a hardware manufacturer first, giving it dispatch algorithm sophistication competitors bolting software onto hardware businesses struggle to match. Deep relationships with grid operators across multiple ancillary markets give it operational data rivals are still accumulating.
FLUENCE ENERGY

Risk: Hardware dependency and margin pressure

Fluence still depends on third-party cell suppliers for hardware, leaving it exposed to the same Chinese pricing pressure integrated competitors pass through less directly to customers. Margin on the hardware component of its business continues compressing even as software margin holds up considerably better across contracts.

Players Tracked

Prominent Players

CATL
BYD
Tesla Energy
Fluence Energy
LG Energy Solution

Other Key Players

Samsung SDI
Sungrow Power
Wartsila Energy Storage
EVE Energy
Hithium
Trina Storage
Powin Energy
NHOA Energy
Saft
Envision AESC
Hitachi Energy
ESS Inc.
Form Energy
Invinity Energy Systems
Narada Power

Recent Developments

MAY 2025

Fluence Energy expands multi-market stacking software platform

Fluence Energy commissioned an expanded software optimisation platform integrating frequency regulation and capacity market participation into a single dispatch engine, adding stacking capability across a broader set of ancillary markets. This was an organic product expansion rather than any acquisition or joint venture, targeting operators seeking more sophisticated revenue stacking.
Signal: Software platform expansion shows optimisa
OCTOBER 2024

CATL signs supply agreement with Middle East grid stability project

CATL signed a supply agreement with a major Middle Eastern utility-scale storage developer for battery cells supporting a substantial grid stability project tied to renewable capacity additions. This was a supply agreement rather than an acquisition or merger, reflecting Chinese manufacturers winning megaproject-scale contracts internationally.
Signal: Chinese suppliers winning megaproject cont
FEBRUARY 2025

California finalises revised battery storage fire code requirements

Regulators in California finalised revised fire code requirements for grid-scale battery storage facilities following recent thermal runaway incidents, extending permitting review timelines for new projects across the state. This was a regulatory policy change rather than any corporate transaction, tightening safety requirements across the industry broadly.
Signal: Regulatory tightening following safety inc

Lithium, Nickel, And Interconnection Timing Risk

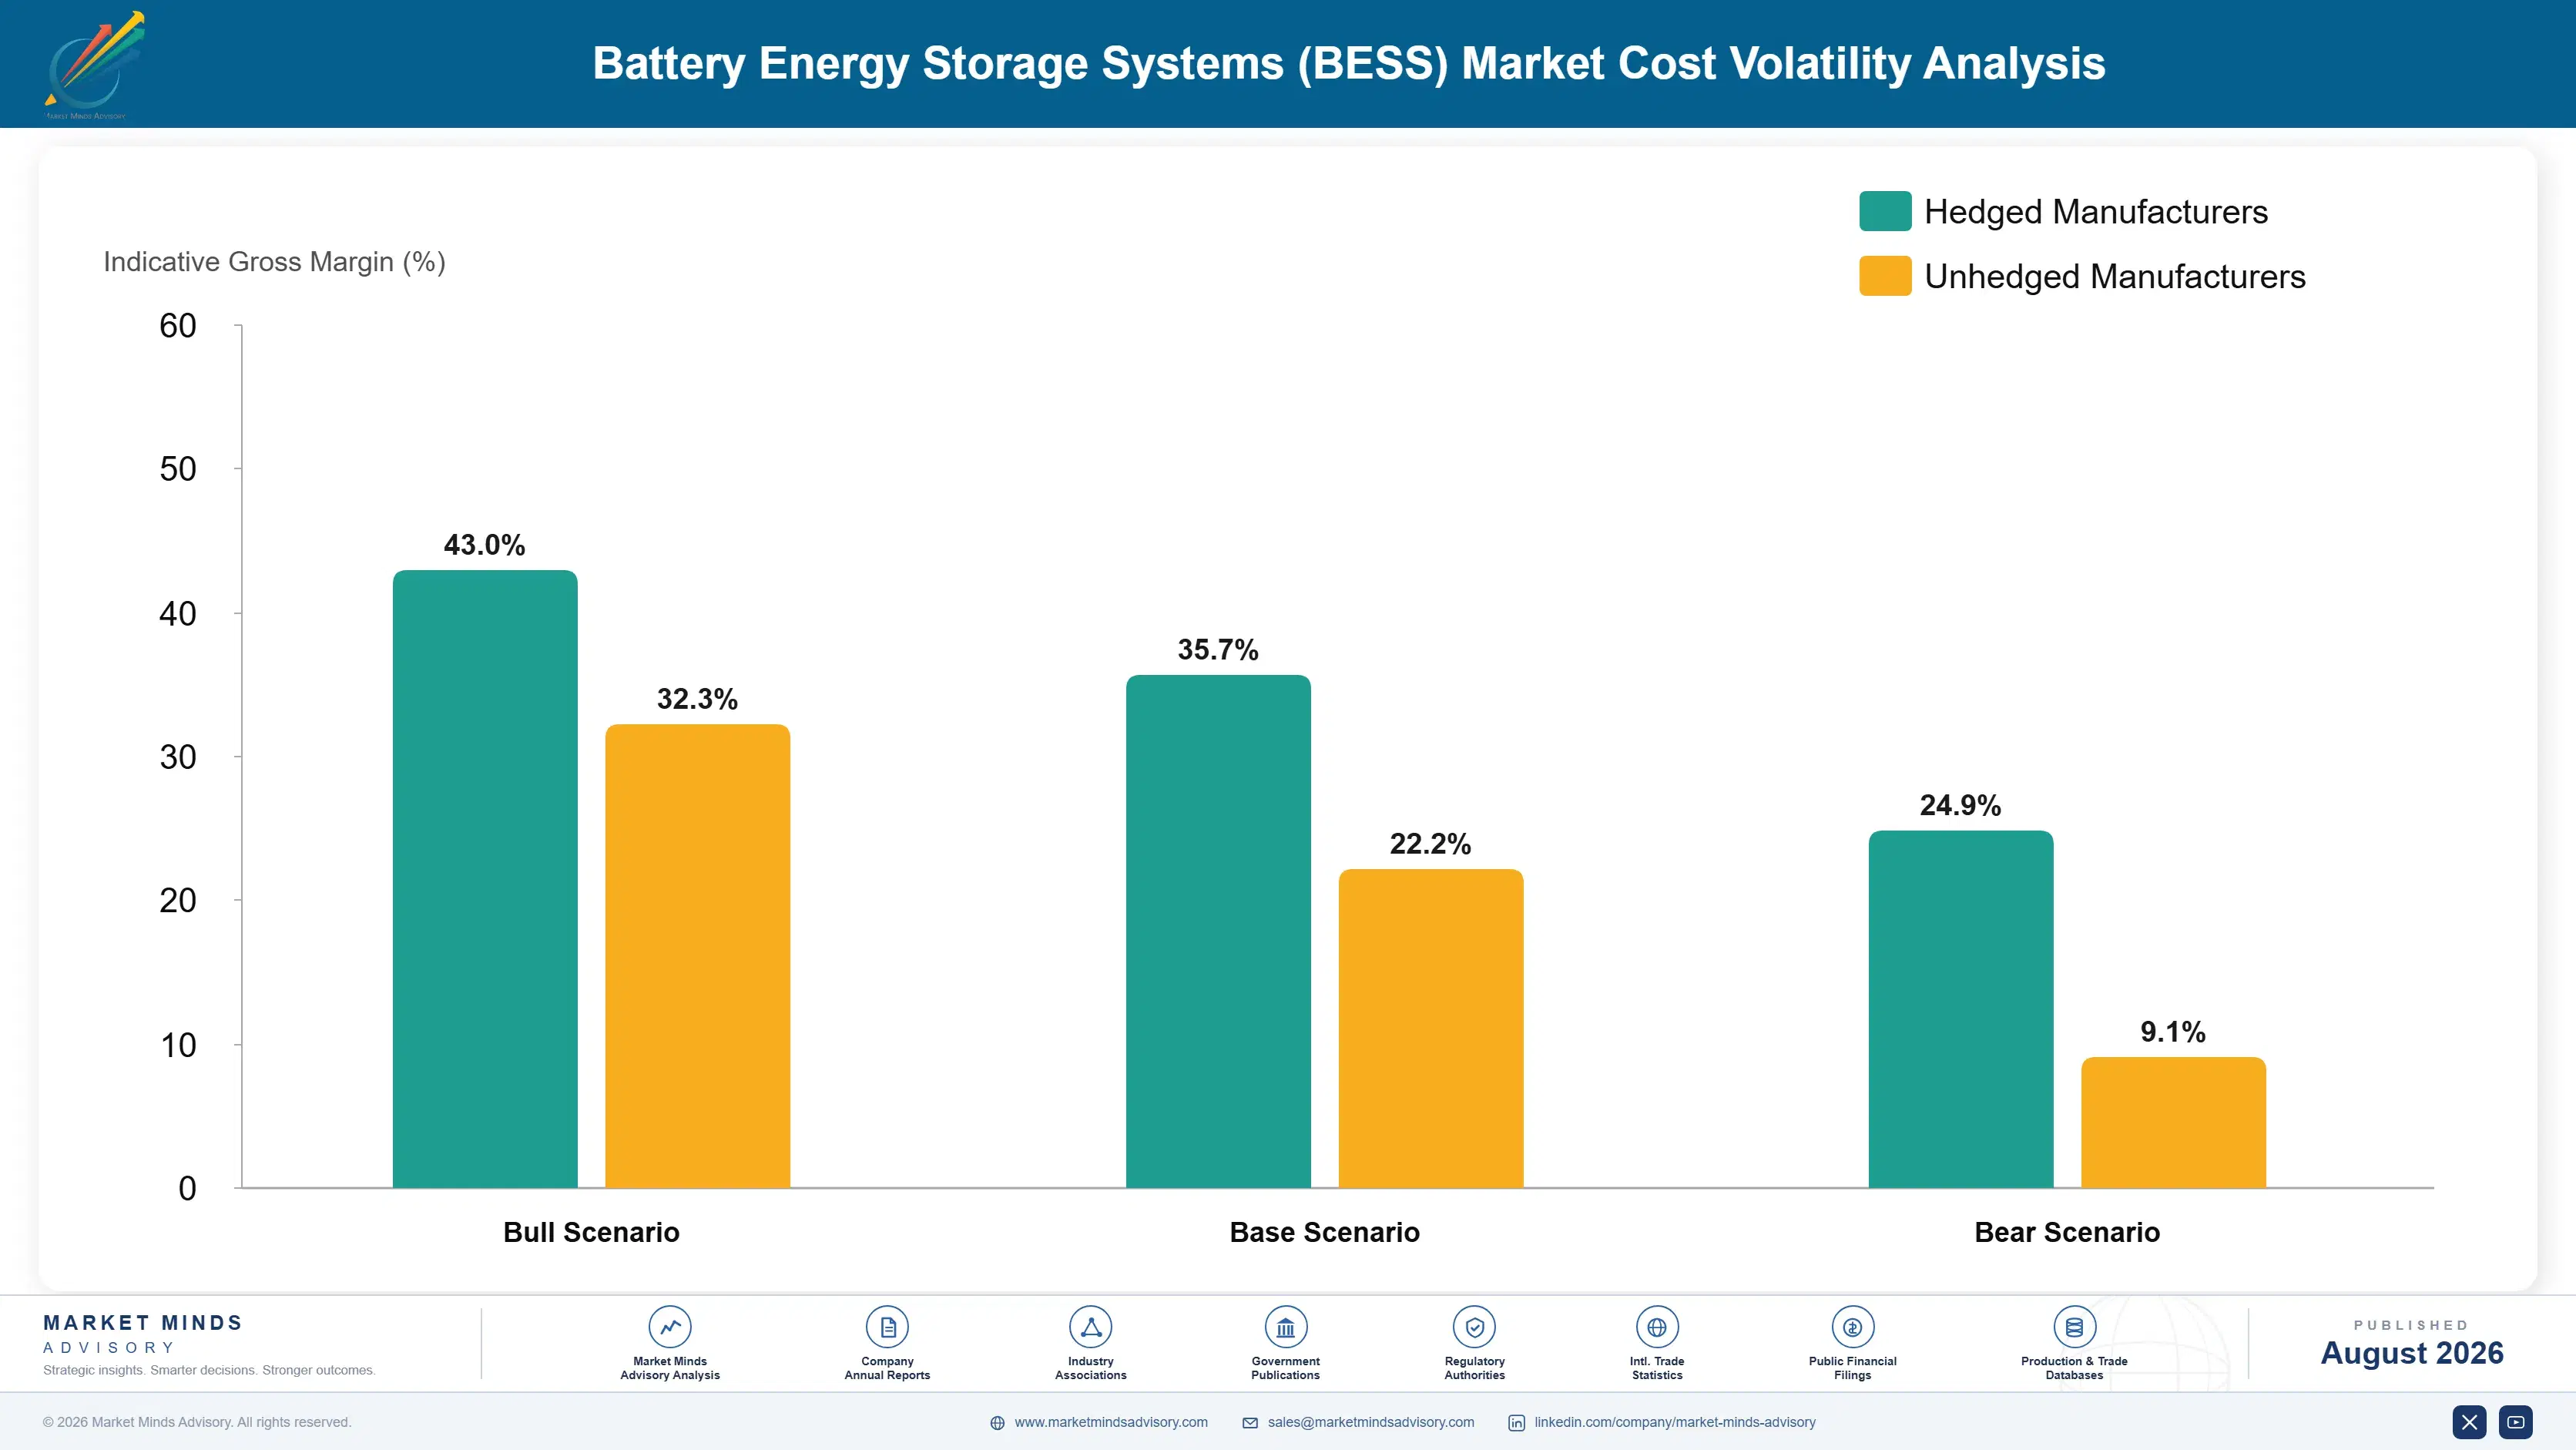
Battery cells account for roughly 45% to 60% of system cost, dominated by lithium carbonate, nickel, and cobalt for NMC chemistry or lithium and iron phosphate for LFP, sourced mainly from Chile, Australia, Indonesia, and China across the whole supply chain. Power conversion and thermal management equipment adds 20% to 30%. Balance-of-system and installation costs make up most of the remainder.
Lithium carbonate prices spiked considerably through 2022 as electric vehicle and storage demand both surged simultaneously, tightening supply chains that had not scaled production fast enough to match. The IEA's Critical Minerals Market Review recorded lithium prices trading multiple times above prior five-year averages at the 2022 peak, and CATL's 2022 annual report cited raw material cost inflation as a direct pressure on battery margins specifically.

Exposure separates sharply by chemistry choice and vertical integration across the industry. LFP-focused manufacturers avoid nickel and cobalt exposure entirely, insulating them from the volatility NMC producers cannot escape regardless of scale achieved elsewhere. Vertically integrated manufacturers with mining or refining stakes hedge exposure directly, while smaller integrators buy cells on contract and absorb price pass-through from suppliers instead.
battery-energy-storage-systems-market-cost-volatility-analysis-1787324729611

Shift chemistry mix toward lithium iron phosphate systems

Nickel and cobalt price volatility hit NMC-dependent manufacturers hardest during the 2022 spike, while LFP systems avoided that exposure entirely by design and chemistry choice made years earlier. LFP has already become the default chemistry for most grid-scale storage projects, and manufacturers still weighted toward NMC should accelerate the transition to reduce volatility exposure considerably going forward.

Secure long-term lithium supply contracts with producers

Spot market lithium purchasing exposed manufacturers fully to the 2022 price spike with no protection whatsoever against the sudden swing that followed almost immediately afterward across the industry. Long-term supply contracts with Chilean and Australian producers smooth exposure across price cycles and give manufacturers planning certainty spot purchasing simply cannot provide at any real scale.

Pursue vertical integration into cell manufacturing directly

System integrators dependent entirely on purchased cells compete for supply against everyone else during tight periods, with no ability to control cost or allocation priority at all themselves. Vertical integration into cell manufacturing, even at modest scale, gives integrators supply certainty and cost visibility that pure system assembly alone can never provide reliably at scale.

Portfolio Architecture for Margin Defence

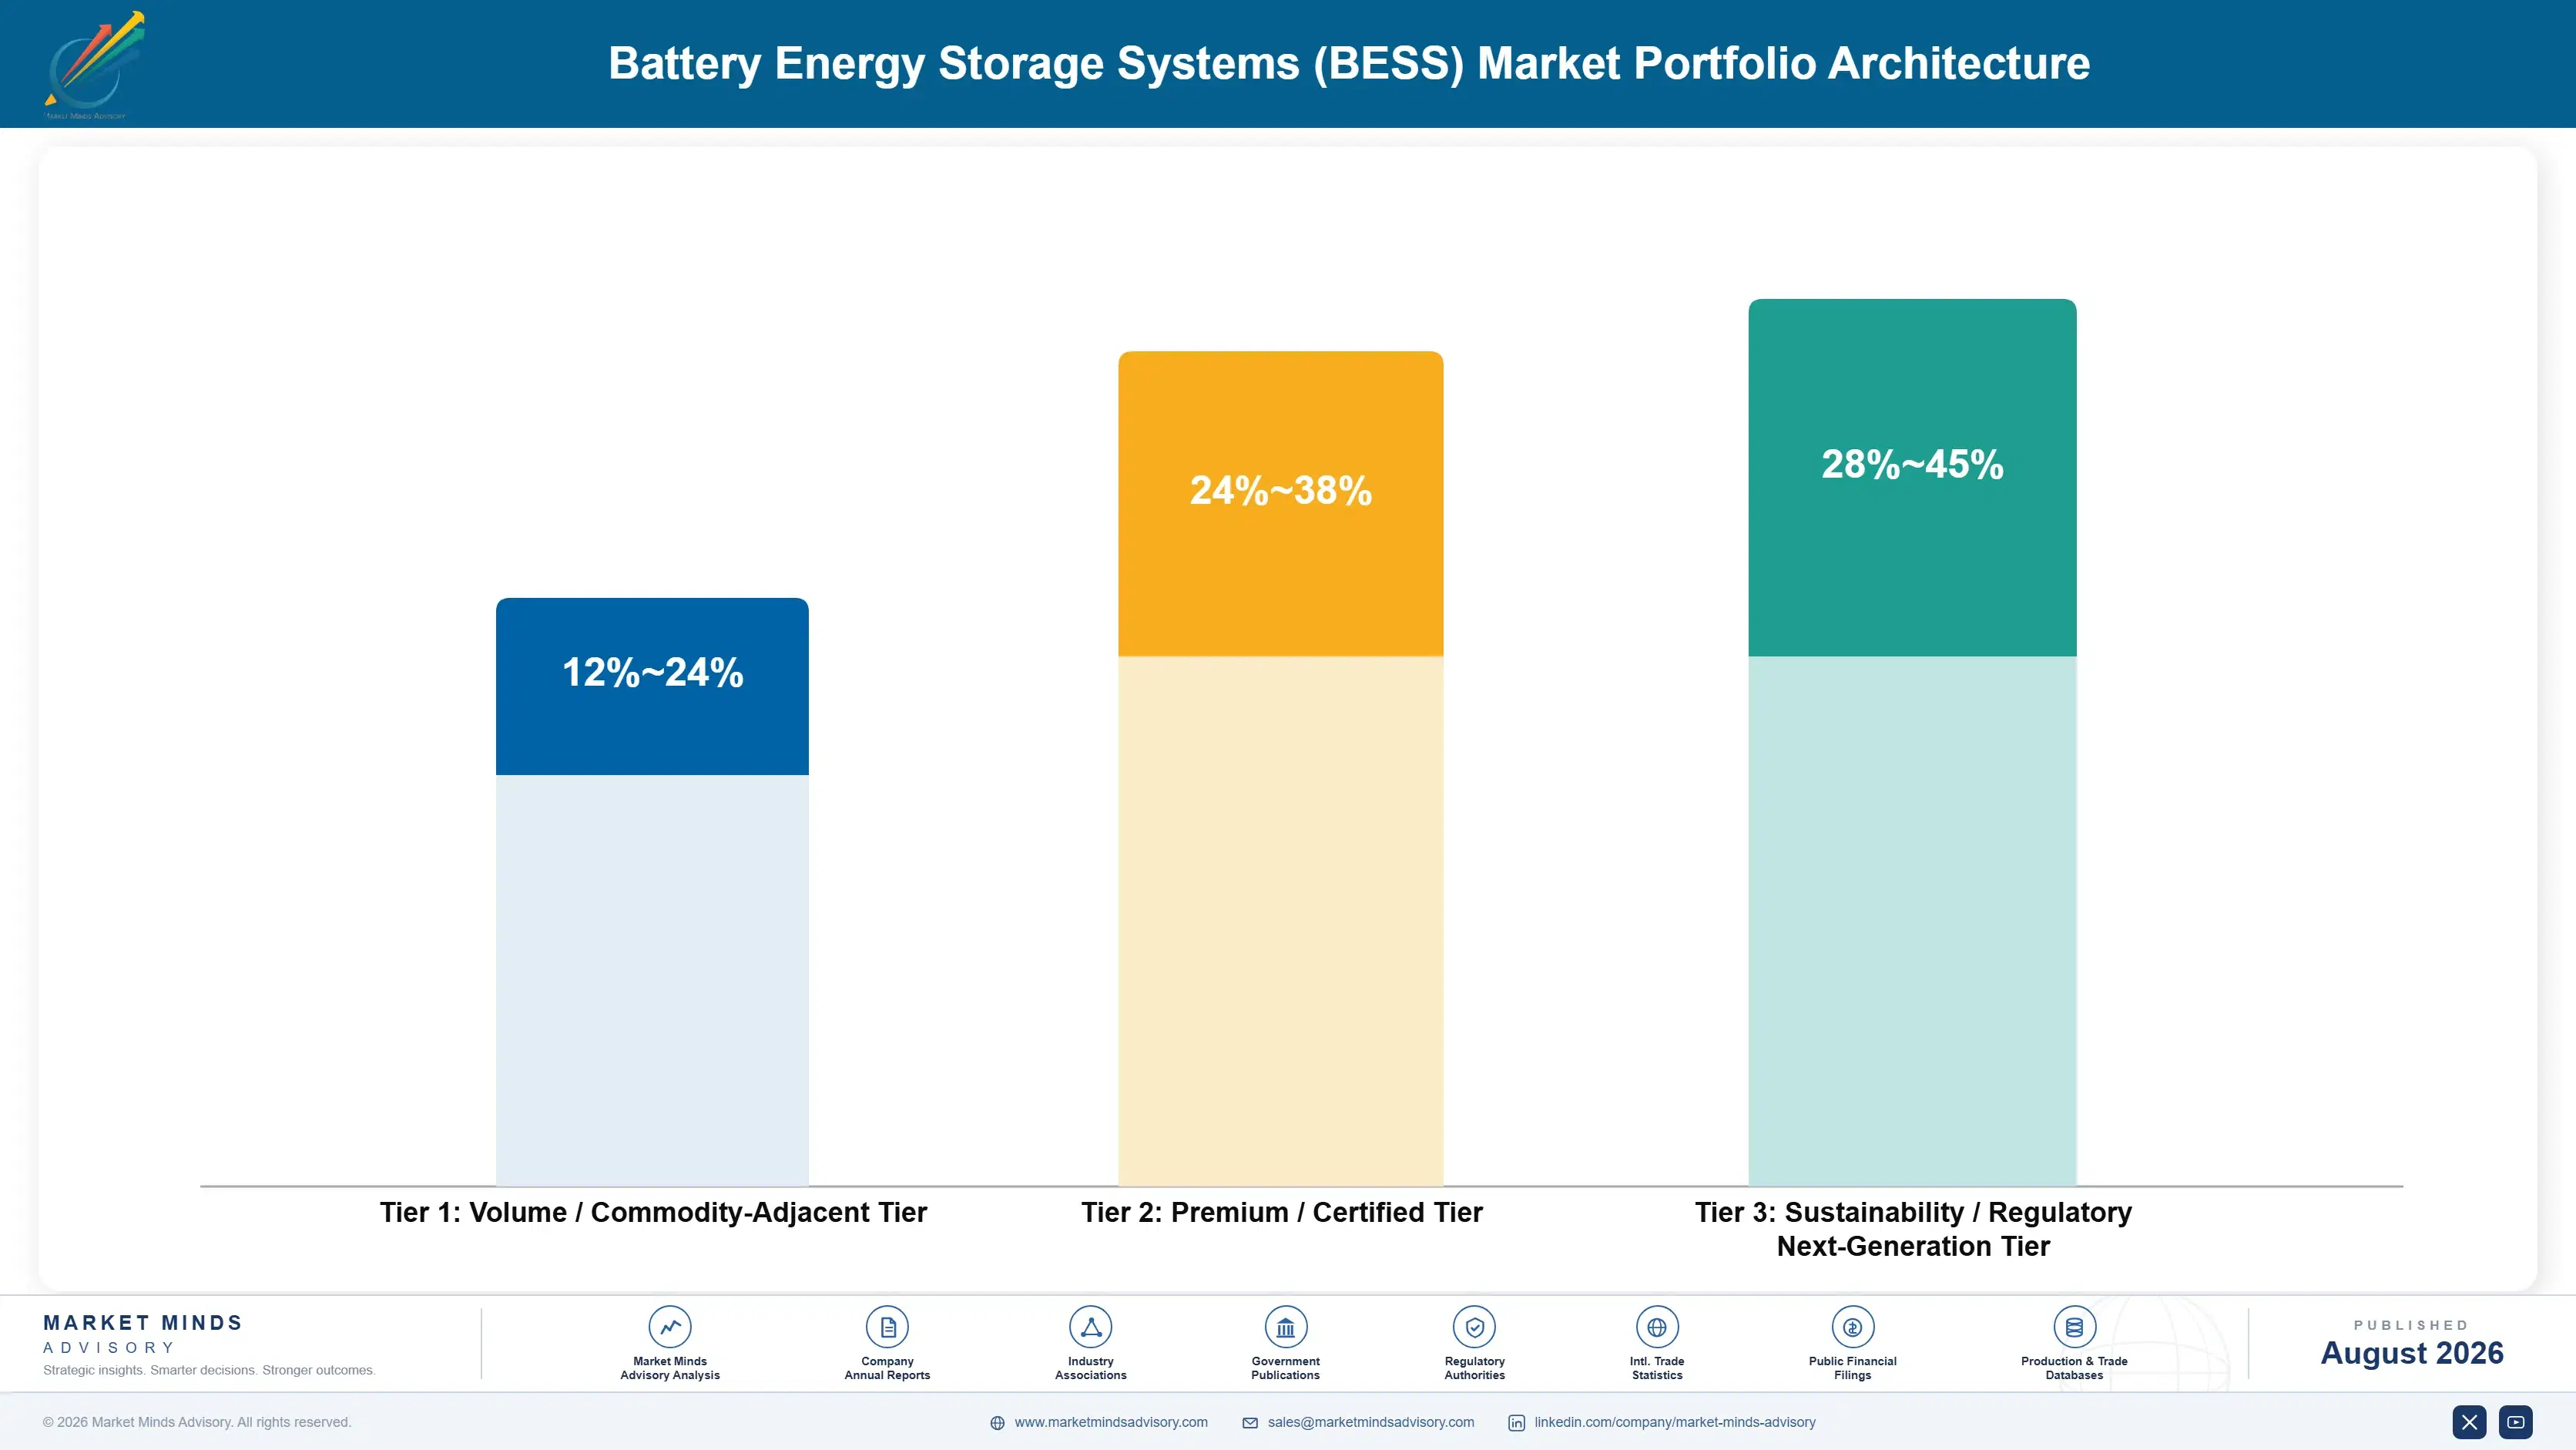
The portfolio splits into three tiers with sharply different economics. Commodity LFP cells and basic system integration form the volume tier, priced against Chinese scale competition with thin, closely benchmarked margin across every qualified supplier. Revenue stacking software and safety-certified systems earn considerably more, since optimisation capability and verified track record both resist pure price negotiation between buyer and integrator throughout the contract term.
Tension runs between the commodity hardware business funding today's operations and the software and certification investment that captures tomorrow's premium across every deployment scale. An integrator defending hardware volume too aggressively under-invests in the stacking software and safety documentation buyers actually reward from every credible bidder now competing for utility-scale contracts. Yet abandoning volume revenue too early starves the cash flow that funds the very capability build an integrator needs simply to compete.

High-value pools concentrate where genuine software or certification barriers limit competition meaningfully across the industry: multi-market revenue stacking platforms, safety-certified systems for regulated jurisdictions, and interconnection-ready project development capturing premium pricing few competitors can match. Commodity cell supply for undifferentiated bulk sale sits at the other end, competing purely on cost against every Chinese manufacturer.

Volume / Commodity-Adjacent Tier

Commodity LFP battery cells and basic system integration sold near commodity pricing, competing directly against Chinese manufacturers with considerable scale advantage and thin margin across every qualified regional bidder in the market.
Gross Margin: 12-24%

Premium / Certified Tier

Safety-certified systems and revenue stacking software carrying validated bankability documentation, where optimisation capability resists pure price negotiation between buyer and integrator across the full contract term negotiated carefully at signing.
Gross Margin: 24-38%

Sustainability / Regulatory / Next-Generation Tier

Multi-market stacking platforms, interconnection-ready project development, and grid ancillary service equipment commanding premium pricing on genuine differentiation and regulatory readiness that few competitors can currently match at comparable operating scale.
Gross Margin: 28-45%
battery-energy-storage-systems-market-portfolio-architecture-1787324730452

High-value Sub-segments and Strategic Watch-out

Grid Ancillary Services and Frequency Regulation Storage

High value and fastest-growing at 15.5%, as grid operators pay substantial premiums for millisecond response speed only batteries can deliver reliably at scale across every open market. Software optimisation platforms capture margin manual dispatch strategies could never reach at comparable consistency across a full operating year.
Gross Margin: 32-48%

EV Charging-Integrated Storage

High value with strong growth at 14.2%, as charging network operators specify integrated storage to avoid costly grid upgrades pure charging infrastructure alone would require at high-traffic sites nationwide. Very few credible large-scale deployments exist anywhere close to full maturity today across the wider industry.
Gross Margin: 26-40%

Utility-Scale Grid Storage

The volume core across every major grid, growing steadily at 10.2% but priced through routine negotiation that leaves limited room for margin expansion over time regardless of buyer sophistication involved. Scale and cell cost, not differentiation, decide who wins this business consistently across every region.
Gross Margin: 16-28%

Off-Grid and Microgrid-Coupled Storage

The strategic watch-out, growing just 8.5% and constrained by limited addressable sites relative to grid-connected deployment opportunities available elsewhere across most developed markets tracked here. Volume persists mainly where grid connection remains genuinely impractical or prohibitively expensive to build out reliably, regardless of subsidy support offered.
Gross Margin: 14-24%

How Storage Revenue Compounds Over Time

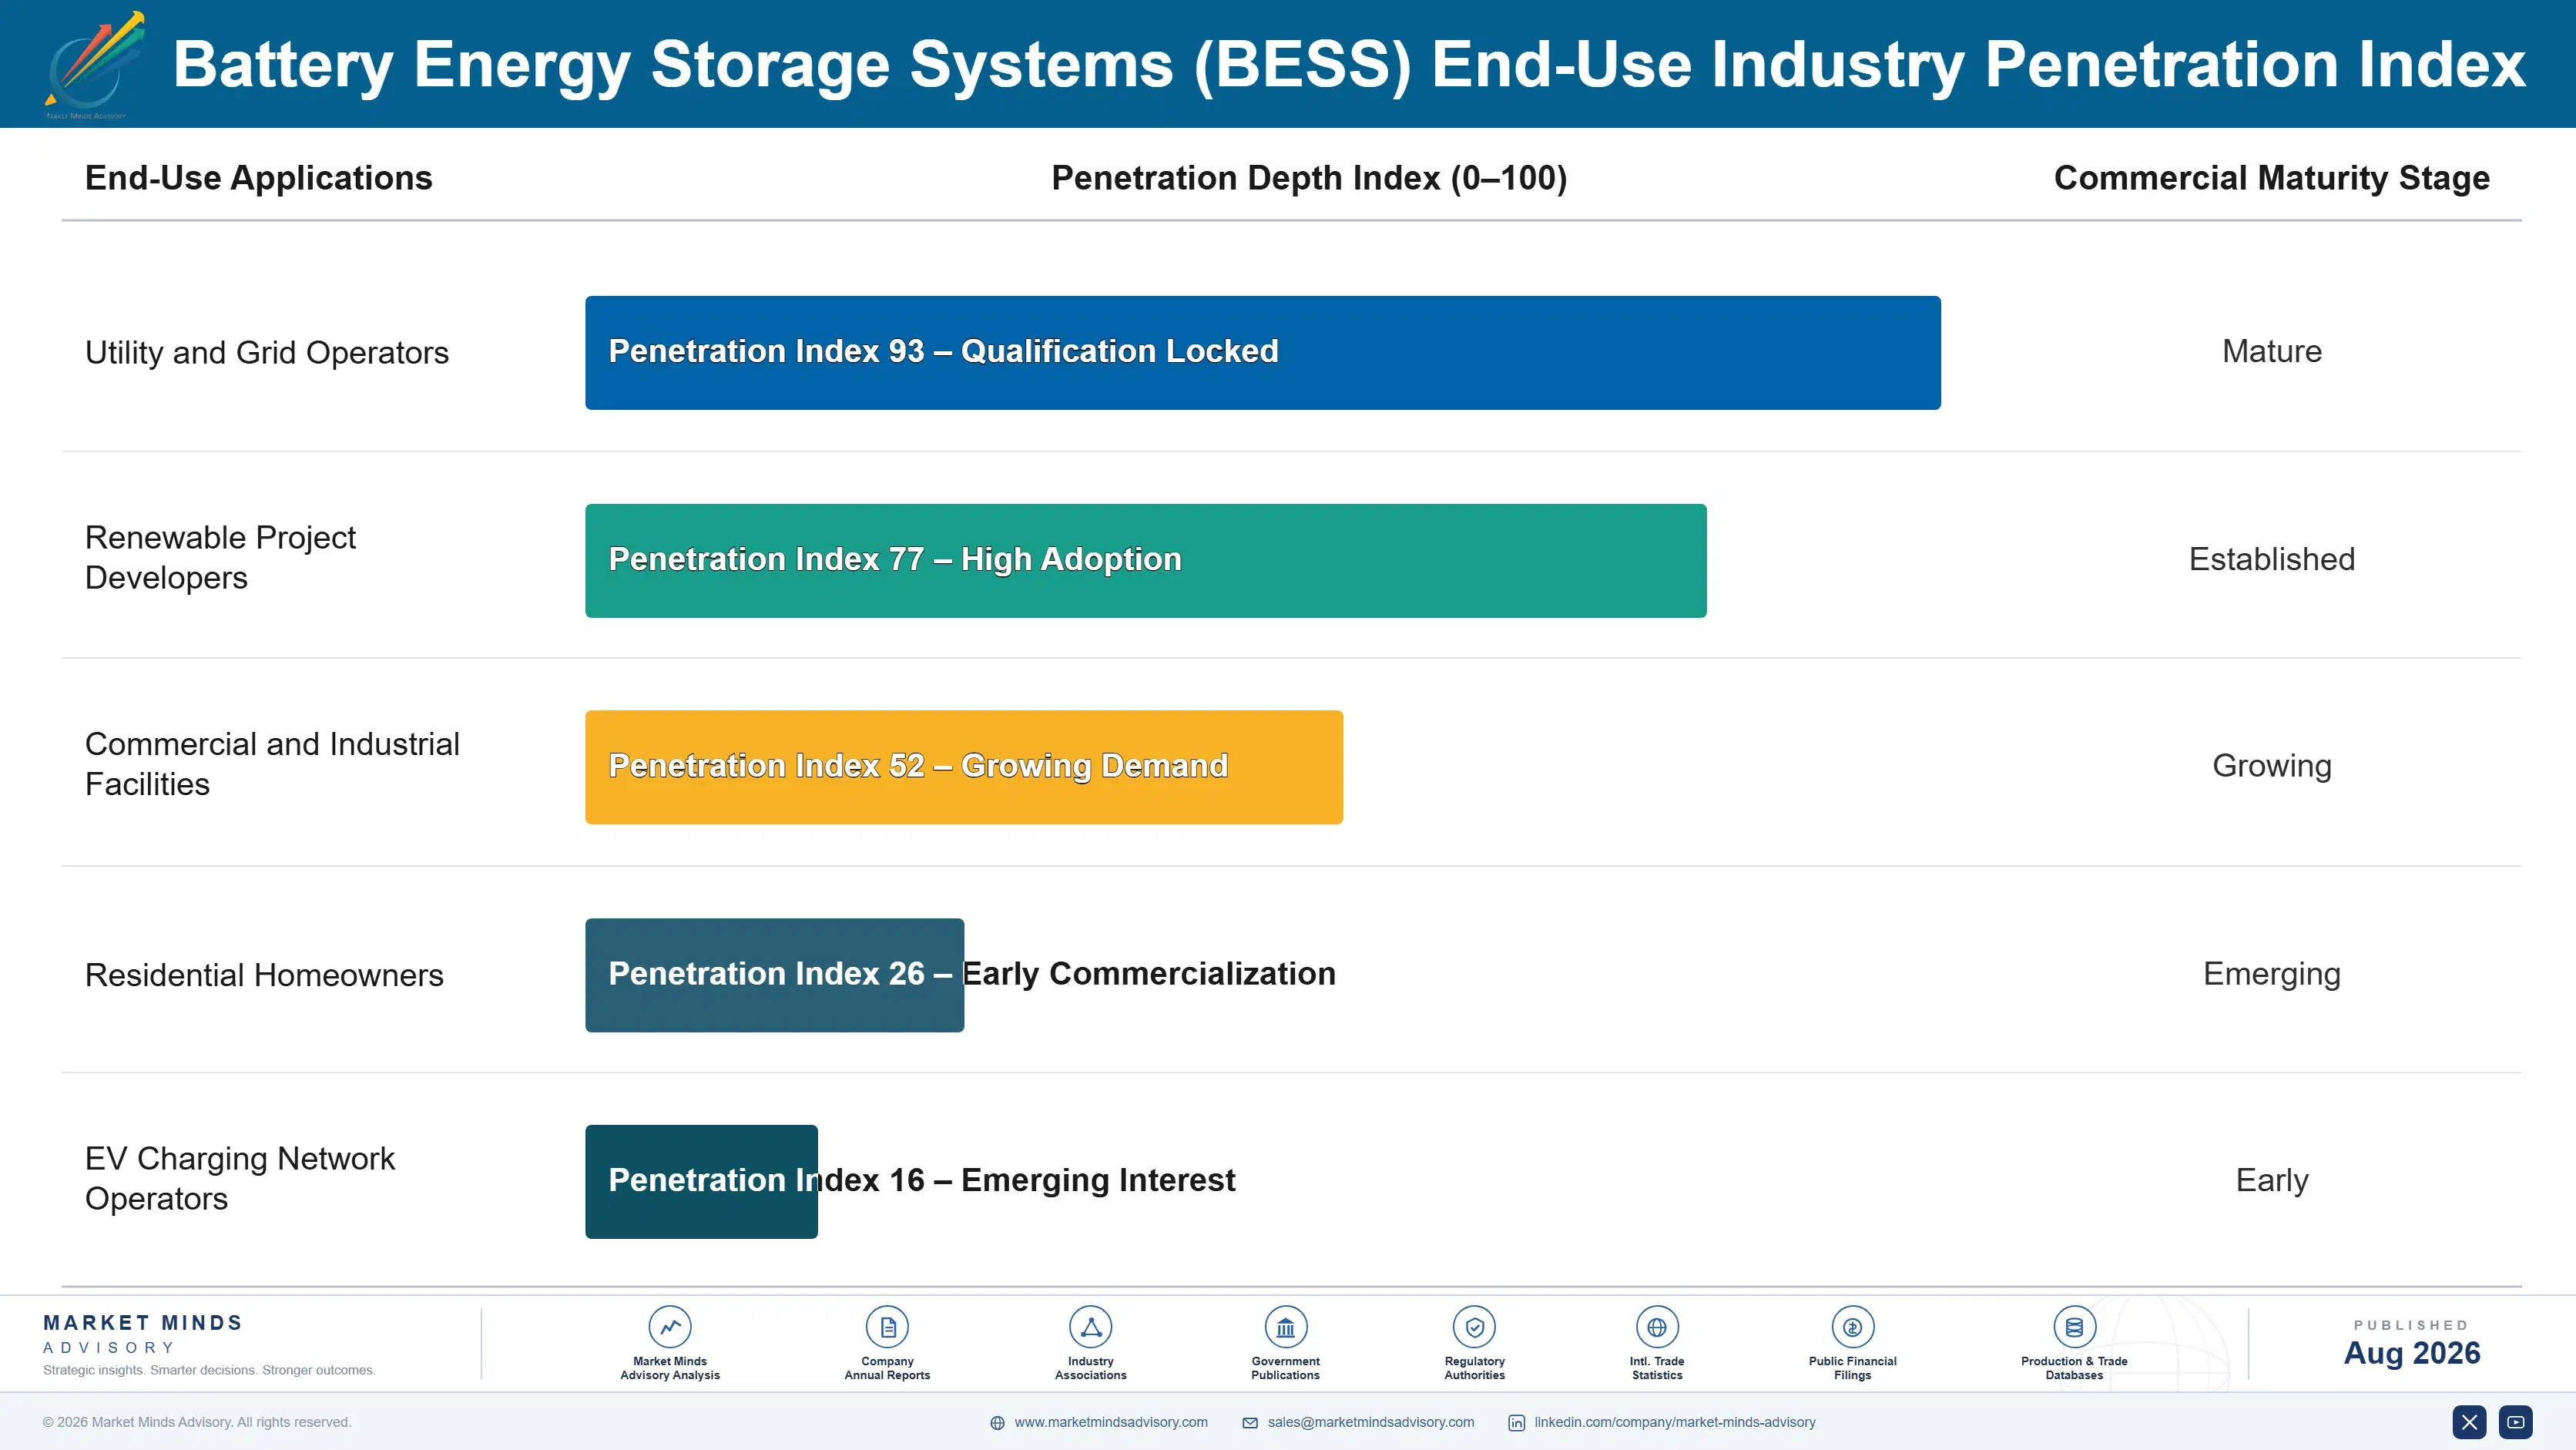
Revenue depends on multi-year contracted performance rather than a one-time equipment sale, and an operator's real earnings come from years of optimised dispatch across stacked revenue streams rather than the upfront hardware purchase price. An integrator winning a project captures recurring service and optimisation revenue for the asset's full operating life, typically 15 to 20 years, while losing the relationship means lost revenue across every future dispatch cycle.
Adoption depth varies sharply by buyer sophistication. Utility-scale operators adopt full revenue stacking first, since the software investment pays back quickly at scale across multiple simultaneous markets. Commercial and industrial buyers follow with a meaningful lag, prioritising bill management and backup power over sophisticated market participation. Residential buyers retain simpler backup-focused configurations largely unchanged, since the software complexity of full stacking rarely justifies itself at household scale.

Buyer profiles have shifted from pure equipment procurement toward asset management partnerships where integrators increasingly provide ongoing optimisation and safety monitoring alongside the hardware itself. Younger utility procurement teams increasingly treat revenue stacking software capability as a purchase criterion equal to cell chemistry specification, which favours integrators with genuine software sophistication over hardware-only competitors.
battery-energy-storage-systems-market-end-use-penetration-index-1787324731304

Our Read On Battery Energy Storage

These are among the four positions where our research anticipates prominent divergence between winners and laggards over the coming forecast period. Each is grounded in the demand model, the regulatory perimeter, and the announced capacity pipeline.
01 / REVENUE STACKING BEATS HARDWARE

Software dispatch, not cell chemistry, decides project economics

Operators layering energy arbitrage, capacity payments, and frequency regulation onto a single asset earn roughly 40% more per megawatt than those relying on any single revenue stream alone, a gap that keeps widening as more ancillary markets open to battery participation broadly. Fluence Energy and other dedicated optimisation platforms have built genuine competitive advantage around dispatch algorithms hardware-only sellers cannot replicate. Manufacturers and integrators should invest in stacking software now, since hardware alone is commoditising faster than most developers realise.
02 / SAFETY RECORD WINS CONTRACTS

Certification increasingly matters as much as price itself

Thermal runaway incidents have triggered fire code revisions and extended permitting review in multiple jurisdictions, and insurance premiums for battery storage projects have risen 20% to 40% following these events across the industry broadly and consistently across nearly every region. Manufacturers with strong safety track records and third-party certification increasingly win project selection over cheaper competitors, since developers now weigh safety record as heavily as price. Suppliers should invest in lithium iron phosphate chemistry and certification ahead of tightening requirements already arriving.
03 / CURTAILMENT MAKES STORAGE UNAVOIDABLE

Wasted renewable generation is now storage's core argument

Grid operators across California, Texas, and increasingly China have curtailed meaningful volumes of solar and wind generation during periods of oversupply, wasting renewable capacity utilities already paid to build and connect to the grid entirely and at real expense. Storage captures that otherwise-wasted generation and dispatches it during periods of higher demand or pricing, converting a pure loss into genuine revenue for the asset owner. Regulators should keep expanding storage co-location requirements, since curtailment losses only grow as renewable penetration continues rising.
04 / INTERCONNECTION DELAYS CAP GROWTH

Grid connection timing now limits deployment more than capital

Grid interconnection queues in major markets including the United States have grown to multi-year waiting periods, since transmission operators must study every proposed project's grid impact before granting connection approval regardless of how quickly storage itself could be built and commissioned onsite and ready. That delay ties up capital and stalls revenue generation for completed projects still awaiting approval from grid operators. Developers should treat interconnection timing as the primary scheduling constraint, filing early rather than after site and financing certainty.

Engagement Snapshot From the Field

A live engagement with an industry participant carrying material or product regulatory and market exposure ahead of a defining policy shift, showing how our research translates into a defensible multi-year portfolio strategy.
MARKET MINDS ADVISORY · CLIENT ENGAGEMENT SUMMARY
Battery Energy Storage Systems (BESS) Producer Strategic Portfolio Review and Transition Roadmap 2026·Investment Scenario on Battery Energy Storage Systems (BESS) Exposure Evaluation 2025-26
CLIENT PROFILE
An independent battery storage system integrator selling equipment on single-contract energy arbitrage terms engaged MMA as margin compression from Chinese cell competition accelerated across its core utility-scale business. The client reported annual revenue near USD 210 million, with roughly 90% tied to hardware sales and no proprietary revenue stacking software in its current offering (client-reported, unverified by MMA).
STRATEGIC CHALLENGE
Commercial leadership wanted to cut hardware pricing to match Chinese competitors, a strategy that would have compressed already thin margins further without addressing why customers were leaving for cheaper alternatives. Product leadership argued for building stacking software instead but lacked a clear business case quantifying the investment against realistic near-term revenue impact.
MMA APPROACH
MMA modelled margin outcomes under continued hardware price-matching versus redirecting capital toward stacking software development and ancillary market qualification instead of matching price directly. We assessed which specific utility customers carried genuine willingness to pay for optimisation capability, and we quantified the development timeline and cost for a viable software platform.
KEY FINDINGS
  1. Continued hardware price-matching against Chinese suppliers carried an estimated 25% margin compression within just eighteen months as competitors kept undercutting further and further.
  2. Developing a validated stacking software platform required roughly twelve months and USD 8 million in dedicated engineering investment and staff (client-reported, unverified by MMA).
  3. Utility-scale customers represented an addressable segment willing to pay a genuine 30% to 45% premium for demonstrated multi-market stacking capability alone entirely.
  4. Ancillary market qualification would secure frequency regulation revenue worth an estimated USD 15 million in annual addressable revenue within just two years.
CLIENT PROFILE
An independent battery storage system integrator selling equipment on single-contract energy arbitrage terms engaged MMA as margin compression from Chinese cell competition accelerated across its core utility-scale business. The client reported annual revenue near USD 210 million, with roughly 90% tied to hardware sales and no proprietary revenue stacking software in its current offering (client-reported, unverified by MMA).
STRATEGIC CHALLENGE
Commercial leadership wanted to cut hardware pricing to match Chinese competitors, a strategy that would have compressed already thin margins further without addressing why customers were leaving for cheaper alternatives. Product leadership argued for building stacking software instead but lacked a clear business case quantifying the investment against realistic near-term revenue impact.
MMA APPROACH
MMA modelled margin outcomes under continued hardware price-matching versus redirecting capital toward stacking software development and ancillary market qualification instead of matching price directly. We assessed which specific utility customers carried genuine willingness to pay for optimisation capability, and we quantified the development timeline and cost for a viable software platform.
KEY FINDINGS
  1. Continued hardware price-matching against Chinese suppliers carried an estimated 25% margin compression within just eighteen months as competitors kept undercutting further and further.
  2. Developing a validated stacking software platform required roughly twelve months and USD 8 million in dedicated engineering investment and staff (client-reported, unverified by MMA).
  3. Utility-scale customers represented an addressable segment willing to pay a genuine 30% to 45% premium for demonstrated multi-market stacking capability alone entirely.
  4. Ancillary market qualification would secure frequency regulation revenue worth an estimated USD 15 million in annual addressable revenue within just two years.
RECOMMENDED STRATEGY
Phase 1: Phase 1 (0 to 3 months): Halt hardware price-matching entirely and redirect capital toward stacking software development work immediately company-wide. Phase 2: Phase 2 (3 to 12 months): Complete software validation fully and pursue ancillary market qualification in parallel with ongoing development. Phase 3: Phase 3 (12 to 18 months): Launch the stacking platform targeting utility-scale customers willing to pay the optimisation premium fully.
OUTCOME
The client abandoned price-matching and launched a validated stacking software platform instead, securing utility-scale contracts at pricing roughly 35% above its legacy hardware-only offering within the first year. Ancillary market qualification secured frequency regulation revenue the board judged decisive for long-term margin recovery (client-reported, unverified by MMA).

Frequently Asked Questions

Foundational context covering the market sizes, CAGR, scope, country, region and competition that inform every finding below. This section is provided to cover basics and most often pre-purchase conversations, answered from the MMA Primary Research Dataset.

What is the current size of the Battery Energy Storage Systems (BESS) Market?

The global battery energy storage systems market is valued at USD 45.2 billion in 2025, covering utility, commercial, and residential-scale battery storage systems. Pumped hydro and EV traction batteries are excluded.

How large will the Battery Energy Storage Systems (BESS) Market be by 2036?

The market is forecast to reach USD 154.16 billion by 2036 in the base case, about 3.05 times the 2026 level. That represents incremental value of roughly USD 103.63 billion across the decade.

What is the CAGR for the Battery Energy Storage Systems (BESS) Market 2026 to 2036?

The market grows at a 11.8% CAGR in the base case, with bull and bear scenarios at 13.0% and 10.5%. The spread turns mainly on ancillary market expansion and safety incident frequency.

Which segment is growing fastest?

Grid ancillary services and frequency regulation storage grow fastest at 15.5%, about 1.31 times the overall rate, as grid operators pay premium rates for response speed. EV charging-integrated storage follows at 14.2%.

Who are the major companies in the Battery Energy Storage Systems (BESS) Market?

Leading companies include CATL, BYD, Tesla Energy, Fluence Energy, and LG Energy Solution. Concentration is moderate, with the top five holding roughly 48% of revenue.

Which country is growing fastest?

India grows fastest at a 16.8% CAGR, driven by renewable integration mandates requiring storage co-location at national scale. China remains the largest producer on manufacturing and deployment scale combined.

Report Segmentation Architecture

The full report scope spans multiple orthogonal segmentation dimensions, with cross-tabulated demand data provided for each dimension pair. Coverage extends further to regional breakdowns, trend trajectories, and the competitive detail needed to support segment-level decision-making.

By Deployment Application

  • Grid Ancillary Services and Frequency Regulation Storage
  • EV Charging-Integrated Storage
  • Residential Storage
  • Commercial and Industrial Storage
  • Utility-Scale Grid Storage
  • Off-Grid and Microgrid-Coupled Storage

By End-Use Industry

  • Utility and Grid Operators
  • Renewable Project Developers
  • Commercial and Industrial Facilities
  • Residential Homeowners
  • EV Charging Network Operators

By Commercial Dimension

  • Utility-Scale Contracted Projects
  • Merchant and Ancillary Market Participation
  • Behind-The-Meter Commercial Sales
  • Residential Retail Channel

By Region

  • North America
  • Western Europe
  • East Asia
  • South Asia and Pacific
  • Latin America
  • Middle East and Africa
  • Eastern Europe

Scope, Methodology, and Coverage

Every figure in this report is reproducible from documented input assumptions. The scope below maps the historical period, the forecast horizon, the segmentation dimensions, and the countries covered, alongside the underlying primary and qualitative methodology.
Historical Period
2020 to 2025
Forecast Period
2026 to 2036
Base Year
2025 (USD billions; MMA Primary Research Dataset, August 2026)
Market Definition
The battery energy storage systems market comprises rechargeable battery-based storage systems, including cells, modules, power conversion equipment, and thermal management, valued at manufacturer and integrator net revenue. It spans utility-scale, commercial and industrial, residential, and grid ancillary service deployments across lithium iron phosphate, nickel manganese cobalt, and emerging chemistries. Pumped hydro, compressed air, hydrogen storage, and electric vehicle traction batteries sold separately from stationary storage are excluded.
Quantitative Units
USD billions (current prices); installed capacity in megawatt-hours where applicable
Segmentation Dimensions
By Deployment Application; By End-Use Industry; By Commercial Dimension; By Region
Regions Covered
North America, Western Europe, East Asia, South Asia and Pacific, Latin America, Middle East and Africa, Eastern Europe
Countries Covered
USA, China, Germany, France, UK, Japan, South Korea, India, Australia, Canada, Brazil, Mexico, Indonesia, Vietnam, Thailand, Malaysia, UAE, Saudi Arabia, South Africa, Nigeria, Turkey, Poland, Netherlands, Italy, Spain, Sweden, Switzerland, Argentina, Colombia, Singapore, and additional markets relevant to this sector
Key Companies Profiled
CATL, BYD, Tesla Energy, Fluence Energy, LG Energy Solution, Samsung SDI, Sungrow Power, Wartsila Energy Storage, EVE Energy, Hithium, Trina Storage, Powin Energy, NHOA Energy, Saft, Envision AESC, Hitachi Energy, ESS Inc., Form Energy, Invinity Energy Systems, Narada Power
Quantitative Methodology
Primary survey, n=3,800 respondents, Q4 2025, six countries; demand-side model with trade association cross-validation
Qualitative Methodology
47 expert interviews, Q4 2025; applied to validate demand model assumptions, identify emerging dynamics, and assess competitive positioning
Report Format
PDF and XLSX data workbook (Word format preview document)
Publisher
Market Minds Advisory
Report Code
MMA-2026-ENE-105
Published
August 2026
Contact
sales@marketmindsadvisory.com | www.marketmindsadvisory.com

Purchase the full Battery Energy Storage Systems (BESS) Market Report (2026 to 2036).

The full MMA Battery Energy Storage Systems report sizes the market across six applications, five end-use industries, four commercial dimensions, and seven regions through 2036 in considerable detail. It profiles 20 companies on a consistent revenue basis, scoring each on revenue stacking capability, safety certification, and manufacturing cost position. Scenario models quantify how ancillary market expansion, safety incident frequency, and interconnection timing move addressable demand by application. The report also includes lithium and nickel cost benchmarking, ancillary market qualification tracking, and regional interconnection queue analysis for developers and integrators.
Six-application and four-channel market sizing to 2036
Twenty-company benchmark on consistent integrator revenue basis
Ancillary market qualification tracking across major regulated grids
Lithium and nickel cost benchmarking against volatility events
Revenue stacking analysis by application and grid market
Regional interconnection queue assessment for developer strategy teams

Built For The People Who Decide

From boardroom strategy to bench-side execution, this report is read cover-to-cover by leaders shaping the next decade of their industry, turning demand scenarios, market dynamics and valuation benchmarks into decisions.
CXOs/ Presidents/ VPs/ Managers
M&A and Corporate Development
Strategy Teams and R&D Heads
Procurement and Product Directors
Regulatory and Compliance Leaders
Investor Relations and Equity Analysts