Market Minds Advisory
Autonomous Underwater Vehicles (AUV) Market

Autonomous Underwater Vehicles (AUV) Market: The Data Is Worth What Its Position Is Worth

There is no satellite fix underwater, so every survey a vehicle returns is worth exactly as much as the position tagged onto it, and drift accumulates from the moment it dives.

Lead Analyst

David Horsley

Published

August 2026

Make Smarter Decisions with Customized Research Insights

Request a free sample report and evaluate market opportunities, growth trends, and competitive dynamics relevant to your business needs.

2025 MARKET VALUE$2.4BMarket Size 2025
2036 FORECAST VALUE$7.9BBase Case , 2026 to 2036
CAGR 2026 TO 203611.4 %Bull 12.7% / Bear 10.1%
INCREMENTAL OPPORTUNITY$5.2BNet 10- year value creation
EXPANSION MULTIPLE2.94x2036 value over 2026 base
Strategic Levers
M&A Pipeline
Regional Outlook
Country Rankings
Competitive Intelligence
Segmental Deep-dive
Call-Us : 91 93563 13602

Executive Snapshot and Market Trajectory

An autonomous underwater vehicle has no satellite fix and no tether feeding it a position, so it navigates by dead reckoning that drifts at roughly 0.05% of distance travelled. Every dataset it returns is worth what that position tag is worth, which makes navigation rather than autonomy the product.
Growth runs at 11.4% and large vehicles lead it. Extra-large autonomous undersea vehicles grow at 17.1%, exactly 1.50 times the market rate, driven almost entirely by defence programmes buying endurance and payload volume. North America holds 34%, above band, because United States undersea autonomy procurement exceeds every other country's and most manufacturers sit there. Defence now carries around 47% of value. Commercial survey buys area covered per vessel day instead of any of that.
Concentration is moderate at 51% across the top five measured on vehicle and system revenue, and navigation capability rather than vehicle construction holds it. Building a pressure hull is well within many engineering firms; building an inertial and acoustic navigation solution that survives a long dive is not, and very few organisations do it. Defence and commercial survey buy on incompatible criteria. Very few customers decide those programmes.
Market Definition
This market covers untethered autonomous underwater vehicles and the navigation, payload, and launch systems supplied with them, spanning micro and portable AUVs, survey-class torpedo AUVs, hover-capable inspection AUVs, gliders and long-endurance vehicles, and extra-large autonomous undersea vehicles. Tethered remotely operated vehicles, surface autonomous vessels, towed survey systems, standalone sonar and sensor sales, support vessels and their chartering, and survey data processing services sold independently fall outside scope.
Base Year Value
$2.4B in 2025 (MMA Primary Research Dataset, August 2026)
Forecast Period
2026 to 2036, eleven discrete annual values
CAGR
11.4% base case. Bull 12.7%. Bear 10.1%.
Fastest Growth Segment
Extra-Large Autonomous Undersea Vehicles: 17.1% CAGR
Fastest Growth Country
Australia: 15.2% CAGR
Fastest Growth Region
South Asia and Pacific: 13.5% CAGR
Largest Region
North America: 34% of 2025 global value
Market Leaders
Kongsberg Maritime, Teledyne Marine, Saab, Anduril, Ocean Infinity. Source: MMA Analysis based on company annual reports.
Primary Survey
n=3,800 procurement and R&D decision-makers, Q4 2025, six countries
Methodology
Demand-side build-up, cross-validated against public data, 47 expert interviews

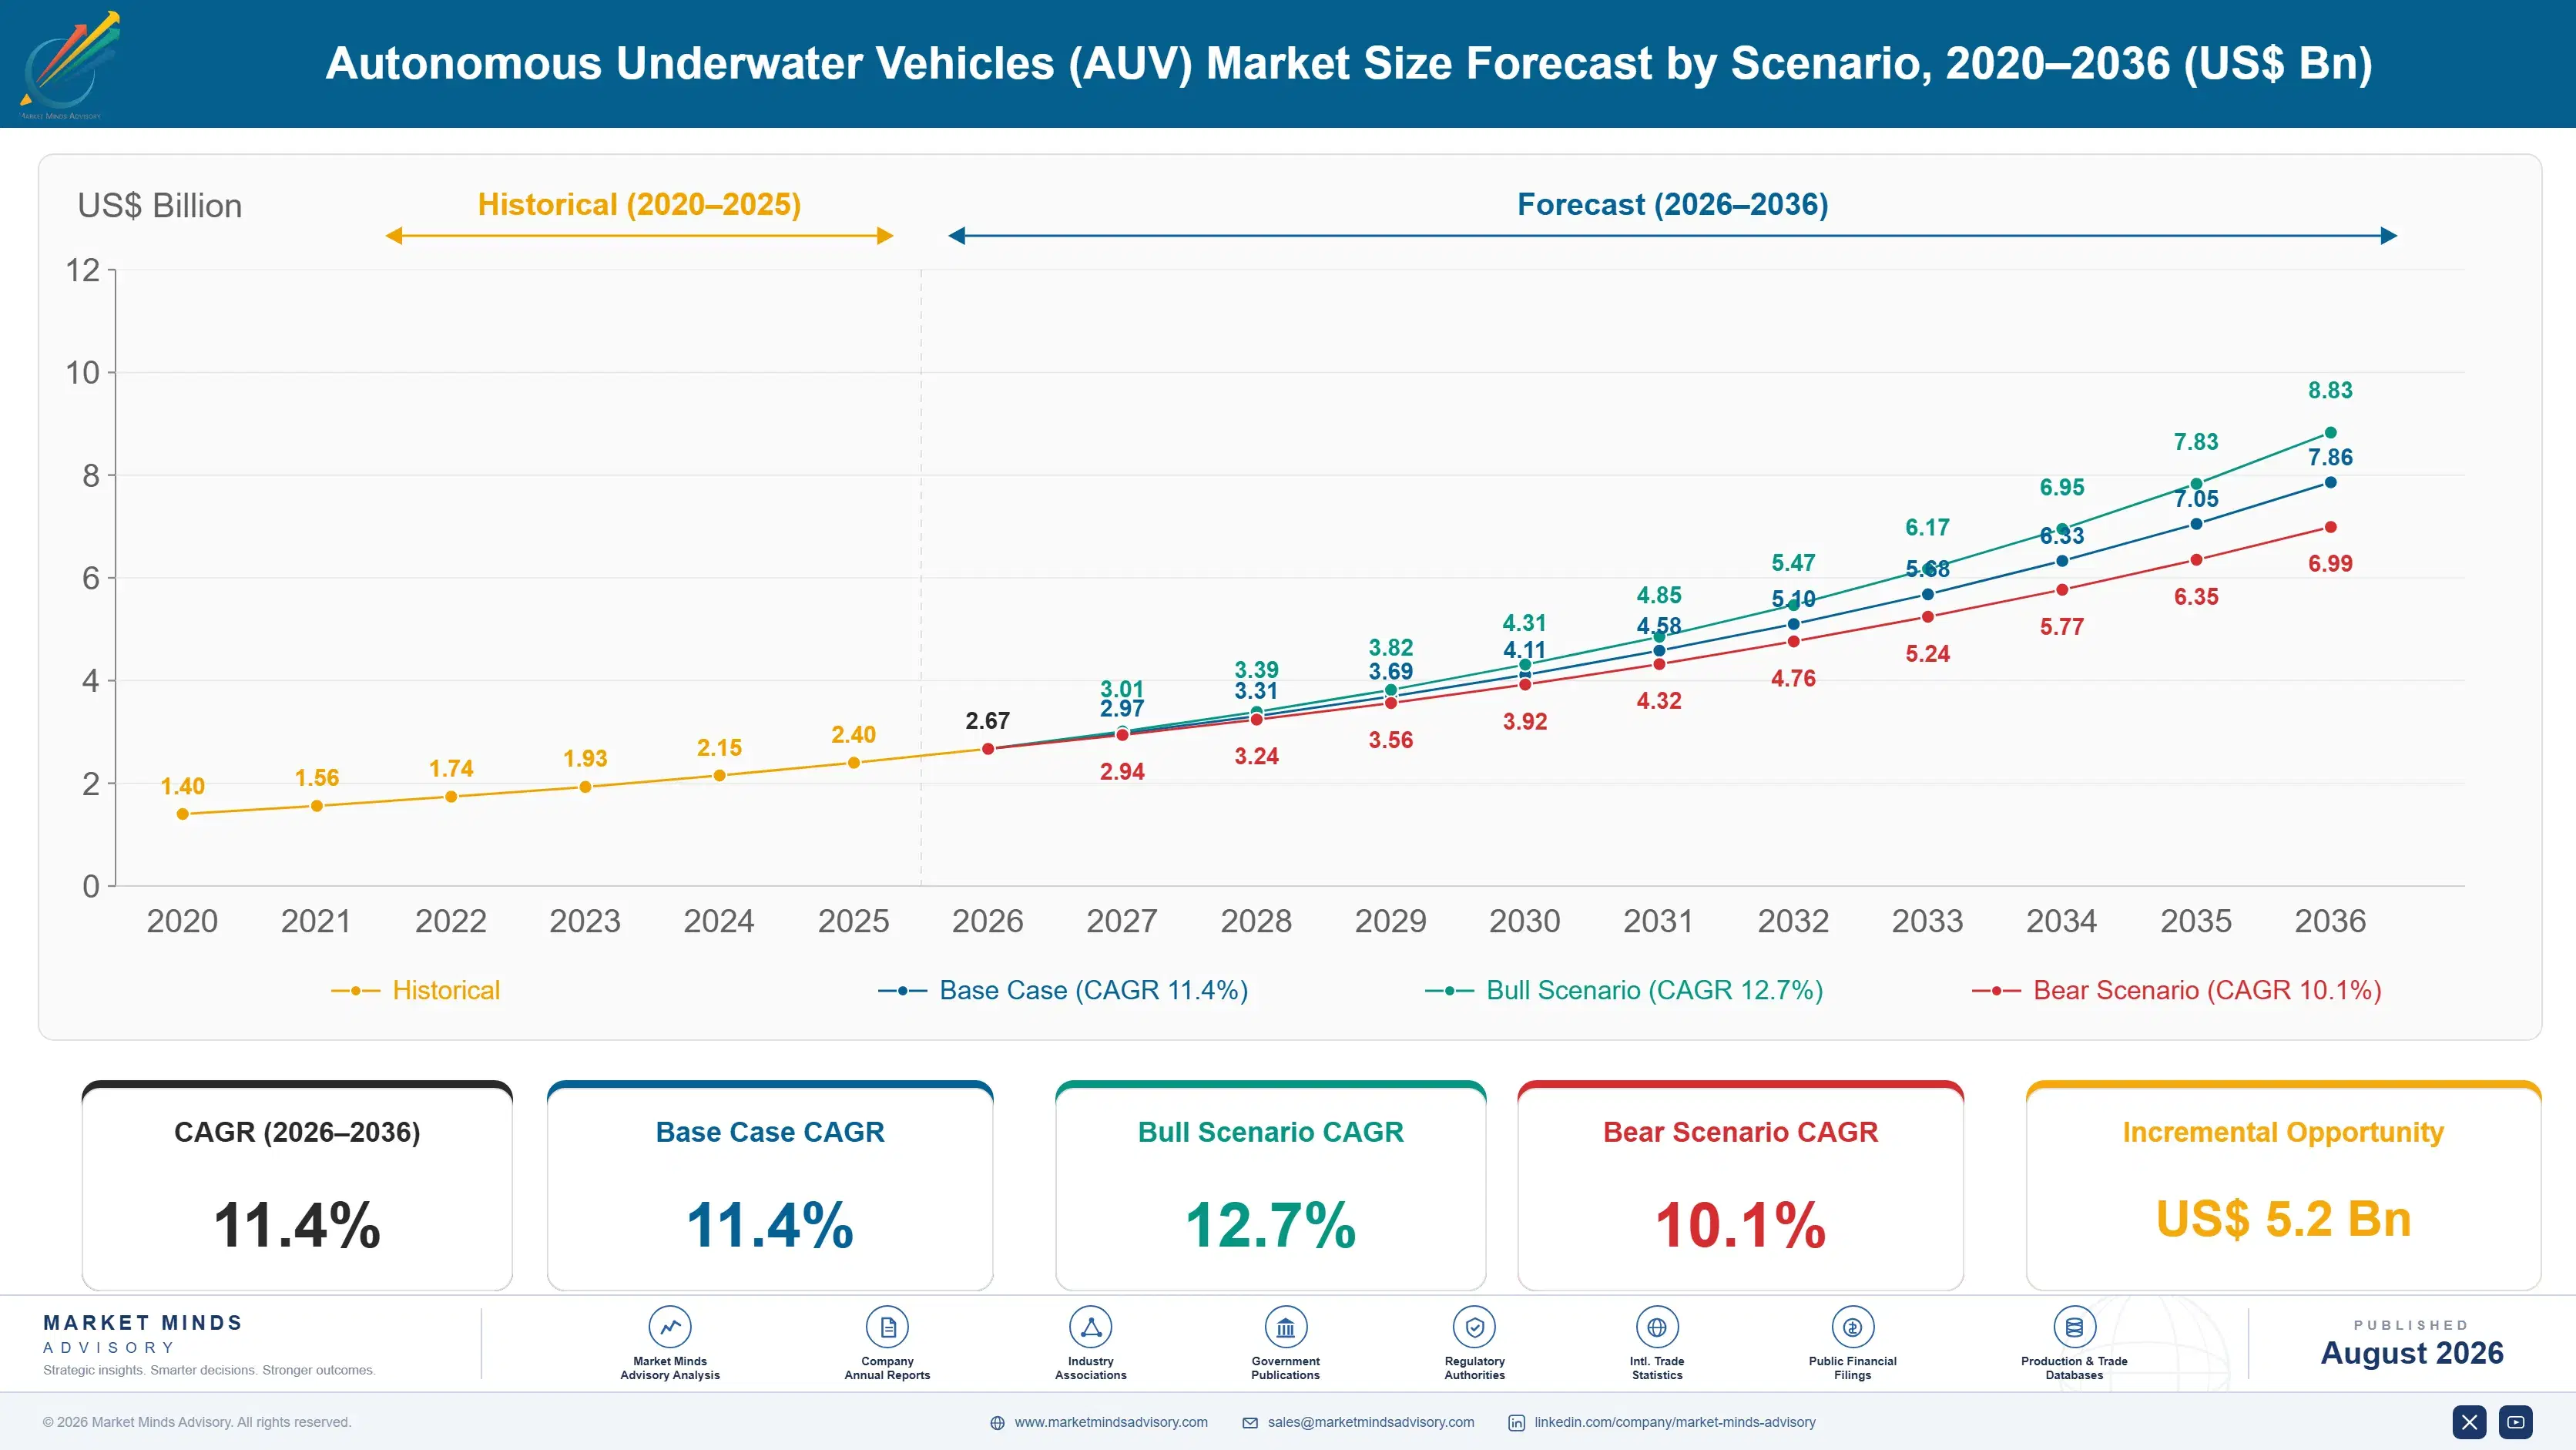
Autonomous Underwater Vehicles (AUV) Market Forecast Scenarios

autonomous-underwater-vehicles-auv-market-size-forecast-scenario-1787302630083
The 2020 to 2025 period ran at 9.9% and defence procurement changed the shape of it entirely. Commercial survey work paused through 2020 as offshore activity stopped, then recovered on offshore wind site characterisation from 2022. Defence undersea autonomy programmes accelerated throughout and by 2024 accounted for a larger share of value than commercial survey did, which had not been true at the start of the period.
Three mechanisms carry the 11.4% base case. Defence undersea autonomy is the largest, since several navies are procuring large vehicles for missions that crewed submarines currently perform at far higher cost. Offshore wind site survey is the second, growing with lease areas requiring characterisation before any turbine is designed. And subsea infrastructure inspection is the third, replacing vessel-based campaigns. Ocean science demand sits beneath all three, funded on entirely separate cycles.
The 12.7% bull case rests on extra-large vehicle programmes moving from demonstration into fleet procurement across several navies simultaneously, which would multiply unit values well beyond commercial vehicle pricing. The 10.1% bear case is defence budget reprioritisation away from undersea autonomy, since that spending now carries a large share of value and commercial survey alone would not replace it.

Position Is The Actual Product

The hard problem underwater is knowing where you are. Satellite positioning does not penetrate seawater, so an autonomous vehicle navigates by inertial measurement corrected against bottom-tracking sonar and occasional acoustic fixes, and error accumulates at roughly 0.05% of distance travelled. A seabed feature mapped beautifully and tagged in the wrong place is worth nothing to anybody who has to go back and find it.
TOP FIVE CONCENTRATION51%Moderate, held through navigation systems rather than through vehicle hulls
NAVIGATION DRIFT RATE0.05%Of distance travelled, accumulated without any external positioning fix
DEFENCE SHARE OF VALUE47%Of market value bought on criteria that commercial survey ignores
SURVEY-CLASS ENDURANCE24 hoursBetween recoveries for a standard mid-size survey vehicle today
VESSEL COST SHARE61%Of a survey campaign, before the vehicle itself is counted
AREA COVERED PER DEPLOYMENT180 sq kmOf seabed mapped in one mission at survey altitude
That makes navigation the competitive dimension rather than autonomy or hull design. Building a pressure vessel that survives depth is within reach of many engineering firms, and building an inertial and acoustic navigation solution that holds position across a twenty-four hour dive is not. Concentration at 51% follows from that, and the companies holding it are generally navigation businesses that happen to build vehicles.
Two customers with almost nothing in common share the market. Defence now accounts for around 47% of value and buys on endurance, covertness, payload volume, and national supply, while commercial survey buys on area covered per vessel day against a campaign where the vessel carries 61% of cost. A vehicle optimised for one is frequently unsuitable for the other.
"Everybody asks about autonomy. Autonomy is largely solved. What nobody outside this industry appreciates is that the vehicle spends its whole mission slowly becoming less certain about where it is, and that uncertainty is what you are buying down."
Director, Marine Autonomy and Subsea Systems Practice · MMA Subsea Technology an

Market Trends

Defence Programmes Now Set The Technology Agenda

Extra-large autonomous undersea vehicles grow at 17.1% against 11.4% for the market as several navies procure vehicles for missions that crewed submarines currently perform at far greater cost and risk. Defence now carries around 47% of value and buys on endurance, covertness, and payload volume rather than on survey productivity. That has pulled development priorities toward capabilities commercial survey customers will never pay for at all. Unit values here sit orders of magnitude above commercial survey vehicles. A handful of programme decisions move the whole segment. Very few organisations can build them at all.
Market Impact: Drift accumulates at 0.05% rate
Offshore Wind Survey Replaces Vessel-Based Campaigns

Lease areas require geophysical and geotechnical characterisation before any turbine layout is designed, and an autonomous vehicle covering around 180 square kilometres per deployment does that with far less vessel time than a towed system needs. Vessel cost carries 61% of a survey campaign, so area per vessel day rather than vehicle capability is the number that decides awards. Very few suppliers quote it that way. Clients increasingly write positional accuracy into tenders ahead of any sensor specification at all. That reverses the comparison suppliers expect. Navigation heritage decides those awards.
Market Impact: Vessels carry 61% of cost

Market Opportunities and Growth Drivers

Navigation Accuracy Determines Survey Data Value

Position error accumulating at roughly 0.05% of distance travelled sets how precisely a feature can be relocated, and a geotechnical target that cannot be found again is worth nothing to the engineer who needs to drill it. Clients increasingly specify positional accuracy rather than sensor resolution in tender documents. That shift favours suppliers whose navigation heritage predates their vehicle business, and it disadvantages entrants competing on hull and autonomy alone. Navigation businesses that later built vehicles hold this ground more securely than vehicle builders. Entrants competing on hull and autonomy alone cannot close it quickly.
Market Impact: Endurance caps near 24 hours

Vessel Economics Reward Area Covered Per Day

A survey campaign spends around 61% of its cost on the support vessel, so the commercial argument for autonomy is vessel days removed rather than any capability the vehicle possesses. Covering roughly 180 square kilometres per deployment converts directly into that saving. Suppliers presenting endurance and sensor specifications are describing inputs, while the client is calculating an output that only some proposals actually state. Proposals stating that output rather than the inputs behind it win against technically comparable competitors. Very few suppliers make the translation. The client makes it anyway.
Market Impact: Defence buys 47% of value

Market Restraints and Challenges

Energy Density Caps Endurance And Therefore Coverage

Survey-class vehicles run around 24 hours between recoveries and the root cause is that battery energy density has improved far more slowly than autonomy, sensors, or navigation have. Commercial impact is that coverage per deployment is bounded by chemistry rather than by any design decision, and every recovery consumes vessel time the customer is paying for. Mitigation runs through subsea docking stations, fuel cell and hybrid power development, and mission planning that maximises useful survey within the available window. Recovery engineering is a tractable problem and far fewer suppliers work on it than on batteries.
Market Impact: Defence takes 47% of value

Defence And Commercial Requirements Actively Conflict

Defence buys endurance, covertness, payload volume, and national supply chains while commercial survey buys area per vessel day and open data interfaces, and the root cause is that the two are solving unrelated problems with the same vehicle category. Commercial impact is that a design optimised for one serves the other badly. Mitigation runs through separate product lines, modular payload architectures, and honest acceptance that one platform rarely satisfies both customers. A stretched platform satisfies neither procurement process and has cost suppliers positions in both markets. Modular payload architecture captures the shared engineering.
Market Impact: Vessel cost carries 61% of campaign
4 additional market trends, 3 additional growth drivers, and 2 additional restraints and challenges are covered in the full report. Contact sales@marketmindsadvisory.com to access the complete intelligence.

Segment CAGR and Growth Architecture

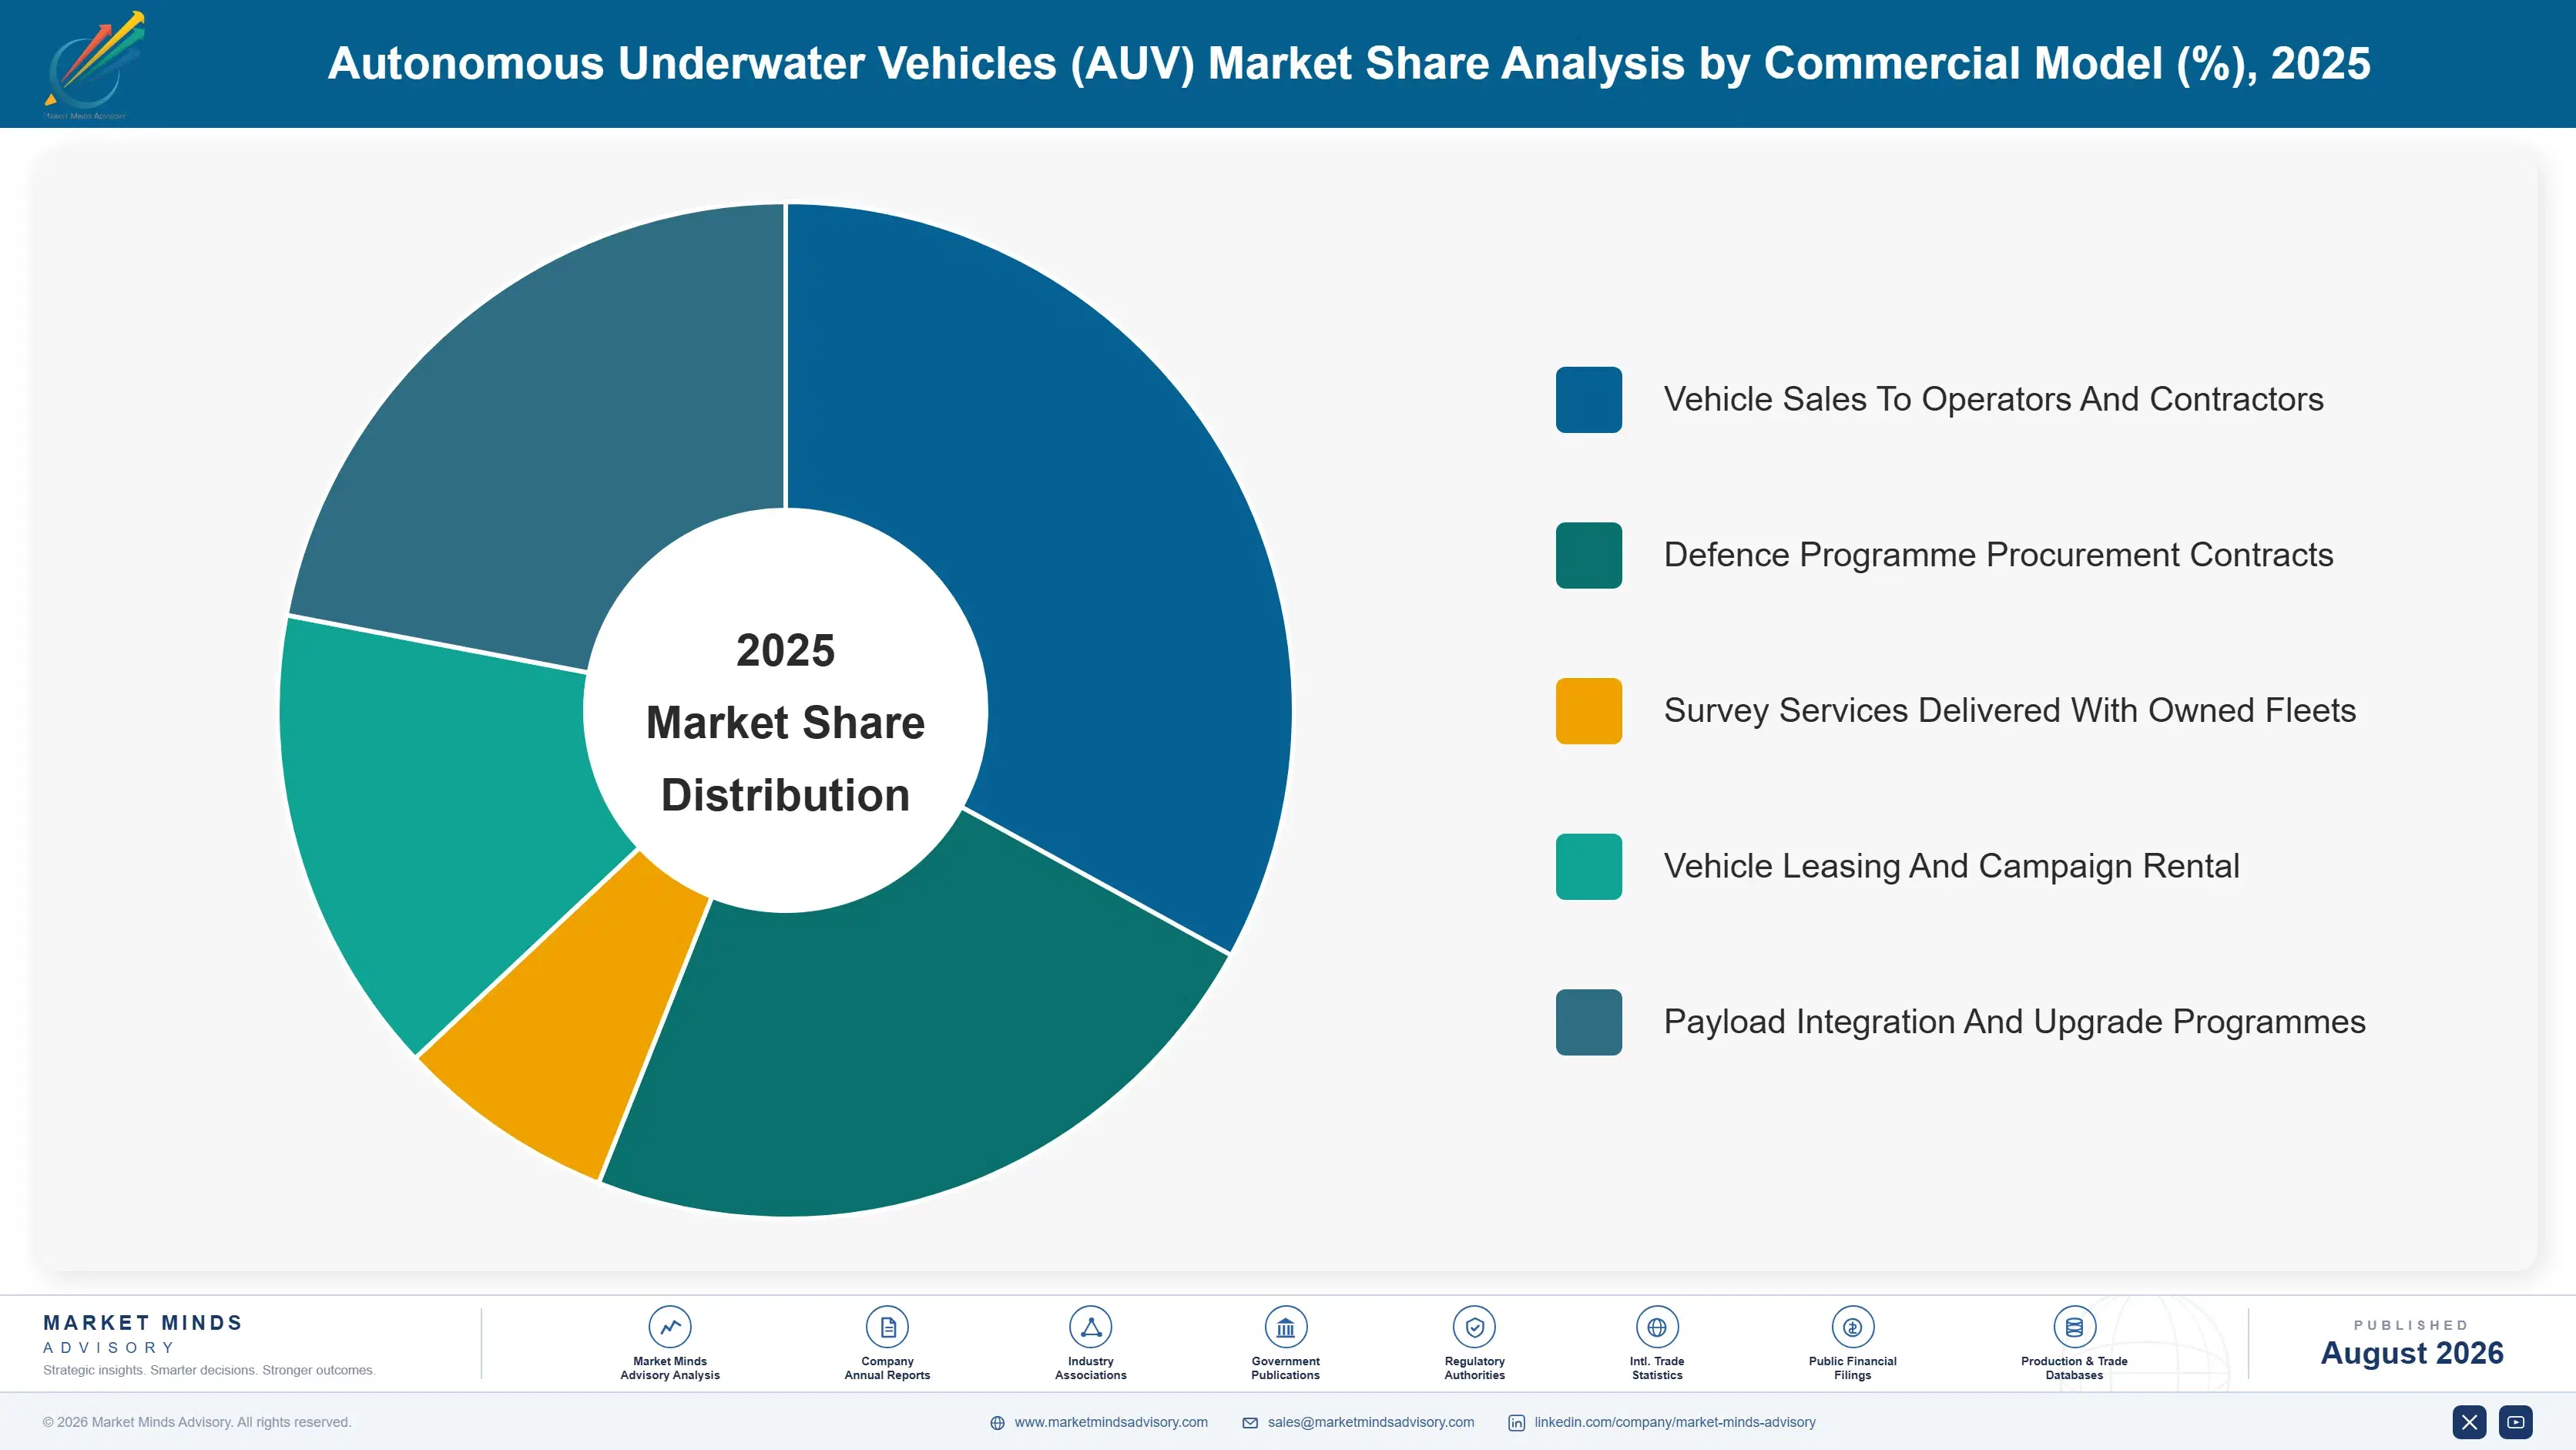
Segmentation follows vehicle class by size and mission profile, because those determine endurance, payload capacity, launch and recovery requirement, navigation specification, and which customer the vehicle is built for. Application and water depth both cut across every class rather than separating them, which makes either weaker as a primary dimension. Class also decides which customer buys it.
autonomous-underwater-vehicles-auv-market-market-share-analysis-1787302630617

Extra-Large Autonomous Undersea Vehicles

The fastest class at 17.1%, exactly 1.50 times the market rate, covering vehicles large enough to carry substantial payloads on missions lasting weeks and launched from a quay rather than a vessel. Defence procurement drives essentially all of it, since these vehicles perform missions crewed submarines currently undertake at far higher cost and risk. Unit values sit orders of magnitude above commercial survey vehicles, which makes a small number of programme decisions move the whole segment. Very few organisations can build or integrate them at all. National supply requirements and security clearances matter more here than any technical comparison does. Marine engineering heritage counts for surprisingly little. Programme access decides these awards.
CAGR 17.1%

Hover-Capable Inspection AUVs

Second fastest at 13.5%, covering vehicles able to stop, hold station, and inspect a structure rather than only flying a survey line, which brings autonomous inspection into work that tethered vehicles previously monopolised. Subsea infrastructure integrity and offshore wind foundation inspection carry most of the demand. Station-keeping without a tether demands navigation and control performance that survey-class vehicles never require, and the resulting vehicles cost considerably more while removing far more vessel time from the client's campaign. Subsea docking allows these vehicles to remain resident on site between missions rather than returning for recovery. That removes vessel time without any chemistry breakthrough. Very few suppliers pursue it. Vessel time is the real saving.
CAGR 13.5%
Full segment breakdown across 5 segments available in the complete report.

Regional Architecture and Country Demand Map

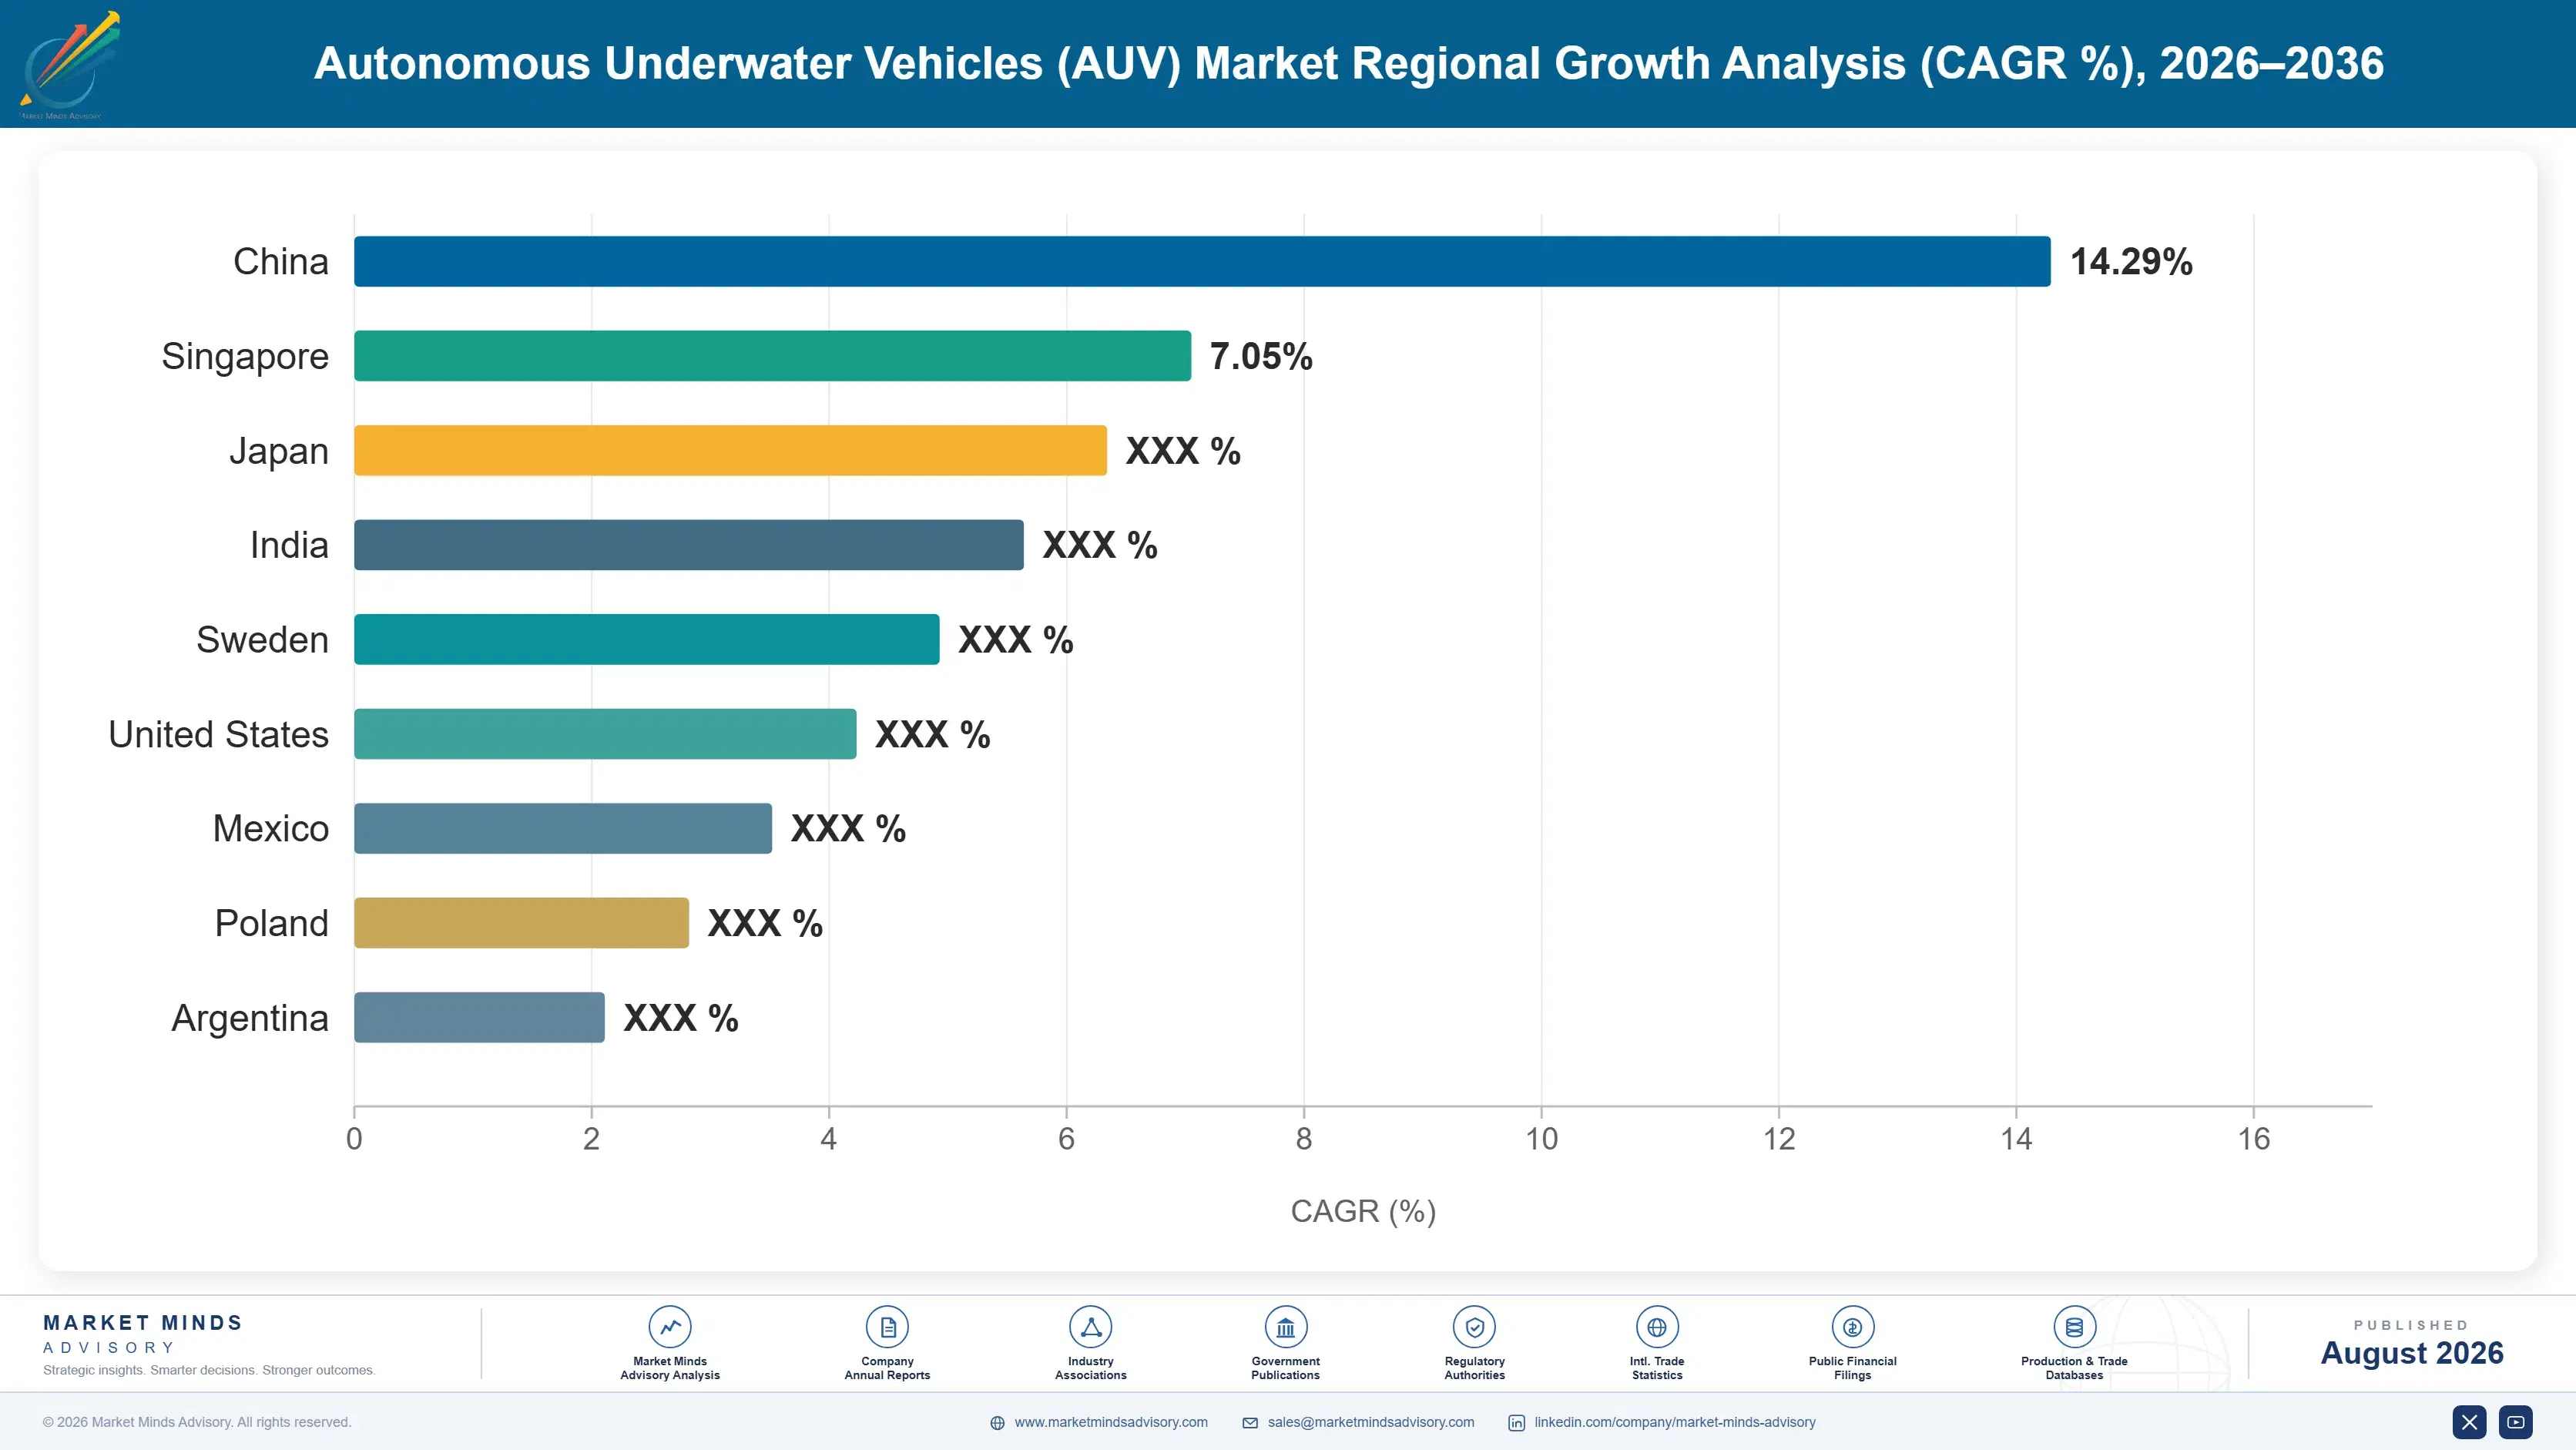
North America leads at 34%, above band, because United States undersea autonomy procurement exceeds every other country's and most manufacturers are based there. Western Europe follows. Australia grows fastest. Three regional shares sit outside their framework bands. Naval procurement and manufacturer location explain them. Survey activity adds the rest.

North America

Thirty-four percent, above the framework band, and the reason is unusually specific rather than a default assumption. United States undersea autonomy procurement exceeds every other country's programme spending, several of the largest vehicle manufacturers and navigation specialists are based there, and ocean science funding adds a third demand base that few countries maintain. Gulf of Mexico survey work contributes commercial volume alongside all of that. Growth at 11.0% sits near the market rate, carried by defence programmes rather than commercial survey. Defence primes with no marine heritage have entered through undersea autonomy programmes and win on systems integration and clearance. That competition is unusual to this region. Clearance and national supply decide it.
Share: 34% | CAGR: 11.0% (2026 to 2036)

Western Europe

Twenty-two percent, and Norwegian, British, and French navigation and vehicle capability accounts for a disproportionate share of the technology rather than the spending. North Sea offshore wind site characterisation generates the largest commercial survey demand anywhere, and mine countermeasure programmes across several navies add defence volume. Norwegian navigation heritage in particular shapes what the whole industry can do. Growth at 9.8% is the slowest of any region, reflecting mature commercial demand rather than any capability limitation. Mine countermeasure programmes across several navies favour smaller vehicles with different requirements from the extra-large platforms dominating elsewhere. Two defence markets exist under one heading. Very few suppliers serve both. Requirements diverge sharply between them.
Share: 22% | CAGR: 9.8% (2026 to 2036)
Regional intelligence for 5 additional markets available in the complete report: South Asia and Pacific, East Asia, Latin America, Middle East and Africa, Eastern Europe. Contact sales@marketmindsadvisory.com.
autonomous-underwater-vehicles-auv-market-country-cagr-analysis-1787302631138

Navigation, Vessel Days And Two Customers

Drift accumulates at 0.05% of distance, vessels carry 61% of campaign cost, defence takes 47% of value, and large vehicles grow at 17.1%. Value comes from navigation performance, from quoting vessel days removed, and from separating two incompatible customers. Hull engineering decides very little of it. Navigation and translation decide most of it. Nothing else does.

Compete On Positional Accuracy Rather Than Sensor Resolution

Position error accumulating at roughly 0.05% of distance travelled decides whether a mapped feature can be relocated, and a target the engineer cannot find again is worth nothing whatever the sonar resolved. Clients increasingly write positional accuracy into tenders rather than sensor specification. Suppliers whose navigation heritage predates their vehicle business hold an advantage that entrants competing on hull and autonomy cannot close quickly. Navigation and positioning carry roughly 26% of vehicle cost and decide what the data is worth. Everything else is a platform for carrying it. Clients have started noticing.
Market Impact: Drift accumulates at 0.05% of the d

Quote Vessel Days Removed, Not Vehicle Specifications

A survey campaign spends around 61% of its cost on the support vessel, so the client is calculating area per vessel day while the supplier is usually describing endurance and payload. Covering roughly 180 square kilometres per deployment converts directly into vessel days saved. Proposals stating that output rather than the inputs behind it consistently win work from technically comparable competitors who never made the translation. Endurance, depth rating, and payload capacity are all inputs the client converts anyway. Making that conversion in the proposal removes the work and the doubt together. Few suppliers do it.
Market Impact: Vessels carry 61% of the total camp

Separate Defence And Commercial Product Lines Honestly

Defence buys endurance, covertness, payload volume, and national supply chains while commercial survey buys area per vessel day and open interfaces, and defence now carries 47% of value. A single platform stretched across both serves each badly and satisfies neither procurement process. Modular payload architectures capture some shared engineering, and pretending one vehicle suits both customers has cost several suppliers positions in both markets. Extra-large defence vehicles grow at 17.1% and share almost nothing with a survey platform. One product line cannot straddle that gap. Several suppliers have tried. None succeeded.
Market Impact: Defence now takes 47% of all market

Solve Recovery Rather Than Chasing Battery Endurance

Survey vehicles run around 24 hours between recoveries and battery energy density has improved far more slowly than every other subsystem, so endurance gains arrive slowly and expensively. Subsea docking, over-the-side autonomous recovery, and unattended charging remove vessel time without needing any chemistry breakthrough at all. That is a solvable engineering problem and considerably fewer suppliers are working on it than on the battery. Subsea docking, autonomous recovery, and unattended charging each remove vessel time directly. None of them depends on battery chemistry improving at all. That is the point.
Market Impact: Endurance caps near just 24 hours p

Who Controls the Margin Pool

Concentration is moderate at 51% across the top five measured on vehicle and system revenue, and navigation capability rather than vehicle construction holds it there. A pressure hull rated to depth is within reach of many engineering firms, while an inertial and acoustic navigation solution holding position across a long dive is not, and the leading positions belong to organisations that were navigation businesses before they were vehicle builders. The leader to challenger gap
Competitive activity runs on three fronts. Navigation performance is the first and the one clients increasingly write into tenders directly. Defence programme access is the second, where national supply requirements and security clearances matter more than any technical comparison. And recovery and docking capability is the third, which removes vessel time without waiting for battery chemistry to improve.

Pressure arrives from two directions. Defence primes with no marine heritage have entered through undersea autonomy programmes and compete on systems integration. And Chinese domestic suppliers hold their own market entirely. Rankings shift on programme awards rather than on any commercial activity. Neither pressure reaches hover-capable inspection work, where station-keeping without a tether demands control performance very few builders achieve reliably. That tier is barely contested at all.
autonomous-underwater-vehicles-auv-market-company-positioning-matrix-1787302631667

Competitive Moat and Risk Dimensions

KONGSBERG MARITIME

Moat: Navigation heritage and vehicle integration

Inertial and acoustic navigation capability developed over decades before the vehicle business existed gives positional performance that competitors building hulls first cannot match quickly at any cost. Integration of navigation, sonar, and vehicle control inside one organisation removes interfaces that separately sourced systems carry. Both advantages compound with operating hours rather than with capital investment.
KONGSBERG MARITIME

Risk: Defence primes entering undersea autonomy

Large defence contractors with no marine heritage have entered through undersea autonomy programmes and compete on systems integration, security clearance, and national supply rather than on marine engineering. Extra-large vehicles grow at 17.1% and sit inside exactly that procurement environment. Navigation depth counts for less where the selection criteria are national and programmatic.
TELEDYNE MARINE

Moat: Sensor and vehicle portfolio breadth

Ownership of sonar, acoustic positioning, and vehicle brands lets a single supplier deliver a complete survey capability rather than a platform requiring third-party payloads and navigation aids. Commercial survey customers value that integration because it removes interface risk from a campaign where vessel time is the dominant cost. Breadth also spreads development across markets beyond autonomous vehicles alone.
TELEDYNE MARINE

Risk: Commercial survey cycle exposure

A commercially weighted position ties revenue to offshore survey activity that paused entirely through 2020 and depends on wind and oil development schedules that move together. Defence now carries around 47% of market value and grows faster. Building defence programme access requires clearances, national content positions, and relationships that commercial success does not produce.

Players Tracked

Prominent Players

Kongsberg Maritime
Teledyne Marine
Saab
Anduril
Ocean Infinity

Other Key Players

L3Harris Technologies
Boeing
General Dynamics Mission Systems
Thales
Exail
Atlas Elektronik
Fugro
Cellula Robotics
Terradepth
Sonardyne
EdgeTech
Hydromea
Oceaneering International
Tianjin Sublue
Seaber

Recent Developments

FEBRUARY 2025

Navy moves extra-large vehicle programme into procurement

A national navy advanced an extra-large autonomous undersea vehicle programme from demonstration into a procurement phase covering multiple hulls, for missions currently performed by crewed submarines at considerably higher cost. The decision was a defence procurement milestone rather than any technology demonstration or commercial arrangement.
Signal: A handful of programme decisions now move
MAY 2025

Wind developer specifies positional accuracy over sensor resolution

An offshore wind developer wrote positional accuracy requirements into a site characterisation tender ahead of any sonar specification, after geotechnical targets from a previous campaign proved difficult to relocate for drilling. The specification was a procurement change rather than any dispute with its previous survey contractor.
Signal: Clients have now started buying position r
SEPTEMBER 2025

Operator deploys subsea docking station for resident survey vehicle

An offshore operator installed a subsea docking and charging station allowing an autonomous vehicle to remain on site between missions rather than returning to a vessel for recovery and recharge. The installation was an operating cost decision rather than any technology trial or partnership arrangement.
Signal: Recovery engineering removes vessel time w

Navigation, Batteries and Integration

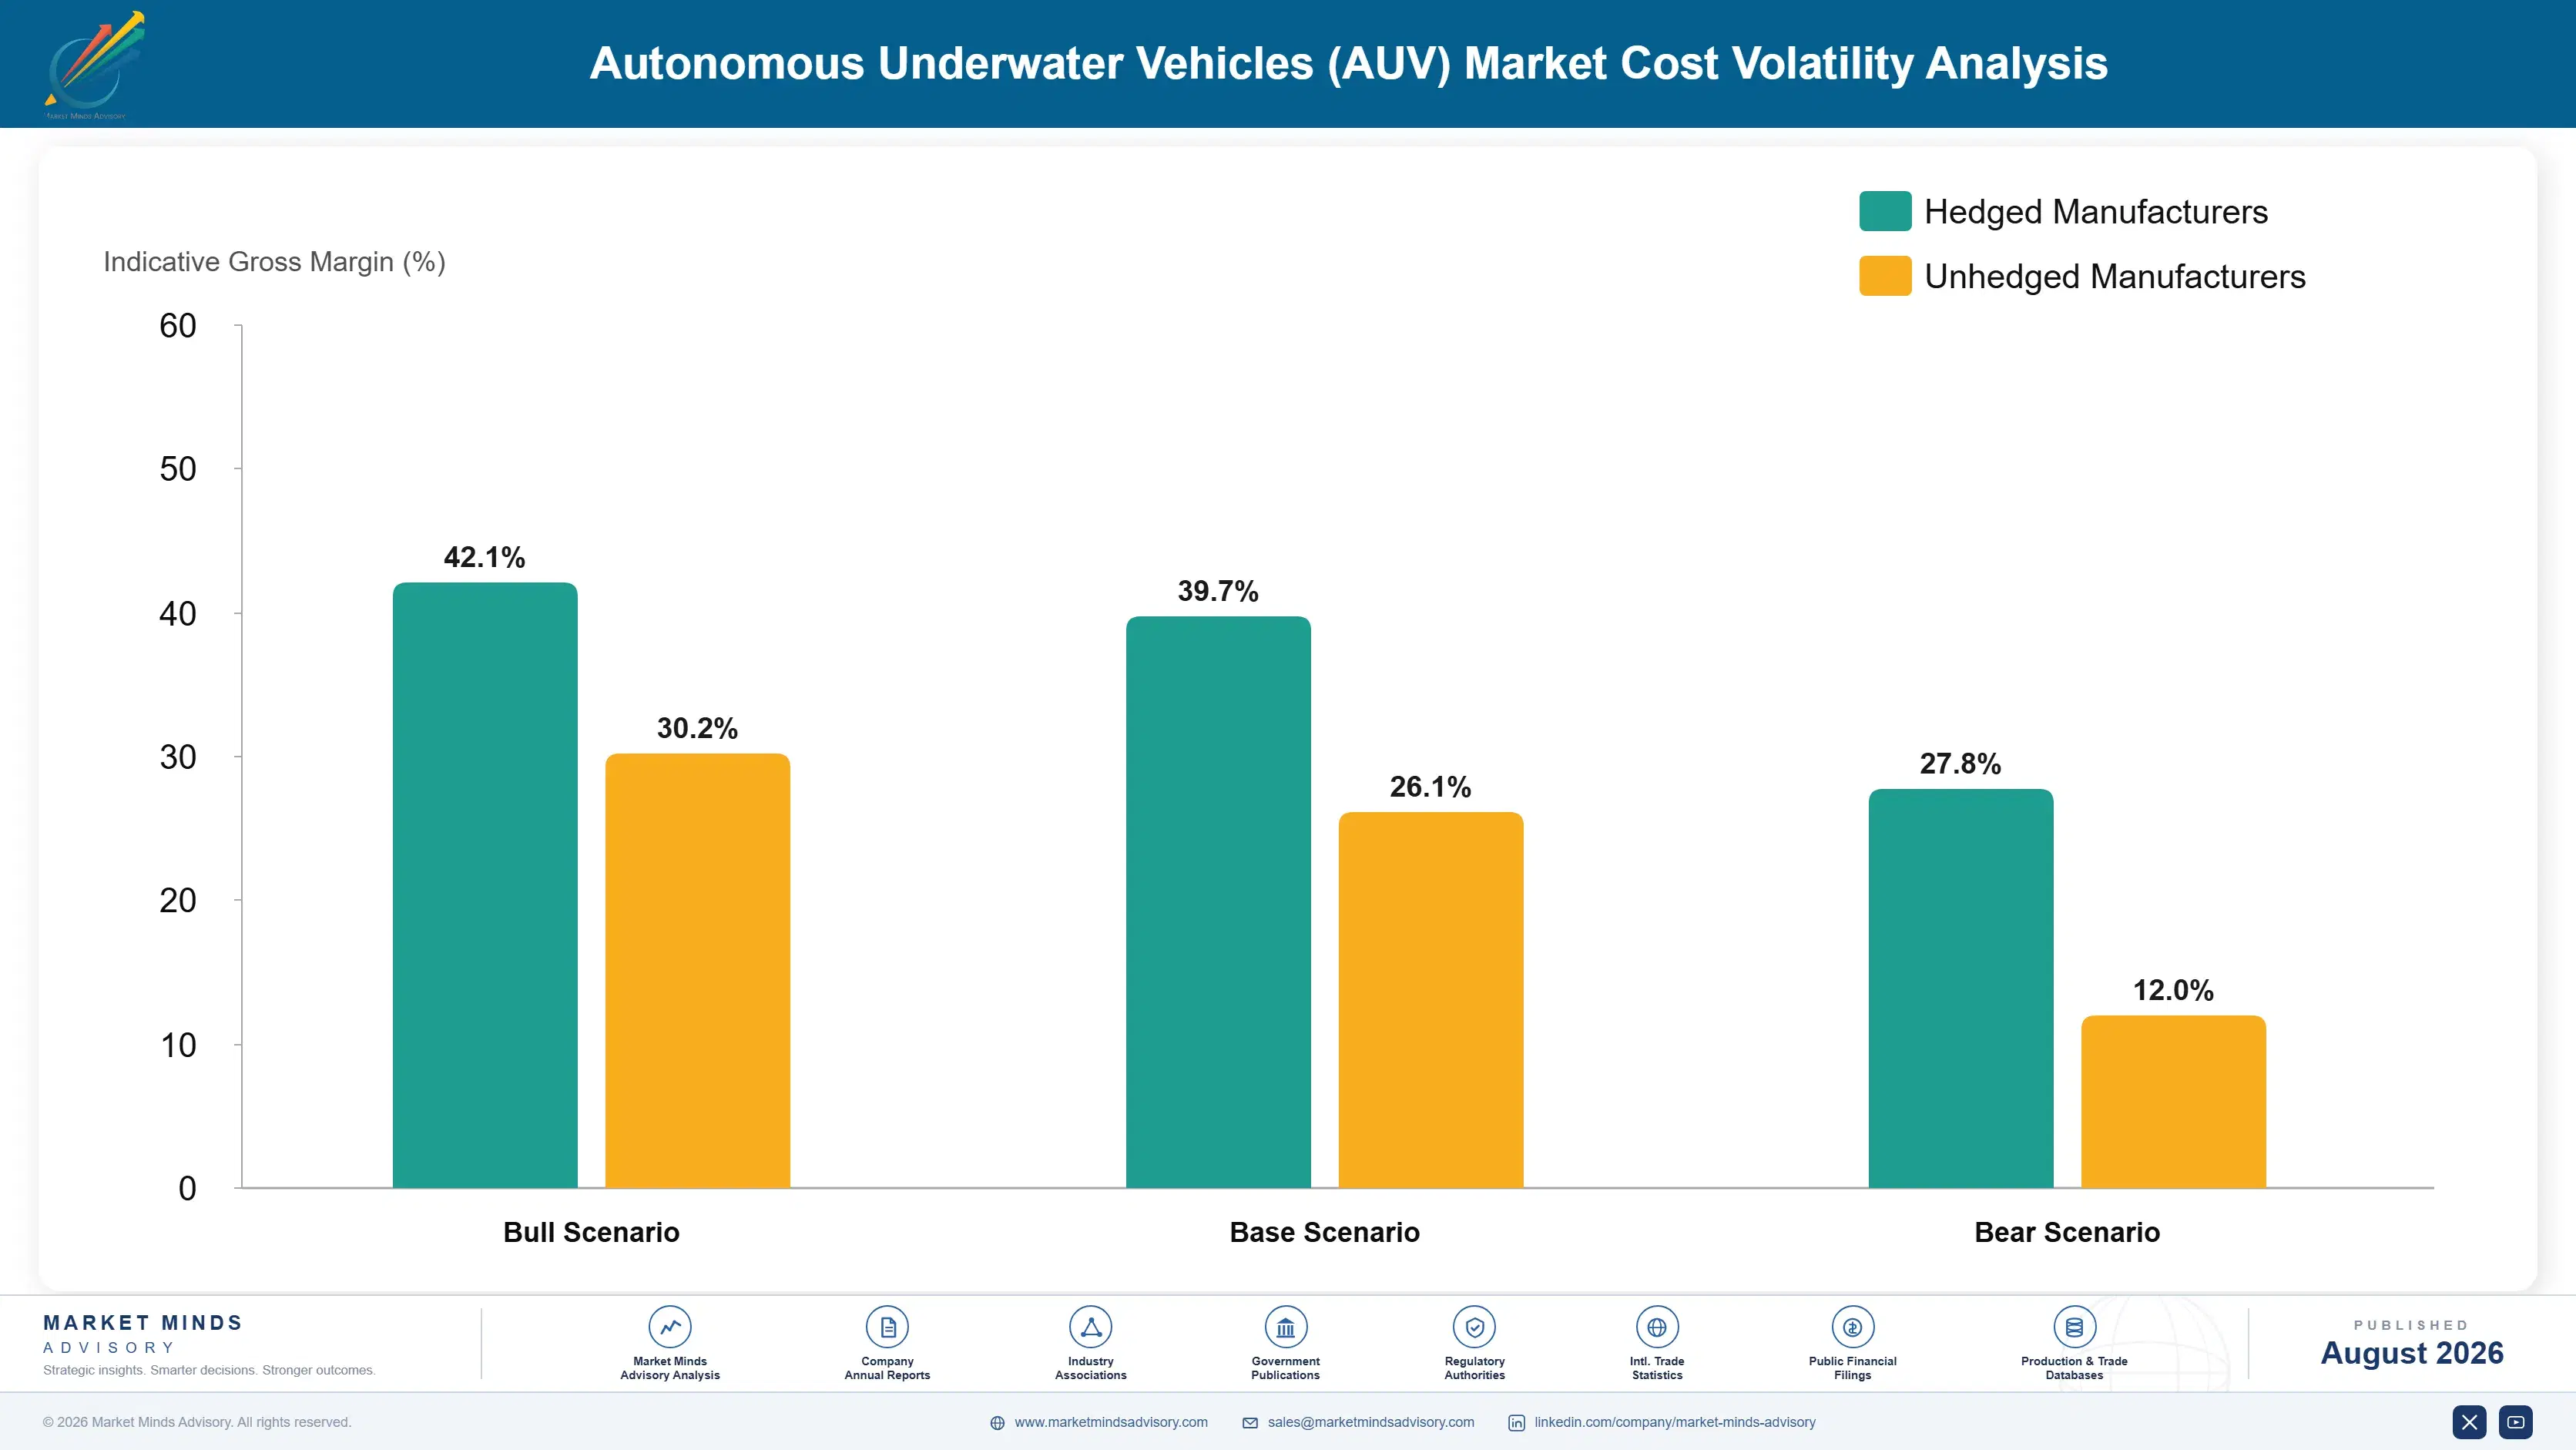
Vehicle cost divides between navigation and positioning systems at roughly 26%, sonar and payload sensors near 22%, battery and power systems around 15%, pressure housings, structure, and propulsion about 17%, and integration engineering, testing, and overhead the balance. Navigation and payload together exceed half the cost, which is the clearest possible statement that the hull is not what anybody is really buying here.
Battery cell and power electronics costs moved sharply through 2022 and 2023 as automotive and grid storage demand competed for the same components, and several marine technology suppliers disclosed procurement pressure and extended lead times in filings covering those years. Inertial navigation component costs moved separately and less severely. Neither could be recovered quickly on programmes priced at proposal stage years before delivery. Programmes are frequently priced years before delivery.

The competitive disadvantage mechanism runs through navigation sourcing rather than through hull fabrication. Structures and propulsion cost broadly the same for competent builders, while inertial navigation performance differs enormously between suppliers and the best units are export controlled in several jurisdictions. A vehicle builder without in-house navigation buys performance at a price its competitor sets, and cannot always buy the grade it wants at all.
autonomous-underwater-vehicles-auv-market-cost-volatility-analysis-1787302631862

Develop or secure in-house inertial navigation capability

Navigation and positioning carry roughly 26% of vehicle cost and determine what the survey data is actually worth, while the best inertial units are export controlled in several jurisdictions and sold by direct competitors. A builder without in-house capability buys its differentiating component from the company it is bidding against. That position is uncomfortable in commercial work and

Contract battery and power electronics ahead of programme award

Battery and power systems carry around 15% of vehicle cost and compete with automotive and grid storage demand for identical components on shared lead times. Contracted positions taken before award remove both price and schedule exposure on programmes that are frequently priced years before delivery. The commitment carries volume risk and it is smaller than a missed delivery

Standardise payload interfaces across the vehicle range

Sonar and payload sensors carry roughly 22% of cost and vary by mission, customer, and generation, which multiplies integration engineering unless interfaces are standardised deliberately. Common mechanical, power, and data interfaces let one vehicle serve several payload configurations without redesign. That also captures part of the shared engineering between defence and commercial product lines that otherwise diverge entirely.

Portfolio Architecture for Margin Defence

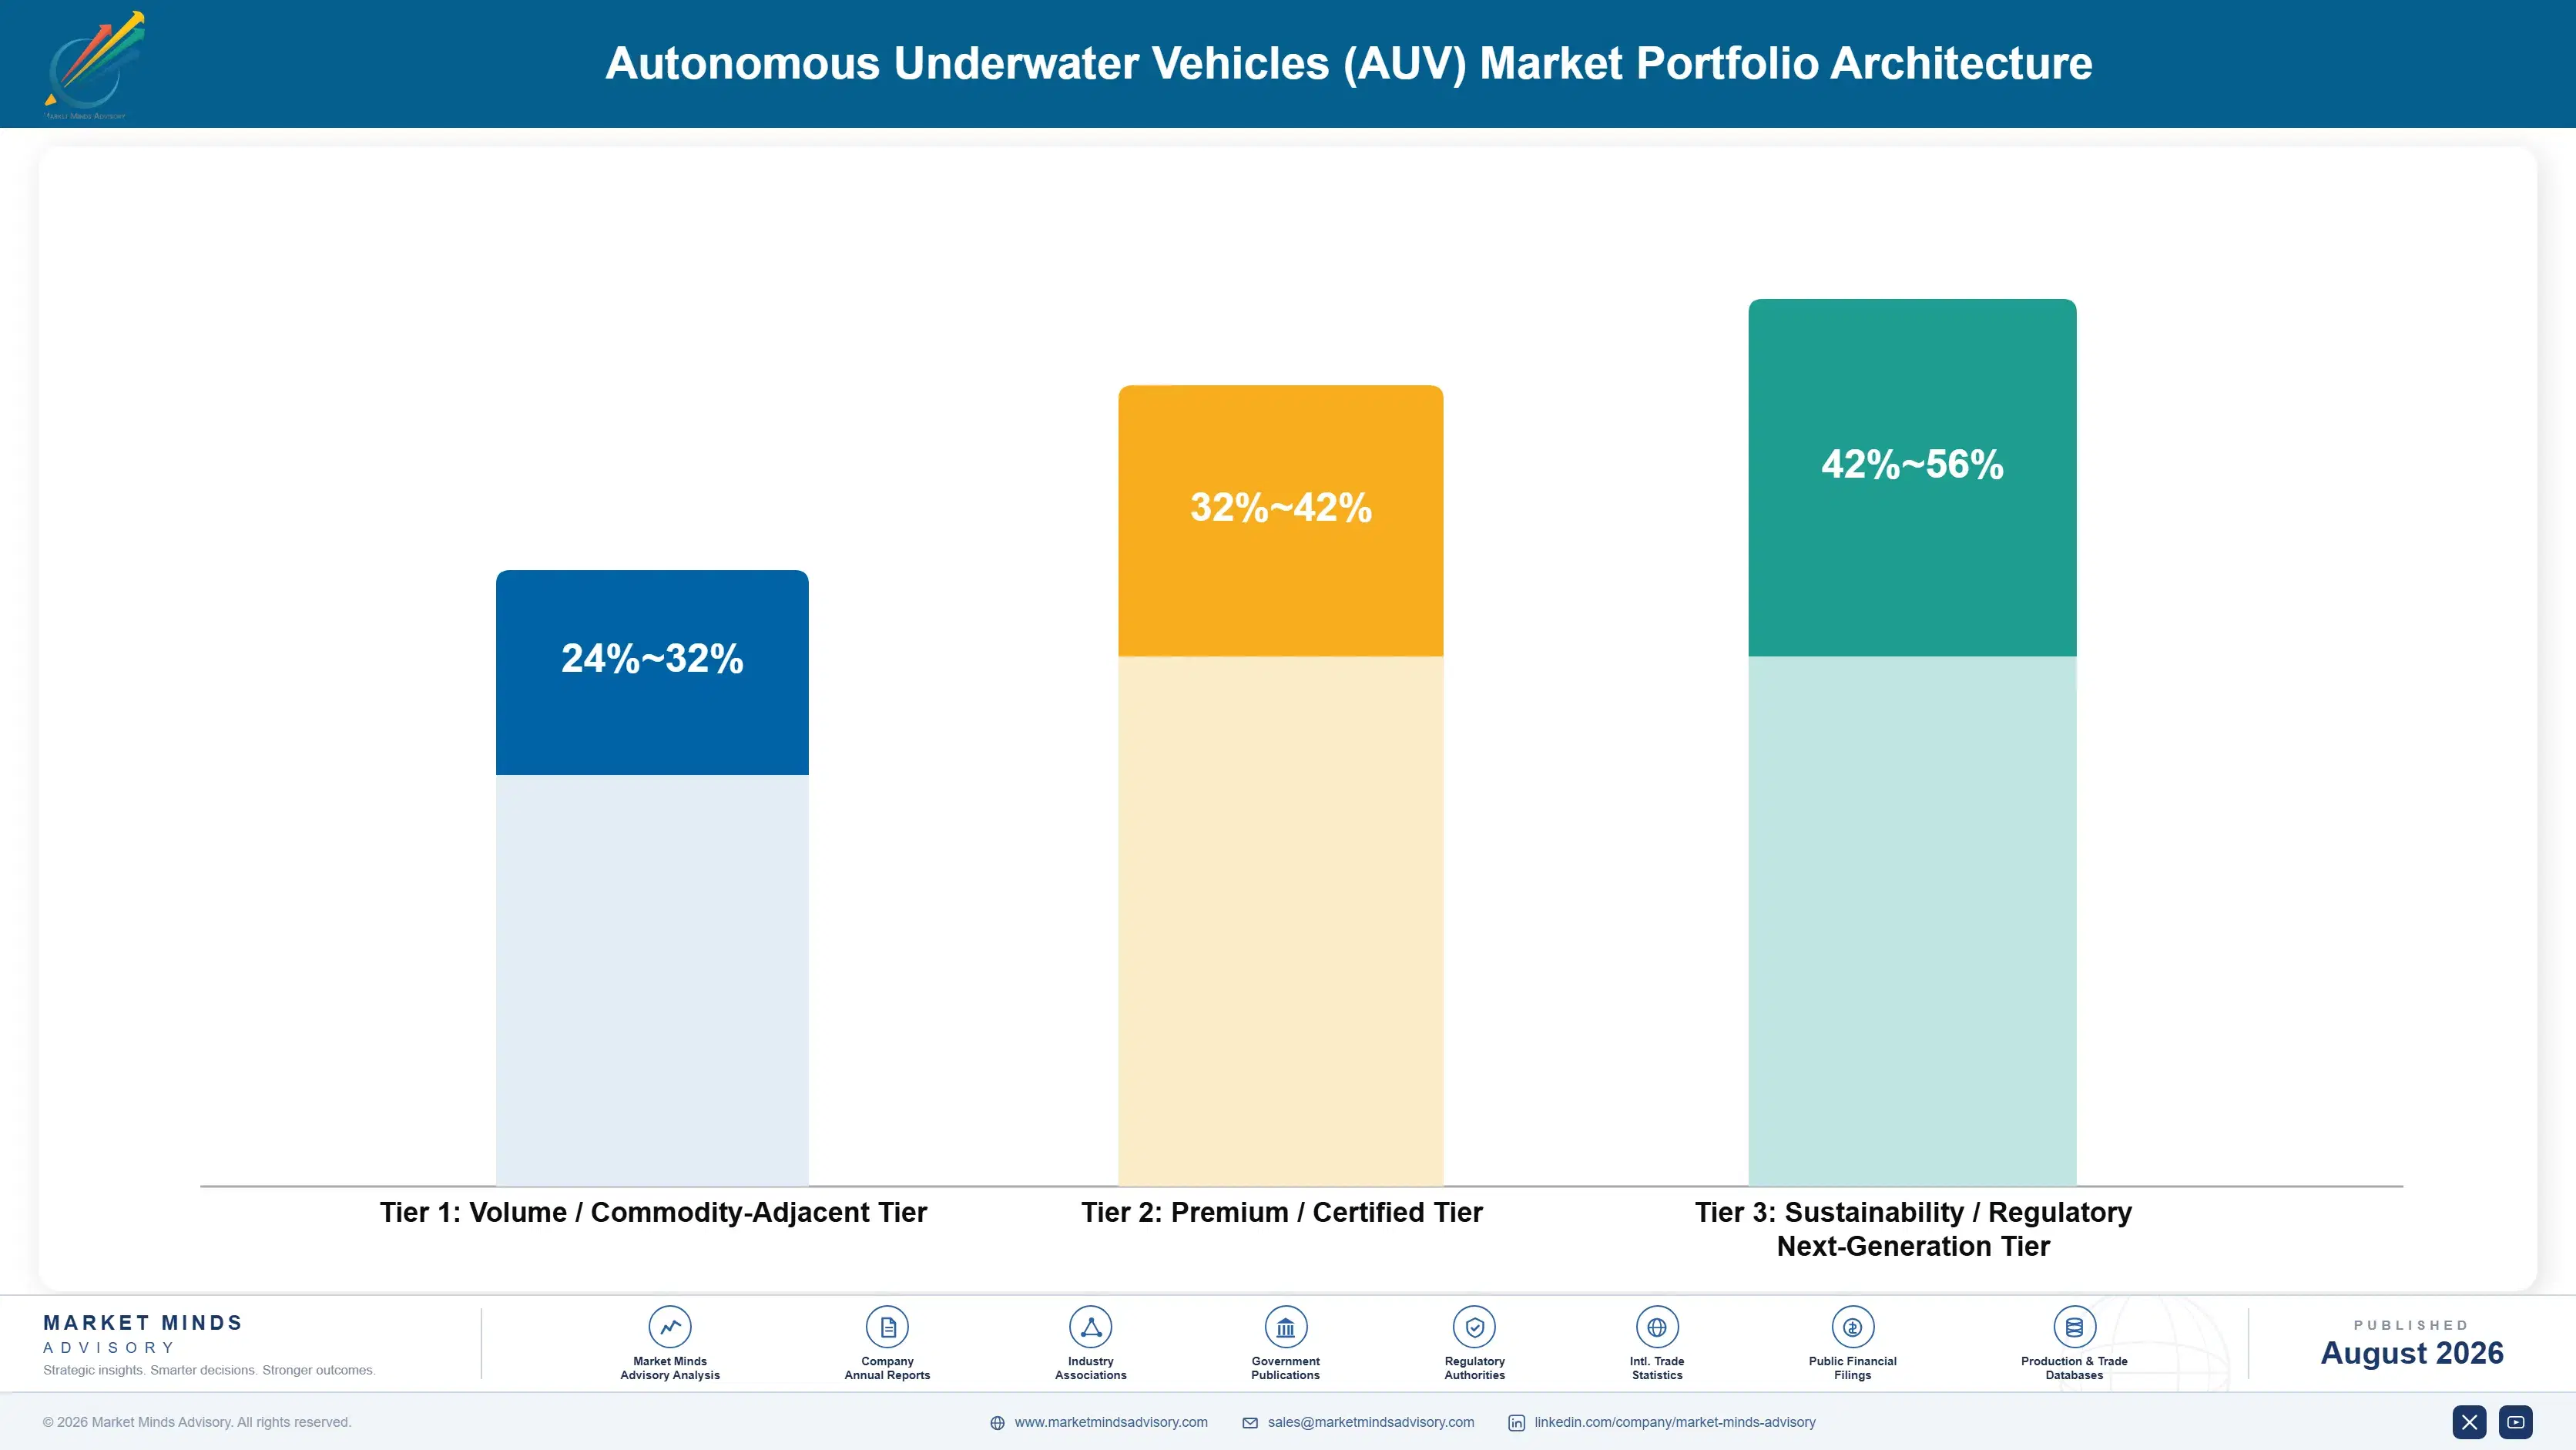
Three tiers describe this business and the spread follows navigation grade and customer type rather than vehicle size. Micro and portable vehicles sit at the bottom, where navigation requirements are modest, unit values are low, and many suppliers compete. Survey-class and glider vehicles occupy the middle. Hover-capable inspection and extra-large defence vehicles sit at the top, where navigation performance and programme access both restrict participation severely.
The tension is that defence now carries around 47% of value on programmes where a handful of decisions move the whole segment, while commercial survey provides steadier volume at far lower unit values. A supplier weighted to defence has enormous revenue concentration in very few customers. One weighted to commercial survey has a diversified book tied to offshore activity that stopped completely once already.

High-value pools concentrate where navigation performance is unforgiving. Hover-capable inspection is the clearest case, since holding station on a structure without a tether demands control and positioning that survey-class vehicles never require, and very few builders achieve it reliably. Extra-large defence platforms are the second such pool, where programme access rather than engineering restricts who competes. Neither pool is decided on vehicle price.

Volume / Commodity-Adjacent Tier

Micro and portable vehicles for shallow survey, harbour work, and research where navigation requirements are modest. Unit values are low and many suppliers compete openly on price and payload. Research and harbour buyers dominate.
Gross Margin: 24-32%

Premium / Certified Tier

Survey-class torpedo vehicles and gliders where navigation accuracy and area per deployment decide awards. Commercial survey customers buy vessel days removed rather than any vehicle specification. Area per deployment decides most awards outright.
Gross Margin: 32-42%

Sustainability / Regulatory / Next-Generation Tier

Hover-capable inspection vehicles and extra-large defence platforms where navigation performance and programme access both restrict participation. Best margin available and the fewest credible competitors anywhere. Programme access matters more than engineering does.
Gross Margin: 42-56%
autonomous-underwater-vehicles-auv-market-portfolio-architecture-1787302632356

Programmes, Campaigns and Fleets

Demand arrives through two channels behaving nothing alike. Defence procurement moves in programme decisions taken by very few customers on multi-year timelines, where a single award can exceed a year of commercial revenue. Commercial survey arrives as campaign purchases and fleet additions by survey contractors and operators, at far lower unit values and considerably higher frequency, tied to offshore development schedules. Those two channels rarely inform each other in any useful way.
Stickiness runs through navigation and payload integration rather than through any relationship. A survey contractor that has built processing workflows, calibration procedures, and crew competence around one vehicle family does not change lightly, since the transition costs data continuity as well as training. Defence programmes stick hardest of all through certification and national supply arrangements. Micro vehicle purchases stick least and are genuinely price competitive.

Buyer profiles diverged as defence grew. The earlier buyer was a survey contractor's operations manager comparing vehicles on endurance, depth rating, and sensor fit. The current conversation is as likely to involve a defence programme office assessing national supply and clearance, or a wind developer writing positional accuracy requirements after failing to relocate its own geotechnical targets.
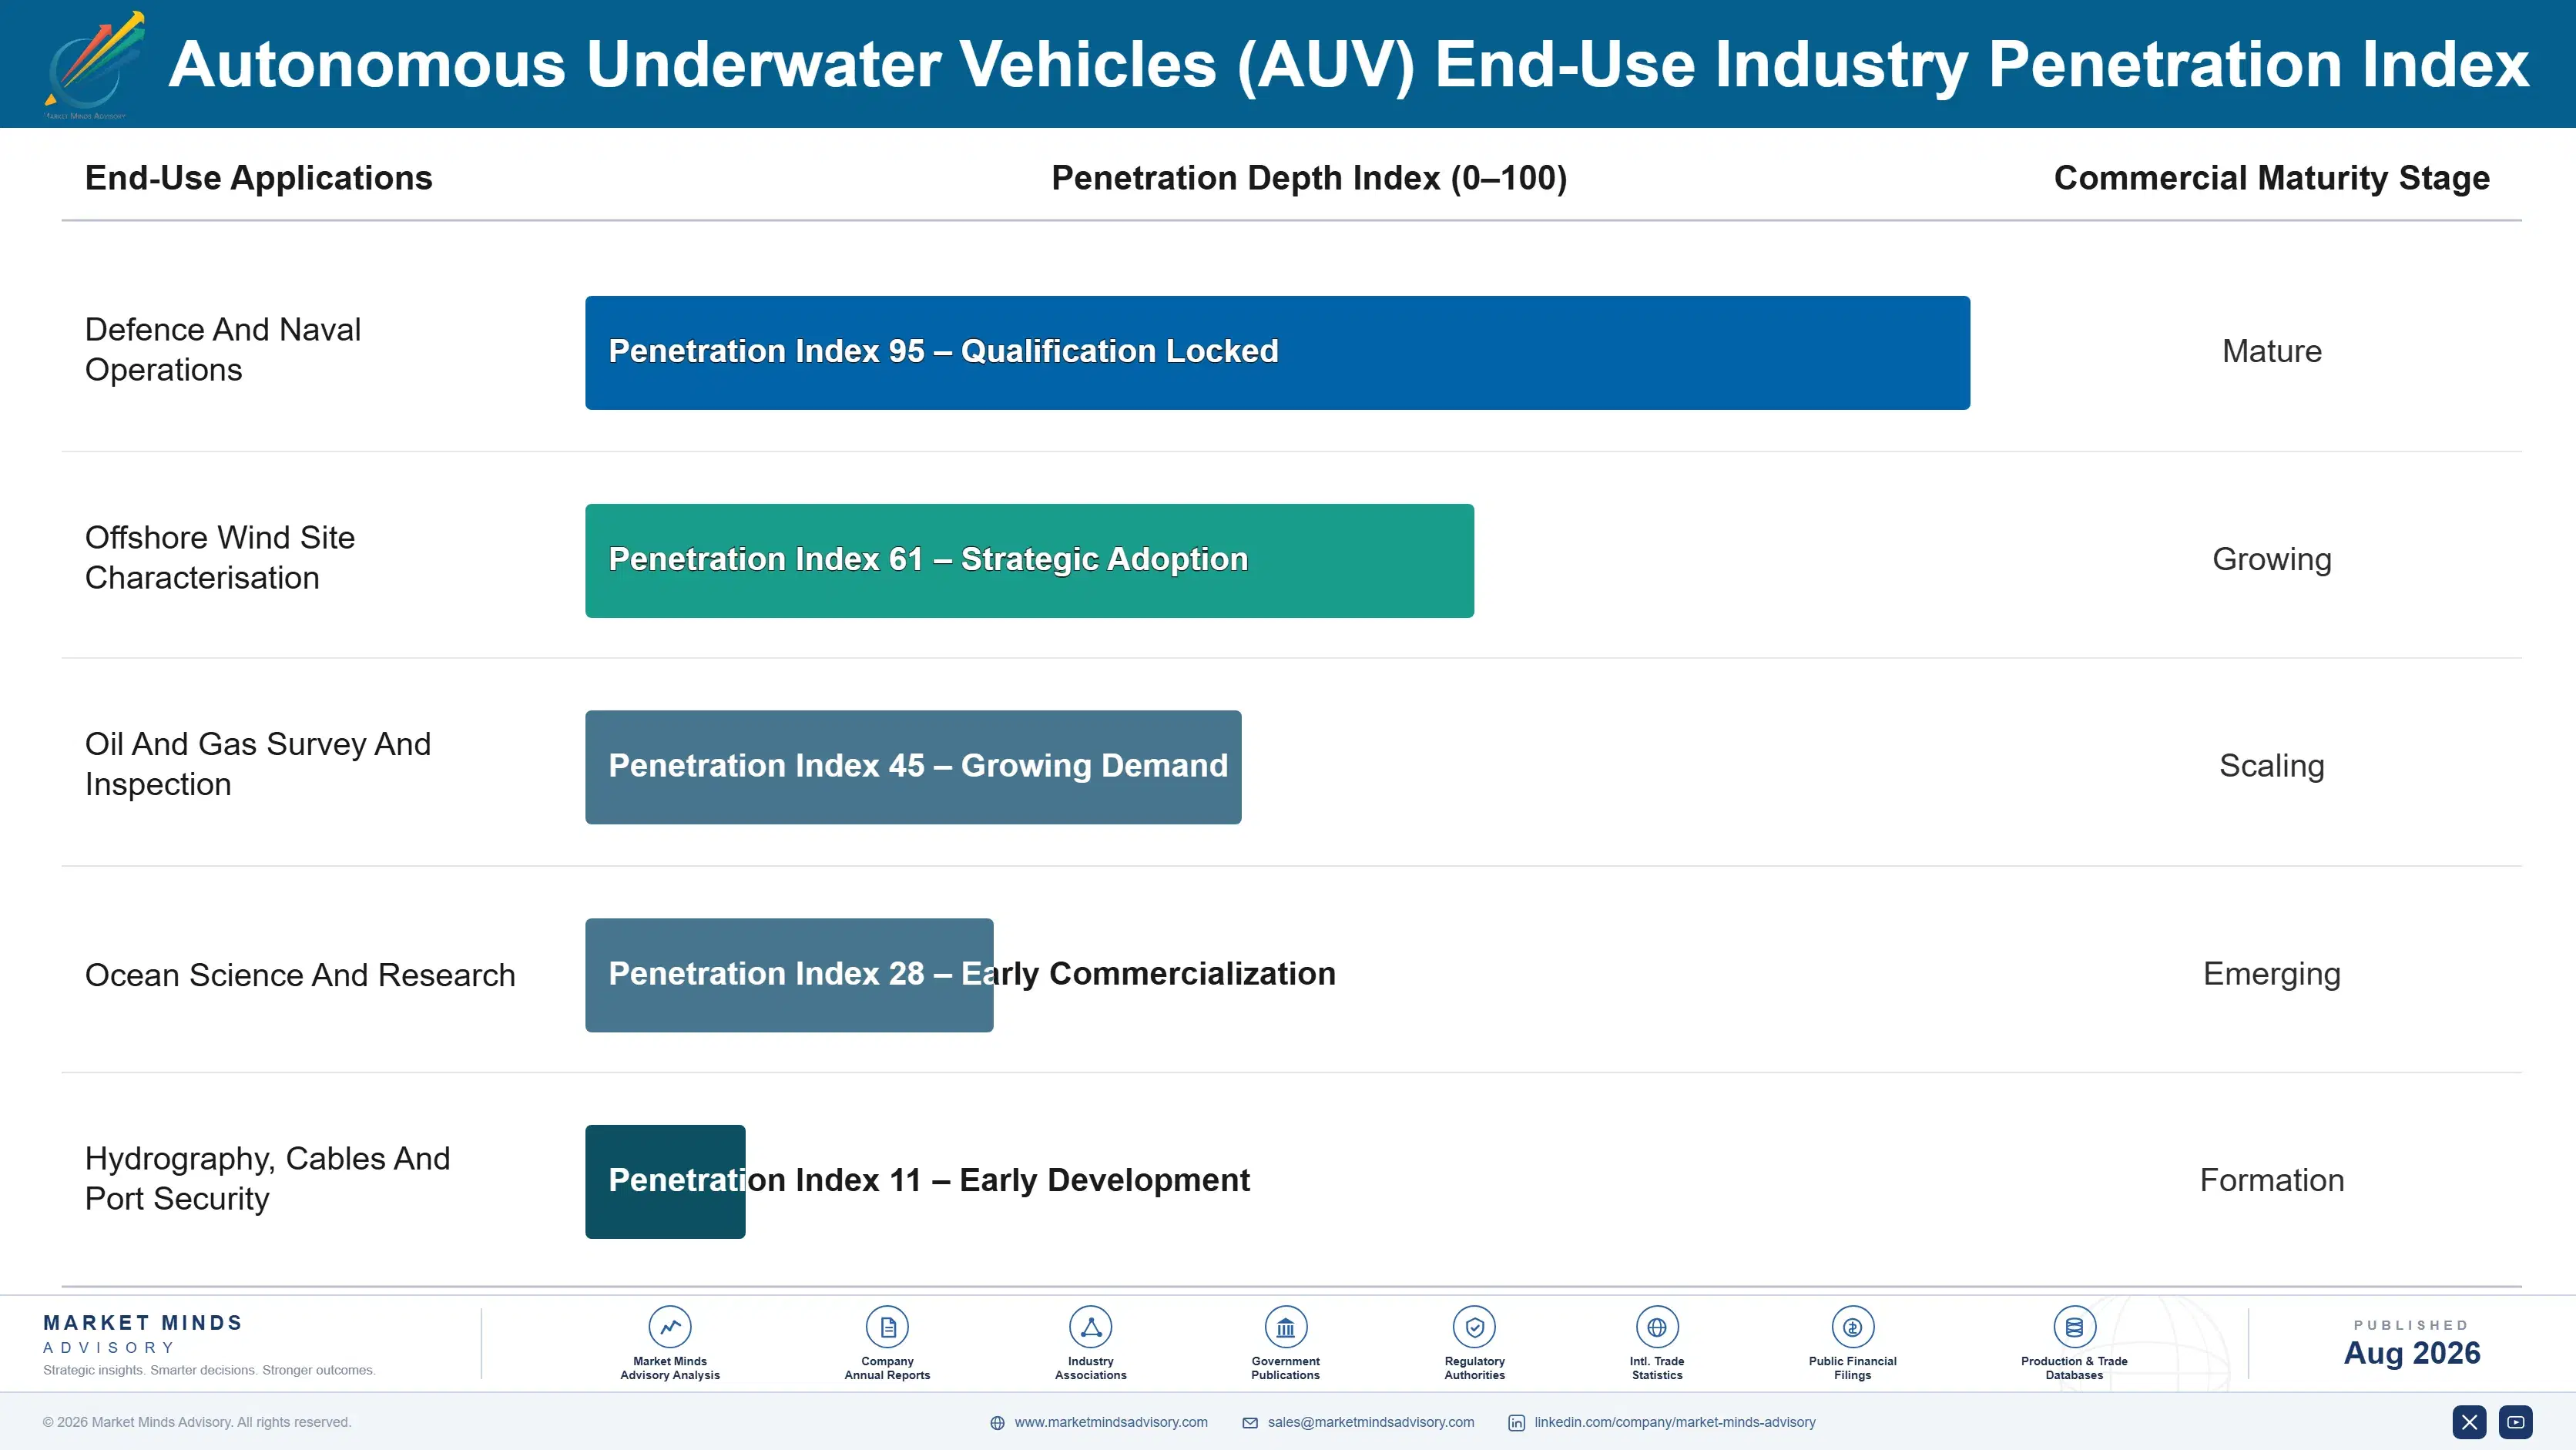
autonomous-underwater-vehicles-auv-market-end-use-penetration-index-1787302632845

What We Would Tell a Board

These are among the four positions where our research anticipates prominent divergence between winners and laggards over the coming forecast period. Each is grounded in the demand model, the regulatory perimeter, and the announced capacity pipeline.
01 / NAVIGATION CAPABILITY PRIORITY

Position accuracy is the product, not the vehicle

Position error accumulating at roughly 0.05% of the distance travelled decides whether a mapped seabed feature can ever be relocated at all, and a geotechnical target the engineer cannot find again is worth nothing whatever the sonar resolved beautifully. Clients have now begun writing positional accuracy into their tender documents ahead of any sensor specification at all. Suppliers whose navigation heritage predates their vehicle business hold an advantage that entrants competing on hull design and autonomy alone cannot close quickly at all.
02 / VESSEL DAY TRANSLATION

Quote the output, never quote the inputs

A commercial survey campaign spends around 61% of its total cost on the support vessel, so the client is calculating area covered per vessel day while most suppliers are describing endurance, depth rating, and payload capacity instead. Covering roughly 180 square kilometres per deployment converts directly into vessel days removed from a campaign the client is already costing. Proposals that state that output rather than the inputs behind it consistently win against technically comparable competitors who never made the translation.
03 / CUSTOMER SEPARATION DISCIPLINE

One platform cannot serve both these customers

Defence buys endurance, covertness, payload volume, and national supply chains while commercial survey buys area per vessel day and open data interfaces, and defence now carries around 47% of the total market value between them. A single platform stretched across both of those requirement sets serves each of them badly and satisfies neither procurement process properly at all. Modular payload architecture captures whatever engineering is genuinely shared between them, and pretending otherwise has already cost several suppliers real positions in both markets.
04 / RECOVERY ENGINEERING FOCUS

Solve recovery instead of waiting for batteries

Survey-class vehicles run around 24 hours between recoveries, and battery energy density has improved far more slowly than autonomy, navigation, or sensing have across exactly the same period. Subsea docking stations, autonomous over-the-side recovery, and unattended charging between missions all remove paid vessel time without requiring any chemistry breakthrough whatsoever anywhere. That is a genuinely tractable engineering problem, and considerably fewer suppliers anywhere are actually working on it than are simply waiting on the battery itself to improve for them.

Engagement Snapshot From the Field

A live engagement with an industry participant carrying material or product regulatory and market exposure ahead of a defining policy shift, showing how our research translates into a defensible multi-year portfolio strategy.
MARKET MINDS ADVISORY · CLIENT ENGAGEMENT SUMMARY
Autonomous Underwater Vehicles (AUV) Producer Strategic Portfolio Review and Transition Roadmap 2026·Investment Scenario on Autonomous Underwater Vehicles (AUV) Exposure Evaluation 2025-26
CLIENT PROFILE
An autonomous underwater vehicle manufacturer with approximately 95 million dollars in annual revenue (client-reported, unverified by MMA), building survey-class vehicles for commercial contractors and pursuing defence programmes with a stretched version of the same platform. Navigation systems were purchased from a competitor, and defence bids had been unsuccessful for three consecutive years. Commercial performance had been solid throughout.
STRATEGIC CHALLENGE
The board wanted to understand whether the defence pursuit was worth continuing, why bids kept failing when the vehicle performed well commercially, and whether the purchased navigation dependency mattered as much as engineering believed it did. Nobody had reviewed defence bid feedback against the published selection criteria rather than the technical scoring.
MMA APPROACH
We reviewed defence bid feedback against published selection criteria rather than technical scoring alone. Navigation sourcing was assessed for export control and competitive exposure. Commercial win and loss records were analysed for how proposals had presented value, and modular architecture options were scoped against both requirement sets. Competitor navigation positions were then mapped by programme.
KEY FINDINGS
  1. Defence losses traced consistently to national supply, clearance, and programme management criteria rather than to any technical shortfall in the vehicle itself.
  2. The purchased navigation system was supplied by a company bidding against the client on the same programmes, and higher grade units were not available to it at all.
  3. Commercial proposals had described endurance and sensor fit while winning competitors had quoted survey area per vessel day, which the client had never calculated.
  4. A stretched survey platform satisfied neither customer, and modular payload architecture would have captured most of the shared engineering without the compromise.
CLIENT PROFILE
An autonomous underwater vehicle manufacturer with approximately 95 million dollars in annual revenue (client-reported, unverified by MMA), building survey-class vehicles for commercial contractors and pursuing defence programmes with a stretched version of the same platform. Navigation systems were purchased from a competitor, and defence bids had been unsuccessful for three consecutive years. Commercial performance had been solid throughout.
STRATEGIC CHALLENGE
The board wanted to understand whether the defence pursuit was worth continuing, why bids kept failing when the vehicle performed well commercially, and whether the purchased navigation dependency mattered as much as engineering believed it did. Nobody had reviewed defence bid feedback against the published selection criteria rather than the technical scoring.
MMA APPROACH
We reviewed defence bid feedback against published selection criteria rather than technical scoring alone. Navigation sourcing was assessed for export control and competitive exposure. Commercial win and loss records were analysed for how proposals had presented value, and modular architecture options were scoped against both requirement sets. Competitor navigation positions were then mapped by programme.
KEY FINDINGS
  1. Defence losses traced consistently to national supply, clearance, and programme management criteria rather than to any technical shortfall in the vehicle itself.
  2. The purchased navigation system was supplied by a company bidding against the client on the same programmes, and higher grade units were not available to it at all.
  3. Commercial proposals had described endurance and sensor fit while winning competitors had quoted survey area per vessel day, which the client had never calculated.
  4. A stretched survey platform satisfied neither customer, and modular payload architecture would have captured most of the shared engineering without the compromise.
RECOMMENDED STRATEGY
Phase 1: Phase 1 (months one to nine): rebuild commercial proposals around area covered per vessel day rather than around vehicle specifications. Phase 2: Phase 2 (months nine to thirty): develop or acquire in-house navigation capability, treating the current dependency as a competitive exposure. Phase 3: Phase 3 (months thirty to fifty-four): separate defence and commercial product lines with a shared modular payload architecture. Stop stretching one platform across both.
OUTCOME
Commercial proposals were rewritten within one quarter and win rates improved measurably against the same competitors. A navigation development programme was funded, and the stretched defence variant was withdrawn in favour of a separate architecture (client-reported, unverified by MMA). Navigation dependency was formally logged as a competitive exposure.

Frequently Asked Questions

Foundational context covering the market sizes, CAGR, scope, country, region and competition that inform every finding below. This section is provided to cover basics and most often pre-purchase conversations, answered from the MMA Primary Research Dataset.

What is the current size of the Autonomous Underwater Vehicles (AUV) Market?

The market is valued at USD 2.4 billion in 2025, rising to USD 2.67 billion in 2026. Scope covers untethered autonomous vehicles and their systems, not tethered remotely operated vehicles, surface vessels, or survey data services.

How large will the Autonomous Underwater Vehicles (AUV) Market be by 2036?

MMA forecasts USD 7.86 billion by 2036, an increase of USD 5.19 billion over the 2026 base. That represents an expansion multiple of 2.94 times across the forecast period.

What is the CAGR for the Autonomous Underwater Vehicles (AUV) Market 2026 to 2036?

The base case CAGR is 11.4%, with a bull case of 12.7% and a bear case of 10.1%. The historical rate from 2020 to 2025 was 9.9%, interrupted by the offshore survey pause.

Which segment is growing fastest?

Extra-large autonomous undersea vehicles at 17.1%, exactly 1.50 times the market rate. Defence programmes drive essentially all of it, for missions crewed submarines currently perform at far higher cost.

Who are the major companies in the Autonomous Underwater Vehicles (AUV) Market?

Kongsberg Maritime, Teledyne Marine, Saab, Anduril, and Ocean Infinity lead on vehicle and system revenue. The top five hold 51%, held there by navigation capability rather than vehicle construction.

Which country is growing fastest?

Australia at 15.2%, where undersea autonomy programmes under multinational defence arrangements have moved from research into procurement. Ocean science and offshore survey activity add further demand.

Report Segmentation Architecture

The full report scope spans multiple orthogonal segmentation dimensions, with cross-tabulated demand data provided for each dimension pair. Coverage extends further to regional breakdowns, trend trajectories, and the competitive detail needed to support segment-level decision-making.

By Vehicle Class And Mission Profile

  • Micro And Portable AUVs
  • Survey-Class Torpedo AUVs
  • Hover-Capable Inspection AUVs
  • Gliders And Long-Endurance Vehicles
  • Extra-Large Autonomous Undersea Vehicles

By End-Use Industry

  • Defence And Naval Operations
  • Offshore Wind Site Characterisation
  • Oil And Gas Survey And Inspection
  • Ocean Science And Research
  • Hydrography, Cables And Port Security

By Commercial Model

  • Vehicle Sales To Operators And Contractors
  • Defence Programme Procurement Contracts
  • Survey Services Delivered With Owned Fleets
  • Vehicle Leasing And Campaign Rental
  • Payload Integration And Upgrade Programmes

By Region

  • North America
  • Western Europe
  • South Asia and Pacific
  • East Asia
  • Latin America
  • Middle East and Africa
  • Eastern Europe

Scope, Methodology, and Coverage

Every figure in this report is reproducible from documented input assumptions. The scope below maps the historical period, the forecast horizon, the segmentation dimensions, and the countries covered, alongside the underlying primary and qualitative methodology.
Historical Period
2020 to 2025
Forecast Period
2026 to 2036
Base Year
2025 (USD billions; MMA Primary Research Dataset, August 2026)
Market Definition
This market comprises untethered autonomous underwater vehicles and the navigation, payload, launch, and recovery systems supplied with them, measured at manufacturer and operator revenue across vehicle sale, defence programme, survey service, leasing, and payload integration channels. Coverage spans micro and portable AUVs, survey-class torpedo AUVs, hover-capable inspection AUVs, gliders and long-endurance vehicles, and extra-large autonomous undersea vehicles including their docking and charging infrastructure. Tethered remotely operated vehicles and their support systems, autonomous and uncrewed surface vessels, towed survey bodies and sidescan systems, sonar, acoustic positioning and inertial sensors sold independently of a vehicle, support and survey vessels and their chartering, diving services, and survey data processing and interpretation sold as standalone services fall outside scope.
Quantitative Units
USD billions (current prices); vehicles delivered by class; price per vehicle by class; survey area covered per deployment
Segmentation Dimensions
By Vehicle Class And Mission Profile; By End-Use Industry; By Commercial Model; By Region
Regions Covered
North America, Western Europe, South Asia and Pacific, East Asia, Latin America, Middle East and Africa, Eastern Europe
Countries Covered
United States, Canada, Mexico, United Kingdom, Norway, France, Germany, Netherlands, Denmark, Italy, Australia, India, Singapore, Japan, South Korea, China, Taiwan, Brazil, Guyana, Chile, Saudi Arabia, United Arab Emirates, Nigeria, South Africa, Poland, Sweden, Finland, and additional markets relevant to this sector
Key Companies Profiled
Kongsberg Maritime, Teledyne Marine, Saab, Anduril, Ocean Infinity, L3Harris Technologies, Boeing, General Dynamics Mission Systems, Thales, Exail, Atlas Elektronik, Fugro, Cellula Robotics, Terradepth, Sonardyne, EdgeTech, Hydromea, Oceaneering International, Tianjin Sublue, Seaber
Quantitative Methodology
Primary survey, n=3,800 respondents, Q4 2025, six countries; demand-side model with trade association cross-validation
Qualitative Methodology
47 expert interviews, Q4 2025; applied to validate demand model assumptions, identify emerging dynamics, and assess competitive positioning
Report Format
PDF and XLSX data workbook (Word format preview document)
Publisher
Market Minds Advisory
Report Code
MMA-2026-ENE-924
Published
August 2026
Contact
sales@marketmindsadvisory.com | www.marketmindsadvisory.com

Purchase the full Autonomous Underwater Vehicles (AUV) Market Report (2026 to 2036).

The full report sizes autonomous underwater vehicles across five vehicle classes, five end-use industries, five commercial models, and seven regions, with defence and commercial demand assessed separately throughout because the two buy on incompatible criteria. Navigation performance is evaluated as the primary competitive dimension rather than autonomy or hull design. Vessel day economics are modelled against survey area per deployment. Competitive profiling covers twenty participants on vehicle and system revenue, and navigation sourcing exposure is assessed builder by builder. Regional demand is built from naval procurement and survey activity rather than industrial output.
Defence and commercial demand assessed separately on incompatible buying criteria
Navigation performance evaluated as the primary competitive dimension throughout
Vessel day economics modelled against survey area per deployment
Navigation component sourcing exposure assessed builder by builder
Extra-large vehicle programme decisions tracked by navy and phase
Recovery and docking capability assessed separately from battery endurance

Built For The People Who Decide

From boardroom strategy to bench-side execution, this report is read cover-to-cover by leaders shaping the next decade of their industry, turning demand scenarios, market dynamics and valuation benchmarks into decisions.
CXOs/ Presidents/ VPs/ Managers
M&A and Corporate Development
Strategy Teams and R&D Heads
Procurement and Product Directors
Regulatory and Compliance Leaders
Investor Relations and Equity Analysts