Market Minds Advisory
Ammunition Market 2025-2035

Ammunition Market 2025-2035: Ammunition Market: The Constraint Was Never The Loading Line

Western energetic material plants run at roughly 96% utilisation and take about 42 months to replicate, which is why output could not scale at the moment governments suddenly asked it to.

Lead Analyst

Published

August 2026

Make Smarter Decisions with Customized Research Insights

Request a free sample report and evaluate market opportunities, growth trends, and competitive dynamics relevant to your business needs.

2025 MARKET VALUE$28.0BMarket Size 2025
2036 FORECAST VALUE$65.2BBase Case , 2026 to 2036
CAGR 2026 TO 20368.0 %Bull 9.2% / Bear 6.8%
INCREMENTAL OPPORTUNITY$35.0BNet 10- year value creation
EXPANSION MULTIPLE2.16x2036 value over 2026 base
Strategic Levers
M&A Pipeline
Regional Outlook
Country Rankings
Competitive Intelligence
Segmental Deep-dive
Call-Us : 91 93563 13602

Executive Snapshot and Market Trajectory.

Everybody assumed the bottleneck was assembly. It was energetic materials. Loading lines can be added in months while a propellant plant takes roughly 42 months to commission, and Western capacity had been cut to a level that annual procurement made entirely rational.
North America takes 36% of value, above the usual regional band, on defence procurement scale combined with by far the largest commercial and sporting market anywhere. Large calibre and artillery ammunition grows at 12.0%, half again the market rate of 8.0%, and European output has risen roughly fourfold since expansion began. Commercial ammunition sits at 24% of the category and grows at less than half the overall rate. Assembly capacity explains none of that.
Concentration reaches 41%. The change that actually mattered was contractual rather than industrial: roughly 47% of procurement is now committed beyond a single budget year, which is what finally made capacity investment a sensible decision rather than an obviously foolish one. Whether those commitments survive the moment urgency fades is the single most important commercial question anybody in this whole industry is currently facing at all right now today.
Market Definition
The market covers manufactured ammunition and its energetic materials, spanning small calibre ammunition, medium calibre ammunition, large calibre and artillery ammunition, mortar and rocket ammunition, commercial and sporting ammunition, and propellants primers and energetic materials supplied as inputs. Guided missiles and precision strike weapons, launch platforms and weapon systems, ordnance disposal and demilitarisation services, non-lethal munitions, and pyrotechnics for civilian display use are excluded from scope.
Base Year Value
$28.0B in 2025 (MMA Primary Research Dataset, August 2026)
Forecast Period
2026 to 2036, eleven discrete annual values
CAGR
8.0% base case. Bull 9.2%. Bear 6.8%.
Fastest Growth Segment
Large Calibre and Artillery Ammunition: 12.0% CAGR
Fastest Growth Country
India: 10.0% CAGR
Fastest Growth Region
South Asia and Pacific: 10.2% CAGR
Largest Region
North America: 36% of 2025 global value
Market Leaders
Olin Winchester, Rheinmetall, Northrop Grumman, Nammo, The Kinetic Group. Source: MMA Analysis based on disclosed ammunition and energetic materials revenue, company annual reports 2025.
Primary Survey
n=3,800 procurement and R&D decision-makers, Q4 2025, six countries
Methodology
Demand-side build-up, cross-validated against public data, 47 expert interviews

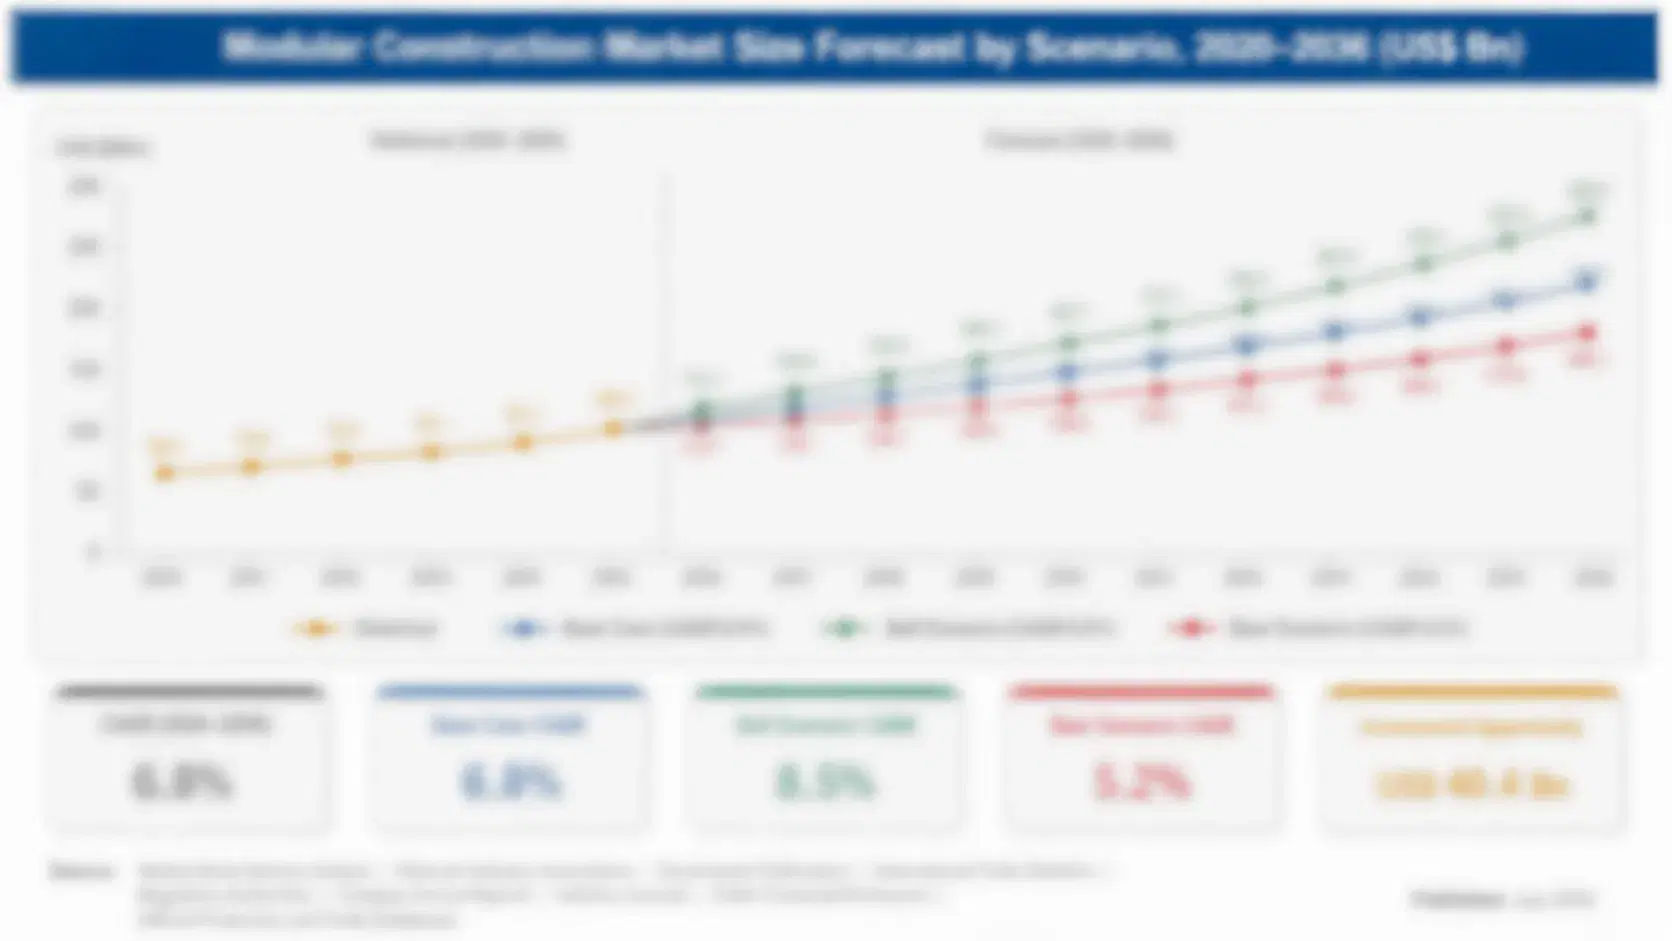
Ammunition Market Forecast Scenarios

ammunition-market-trends-size-forecast-scenario-1787719715250
Growth from 2020 to 2025 ran at 6.8% and the shape of it was extraordinary. Commercial and sporting demand spiked, glutted and fell back within three years, while defence procurement rose from a base that thirty years of peacetime budgeting had steadily eroded. Governments discovered that ordering more ammunition and receiving more ammunition are quite different things when the plants required to make the propellant no longer exist.
The 8.0% base case rests on three mechanisms. Artillery and large calibre output keeps rising as commissioned capacity comes online across Europe and North America. Multi-year contracting keeps spreading, which underwrites further investment that annual budgeting never could. And Asian domestic production keeps expanding as governments conclude that importing ammunition is a supply risk rather than a procurement choice. None of the three can be accelerated simply by ordering harder.
The bull case at 9.2% assumes stockpile replenishment targets are held to rather than quietly relaxed once immediate pressure eases, which history suggests is a genuinely open question. The bear case at 6.8% is procurement reverting to annual budgeting as urgency fades, since a plant commissioned against a multi-year commitment becomes a liability the moment it is not renewed.

Propellant, Not Assembly

The past four years taught that this industry has two halves and only one scales quickly. Loading and assembly capacity can be added within months, because the equipment is available and the buildings are ordinary. Energetic material production cannot, because those plants need permits, specialist construction and roughly 42 months from decision to output. Western plants run near 96% utilisation, which means no slack at all.
FIVE-FIRM CONCENTRATION41%Share of category revenue held by the largest ammunition producers
PROPELLANT CAPACITY UTILISATION96%Western energetic material plants running at effective ceiling
ARTILLERY OUTPUT MULTIPLE4 timesIncrease in European shell output since the expansion began
MULTI-YEAR CONTRACT SHARE47%Procurement now committed beyond a single budget year
PLANT BUILD LEAD TIME42 monthsTime to commission new energetic material production capacity
COMMERCIAL MARKET SHARE24%Category revenue from sporting and civilian ammunition sales
Why that capacity was allowed to shrink is a procurement question rather than an industrial one. For three decades governments bought ammunition annually, which meant a producer investing in a plant with a twenty year life was betting on orders nobody had promised beyond the current budget. Declining to invest was correct every year, and thirty correct annual decisions produced an industry that could not respond.
That has changed contractually rather than technically. Around 47% of procurement now sits under commitments extending beyond one budget year, which lets a producer finance a plant against something other than hope. European artillery output has risen roughly fourfold from where it started. The open question is whether those commitments survive, because a plant built on a five year contract is a liability in year six.
"Everybody wanted to know how fast the loading lines could run. Nobody asked where the propellant was coming from, and that turned out to be the only question that mattered."
Director, Defence Industrial Base Practice · MMA Defence and Industrial Manufacturing Practice · August 2026

Market Trends

Energetic Material Capacity Becomes The Whole Programme

Governments funding ammunition expansion discovered that the money had to go upstream into propellant, nitrocellulose and explosive fill capacity rather than into assembly, which is not where anybody expected it. Growth at 12.0% in large calibre follows plant commissioning schedules rather than order books. Roughly 42 months from decision to output means announcements made two years ago are producing now, and announcements made this year affect output nobody will see until well into the next decade. Nobody expected the money to go into chemical plants rather than into ammunition factories.
Market Impact: Lifts European output 4 times
Multi-Year Contracting Finally Justifies Capacity Investment

Around 47% of procurement now extends beyond a single budget year, which changes the arithmetic of building a plant with a twenty year life from irrational to sensible. That contractual shift did more for output than any industrial policy announcement managed. Producers still price in the risk that commitments lapse, because a facility financed against a five year contract becomes a stranded asset the moment the sixth year arrives without a renewal attached to it. Producers still price in the risk of lapse, which is why expansion has been more cautious than the headline commitments suggest.
Market Impact: Grows India fastest at 10.0%

Market Opportunities and Growth Drivers

Stockpile Replenishment Runs Years Behind Consumption

Inventories drawn down faster than they could be replaced leave replenishment targets that will take years to meet even with expanded capacity running continuously. European artillery output has risen roughly fourfold and remains below what the stated targets require. That gap is the demand driver, and it persists independently of any further escalation because the shortfall already exists on paper in every national inventory audit anybody has published. A stockpile has a target level, a shelf life and a consumption rate, and the gap between those three numbers is the whole demand model.
Market Impact: Runs plants at 96% utilisation

Asian Governments Choose Production Over Procurement

Importing ammunition is increasingly treated as a supply vulnerability rather than a purchasing decision, and governments across Asia are funding domestic production capability accordingly. India grows fastest of any country at 10.0% as private sector participation in ordnance manufacture expands beyond the state factories that held it exclusively for decades. Energetic material capability rather than assembly is again the harder part, and it is being built more slowly. Licensed production and offset arrangements are the usual route, since building capability from nothing takes considerably longer than anybody wants to wait.
Market Impact: Guarantees 5 years of 20

Market Restraints and Challenges

Nitrocellulose Supply Sits On A Narrow Base

Propellant depends on nitrocellulose, which depends in turn on cotton linters and specialised wood pulp from a small number of suppliers, and European producers found that base considerably narrower than anybody had assumed. Root cause is decades of consolidation in a low-growth input. Commercial impact is that expanding propellant output requires expanding a feedstock nobody was watching. Mitigation runs through long-term pulp contracts and additional nitration capacity, both now being funded. A nitration plant commissioned into a feedstock shortage produces exactly nothing useful at all for anybody either. Feedstock first.
Market Impact: Requires 42 months to commission

Commitments Lapse And Plants Do Not

A producer financing a facility against a five year contract holds an asset with a twenty year life and a five year revenue guarantee, which is why capacity expansion lagged demand by years rather than months. Root cause is a mismatch between political time horizons and industrial ones. Commercial impact is persistent under-investment relative to stated need. Mitigation involves government-funded capacity, offtake guarantees and shared facility ownership, all of which several countries have now adopted. Peace is commercially difficult in a way that nobody in this industry ever says aloud.
Market Impact: Commits 47% beyond one year
3 additional market trends, 2 additional growth drivers, and 4 additional restraints and challenges are covered in the full report. Contact sales@marketmindsadvisory.com to access the complete intelligence.

Segment CAGR and Growth Architecture

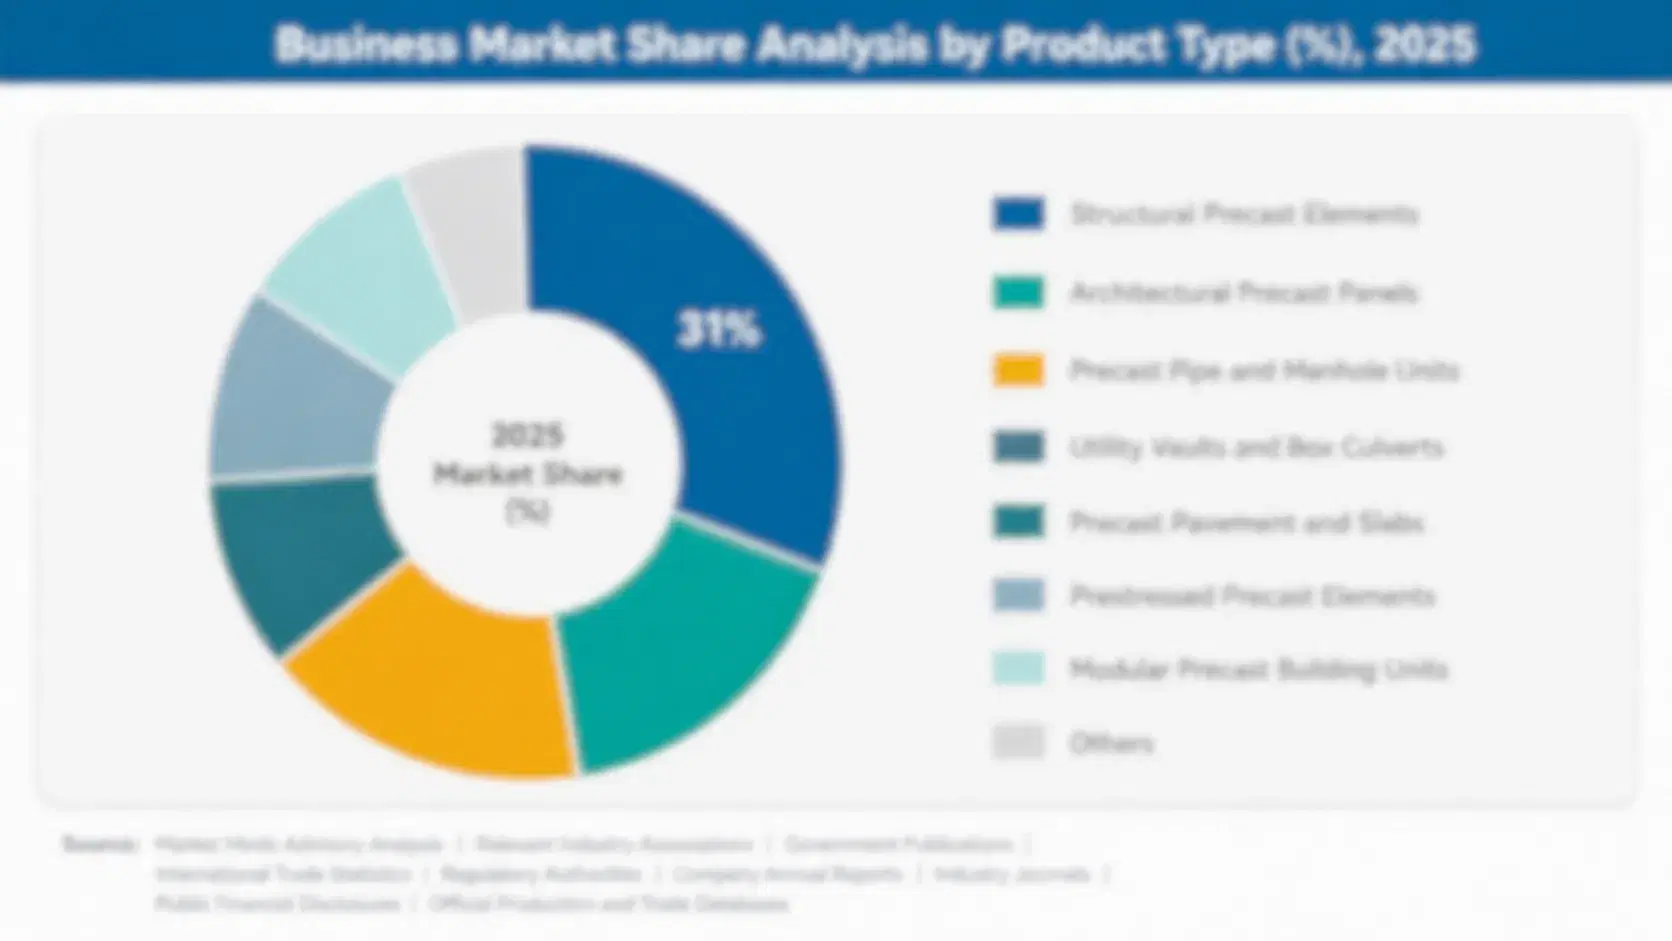
Segmentation follows ammunition class and calibre together with the energetic materials supplied as inputs, since those materials are the constraint on everything above them. Six categories cover the market without overlap. End user, procurement route and platform are treated as separate commercial dimensions throughout this report rather than as segmentation logic in their own right.
ammunition-market-trends-market-share-analysis-1787719715534

Large Calibre and Artillery Ammunition

Artillery and tank ammunition grows at 12.0%, half again the market rate of 8.0%, driven by stockpile replenishment against consumption rates that peacetime planning never contemplated and by capacity commissioning schedules rather than by order books. European output has risen roughly fourfold and still sits below stated replenishment targets. Energetic fill and propellant availability governs how fast this segment can actually grow, since a shell body is a forging and the difficult part is what goes inside it rather than the steel around it. Output is therefore governed by plant commissioning schedules set years earlier rather than by anything happening in the order book this quarter or the next one.
CAGR 12.0%

Mortar and Rocket Ammunition

Mortar bombs and unguided rocket ammunition grow at 9.6% on the same replenishment logic that drives artillery, with the added factor that these are the natures most readily supplied to partner forces and therefore consumed outside the purchasing country's own inventory. Production is less concentrated than large calibre, with capable manufacturers across Eastern Europe and Asia. Propellant and fill availability constrains output here exactly as it does everywhere else in the category, and for exactly the same reasons. Delivery timelines rather than unit pricing have decided most recent awards in this segment, which favours producers holding retained capability over those attempting to rebuild it from a standing start altogether. Schedule decides.
CAGR 9.6%
Full segment breakdown across 6 segments available in the complete report.

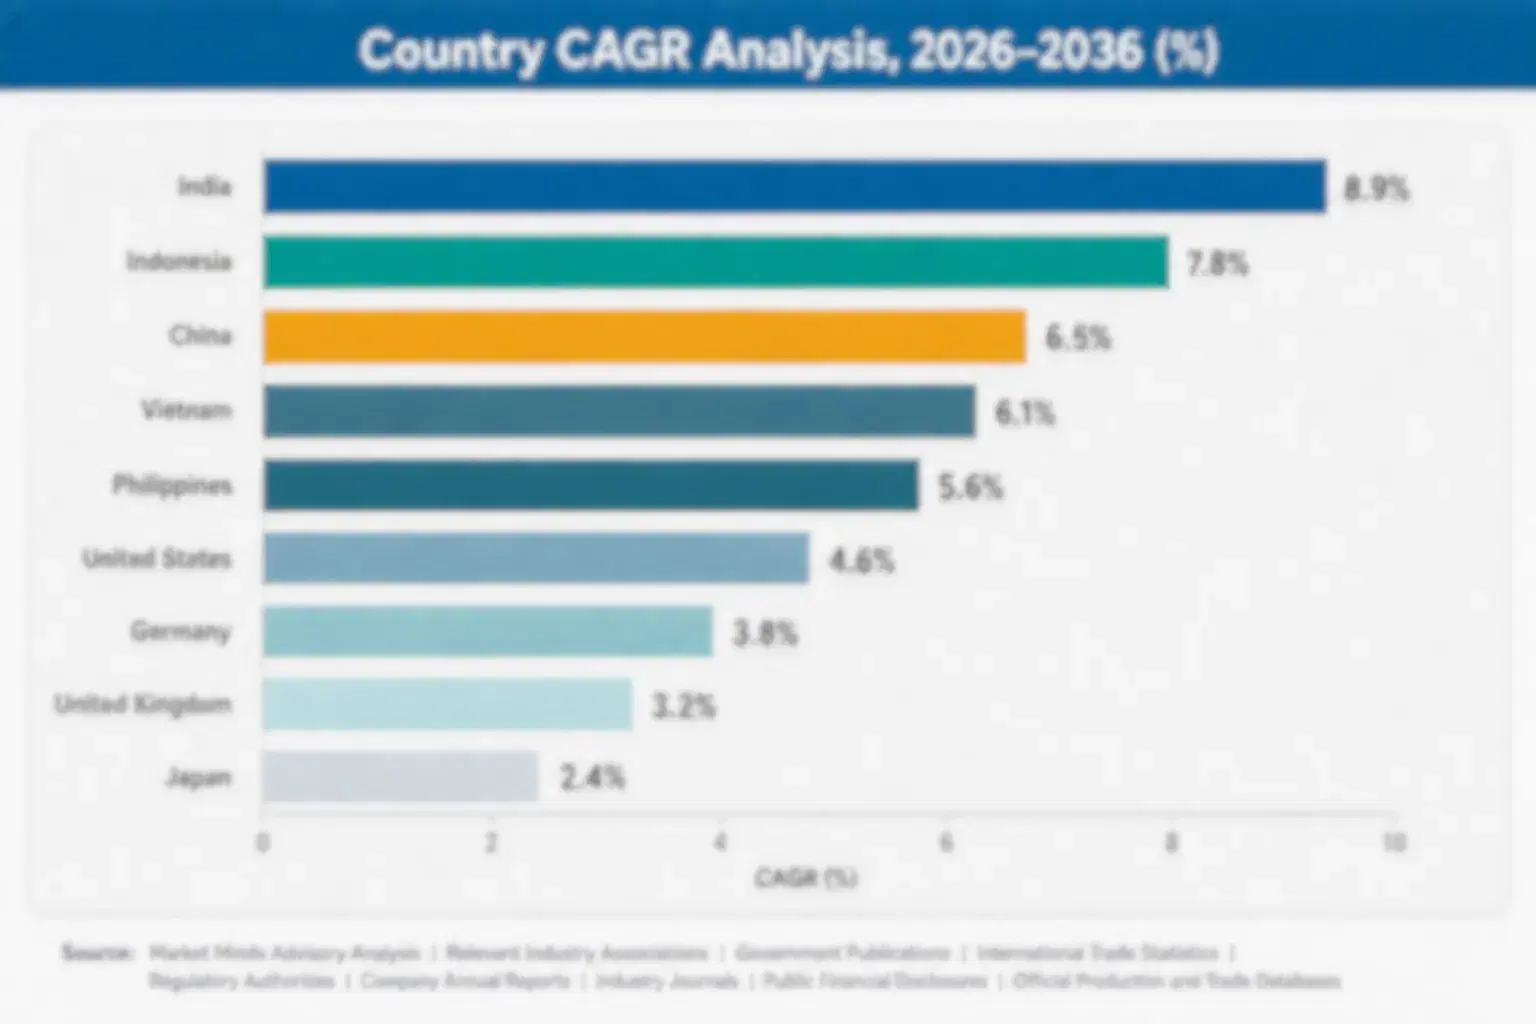
Regional Architecture and Country Demand Map

Geography follows defence procurement scale and domestic industrial capability rather than population. North America leads well beyond the usual band on procurement plus an unmatched civilian market, and India grows fastest. Population and economy size alone explain remarkably little about where this value actually sits.

North America

North America holds 36% against a normal band ceiling of 32%, a deliberate exception because United States defence procurement scale combines with by far the largest commercial and sporting ammunition market in the world, and no other region carries both. Government-owned contractor-operated plants form the backbone of large calibre production, with modernisation programmes funding energetic material capacity that had been deferred for decades. The commercial half runs on entirely separate economics, with retail inventory cycles that swing violently and recover slowly. Multi-year contracting has advanced furthest here, which is what has permitted the energetic material modernisation programmes that had been repeatedly deferred through three whole decades of annual budgeting cycles.
Share: 36% | CAGR: 7.2% (2026 to 2036)

Western Europe

European output has risen roughly fourfold since expansion began, which is the fastest growth anywhere in the near term even though the ten year regional rate sits below the global average once that surge is absorbed. Funding instruments supporting production capacity have channelled money upstream into propellant and nitrocellulose rather than assembly. National producers are consolidating and cross-border capacity sharing is being discussed seriously for the first time. Commercial and sporting demand is small and constrained by regulation. Nitrocellulose feedstock proved considerably scarcer than anybody had assumed when expansion began, and securing cotton linter and wood pulp supply became a funded programme in its own right across several countries entirely.
Share: 22% | CAGR: 6.4% (2026 to 2036)
Regional intelligence for 5 additional markets available in the complete report: East Asia, South Asia and Pacific, Latin America, Middle East and Africa, Eastern Europe. Contact sales@marketmindsadvisory.com.
ammunition-market-trends-country-cagr-analysis-1787719715841

Building Upstream, Not Downstream Capacity

Energetic plants run at 96% utilisation and take 42 months to replicate, roughly 47% of procurement is now multi-year, European output has risen fourfold and commercial ammunition is 24% of the category. Four levers work on upstream capacity, contract structure, feedstock security and commercial cycle management rather than on assembly capacity of any kind at all.

Invest Upstream Where The Constraint Actually Sits

Loading capacity can be added within months while energetic material plants take roughly 42 months and run near 96% utilisation, so investment placed downstream produces assembly capability with nothing to load into it. Governments funding expansion learned this expensively. Producers who committed to propellant and fill capacity ahead of the demand now hold the scarce asset, and the ones who added loading lines instead hold equipment waiting on somebody else's chemistry. Assembly equipment sitting idle waiting on somebody else's chemistry is not capacity in any useful sense at all whatsoever.
Market Impact: Addresses every plant now running at 96% utilisation

Negotiate Contract Terms That Outlive Political Urgency

A facility with a twenty year life financed against a five year commitment is a stranded asset in year six, which is precisely why capacity lagged demand for thirty years and will do so again. Offtake guarantees, government-funded capacity and shared ownership all move that risk somewhere it belongs. Producers accepting five year terms for twenty year assets are repeating the calculation that created the shortage, and knowing that changes nothing unless the terms change. A 20 year asset financed against 5 years of guaranteed revenue is a decision nobody should make twice.
Market Impact: Matches 20 year assets to proper contract terms

Secure Feedstock Before Expanding Nitration Capacity

Propellant depends on nitrocellulose, which depends on cotton linters and specialised wood pulp from a supply base decades of consolidation left considerably narrower than anybody had checked. Expanding nitration capacity without securing feedstock produces a plant that cannot run at rate. Long-term pulp contracts cost commitment against volumes that fluctuate with a programme nobody controls, and they are the difference between commissioned capacity and productive capacity. A nitration plant commissioned into a feedstock shortage runs at perhaps 40% of its rated output and nobody counts that as real capacity anywhere.
Market Impact: Feeds the plants already running at 96% utilisation

Manage The Commercial Cycle As A Separate Business

Commercial and sporting ammunition is 24% of the category, grows at less than half the overall rate and swings through demand spikes and gluts that bear no relation whatever to defence procurement rhythms. Running both from one inventory and one plan produces shortage in one half and write-downs in the other. Producers treating them as separate businesses with separate capacity planning outperform those managing a single order book across both consistently. Shortage in one half and write-downs in the other is a reliable outcome of running a single plan across both.
Market Impact: Separates a 24% commercial half from defence entirely

Who Controls the Margin Pool

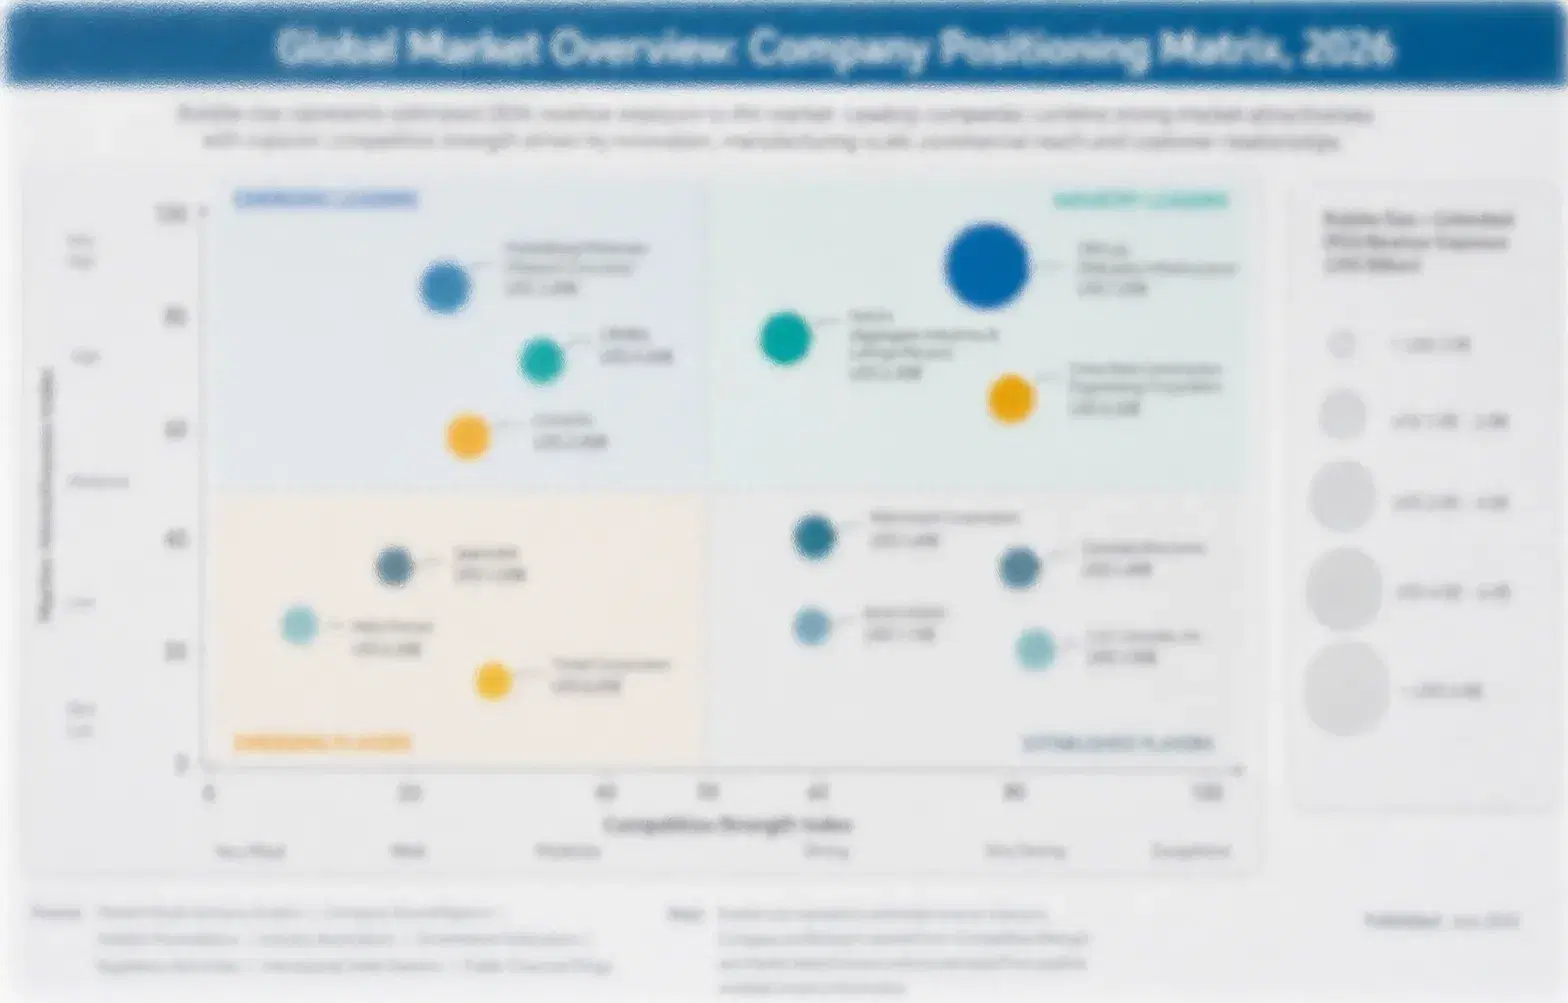
Measured on disclosed ammunition and energetic materials revenue, the five largest producers hold a CR5 of 41%, which understates concentration in specific natures because capability is distributed unevenly across calibres and across energetic materials. Olin Winchester and The Kinetic Group hold the largest commercial and small calibre positions, Rheinmetall and Nammo carry European large calibre and propellant capability, and Northrop Grumman operates substantial government-owned large calibre production under contract. No two of them compete on quite the same basis.
Three contests define activity. Large calibre supply competes on energetic material capacity and delivery certainty rather than on unit price. Small calibre competes on volume manufacturing efficiency. And commercial ammunition competes on retail brand and distribution in a market with entirely separate economics from everything else here. Propellant supply competes with almost nobody, because almost nobody makes it.

Pressure builds from South Korean and Eastern European producers supplying European replenishment on delivery timelines Western incumbents struggled to match. Rankings shift toward whoever secured upstream capacity early, since assembly capability without propellant is not capability at all. Delivery schedule has replaced unit price as the deciding term on most current awards.
ammunition-market-trends-company-positioning-matrix-1787719716120

Competitive Moat and Risk Dimensions

RHEINMETALL

Moat: Integrated Energetic Materials Capability

The group holds propellant, explosive fill and large calibre assembly capability together, which is precisely the combination that determined who could actually respond when demand arrived and who could only announce intentions. Vertical capability of that kind takes decades to assemble. A competitor with assembly capacity alone depends on somebody else's chemistry and cannot promise delivery alone.
RHEINMETALL

Risk: Capacity Built On Political Commitment

Expansion financed against multi-year commitments carries the risk those commitments are not renewed once urgency fades, leaving a twenty year asset with a five year revenue guarantee. That has happened before in this industry and shaped the previous thirty years. Peace is commercially difficult in a way nobody says aloud.
OLIN WINCHESTER

Moat: Commercial Scale And Government Operation

Operating both the largest commercial ammunition brand position and government-owned small calibre production gives the company volume manufacturing scale that spans two normally separate businesses and spreads fixed cost across both. Commercial brand equity in this market is decades old and remarkably durable. A new entrant faces both a manufacturing scale gap and a retail shelf position built over generations.
OLIN WINCHESTER

Risk: Commercial Demand Swings Violently

The commercial half moves through spikes and gluts driven by civilian sentiment rather than by any planning cycle, producing shortage and then write-downs within the same three year period. Managing that alongside defence production requires separate planning that integrated operations make awkward. Regulatory pressure on lead content adds a further complication in several markets.

Players Tracked

Prominent Players

Olin Winchester
Rheinmetall
Northrop Grumman
Nammo
The Kinetic Group

Other Key Players

General Dynamics Ordnance and Tactical Systems
BAE Systems
Thales
Hanwha Aerospace
Poongsan
Czechoslovak Group
Fiocchi Munizioni
Beretta Holding
Elbit Systems
KNDS
PGZ
Arsenal JSCo
Denel
MKEK
Prvi Partizan

Recent Developments

JANUARY 2025

European funding instrument directs capacity money upstream to propellant

A European production support instrument directed a substantial share of its funding toward propellant and nitrocellulose capacity rather than assembly lines. This was a public funding allocation rather than any commercial transaction, and it followed assessments showing that energetic materials rather than loading capability limited output.
Signal: Public funding finally reached the one part of the chain that had actually been constraining output.
MAY 2025

Producer commissions new propellant facility after multi-year build

An ammunition producer commissioned a new propellant production facility following a construction and qualification programme lasting more than three years. This was an organic capacity expansion rather than any acquisition, and the decision to build had been taken only once multi-year offtake commitments were in place.
Signal: Capacity arriving now reflects contracting decisions taken several years before anybody sees any output at all.
SEPTEMBER 2025

Asian producer wins European replenishment supply on delivery timeline

An Asian ammunition producer secured a European replenishment supply contract, competing principally on delivery schedule rather than on unit price. This was a competitive procurement award rather than any partnership arrangement, and Western producers had quoted considerably longer lead times for broadly comparable quantities and natures.
Signal: Delivery certainty rather than unit price is deciding awards while capacity everywhere remains genuinely tight indeed.

Nitrocellulose, Brass And Steel

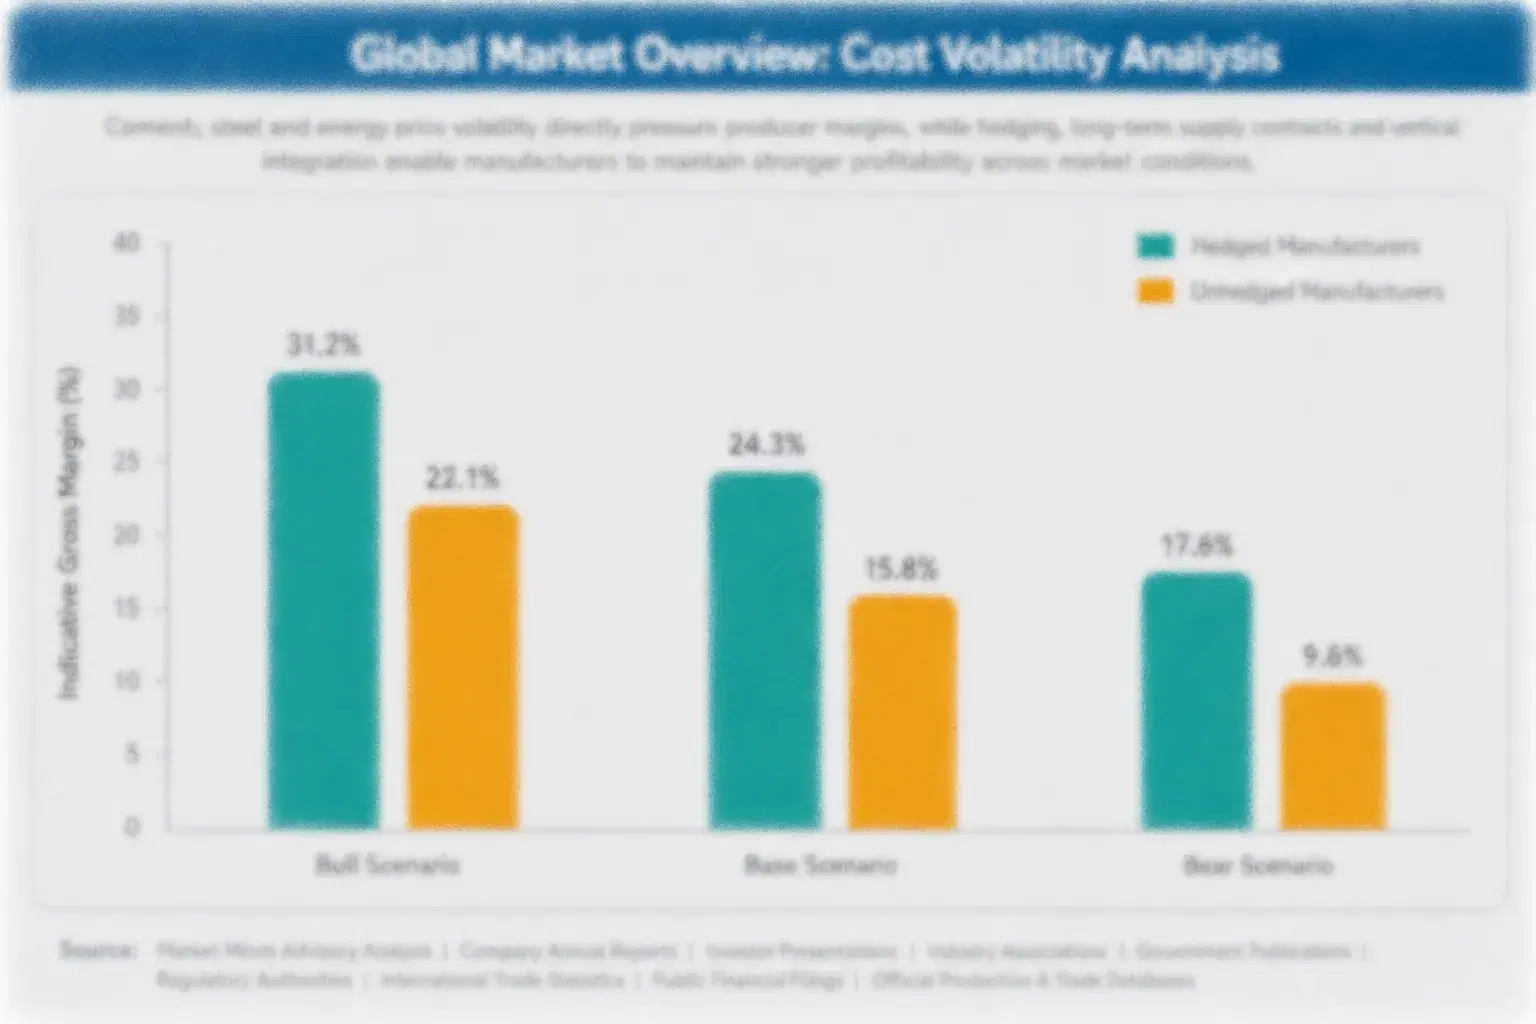
Inputs divide between chemistry and metal and the chemistry is the awkward half. Nitrocellulose derived from cotton linters and specialised wood pulp, nitric and sulphuric acid, brass strip and cup for cases, lead and steel for projectiles, and steel forgings for large calibre bodies together account for 38 to 49% of finished cost. Nitrocellulose feedstock comes from a supply base narrowed by decades of consolidation.
Two things moved together. Copper and zinc pricing rose sharply through 2021 and 2022, feeding directly into brass case cost, which United States Geological Survey commodity data records across the period. European energy pricing then rose severely through 2022, which IEA data documents, and acid production and nitration are both energy-intensive operations that European producers could not relocate while expanding output at the same time.

Exposure divides by vertical integration rather than by scale. Producers holding their own nitrocellulose and propellant capacity control the constrained input and its cost; those buying propellant carry both price and availability exposure to competitors. Commercial producers face brass and lead exposure without the contract structures defence supply provides. Eastern European producers with retained energetic material capability hold an input position that Western competitors are spending years attempting to rebuild.
ammunition-market-trends-cost-volatility-analysis-1787719716442

Contract cotton linter and wood pulp supply long term

Nitrocellulose feedstock comes from a supply base that decades of consolidation left considerably narrower than anybody checked before demand returned. Long-term contracting costs commitment against programme volumes that governments adjust with little notice. It is the difference between a nitration plant running at rate and one commissioned into a feedstock shortage, which several operators have now encountered directly.

Hold nitrocellulose and propellant capacity internally

Producers buying propellant from competitors carry both cost and availability exposure at the exact point where the industry is constrained, and allocation follows ownership when capacity is short everywhere. Internal capability costs capital, permitting time measured in years and considerable regulatory effort. It converts the scarcest input in the industry from a purchase into an asset the producer actually controls.

Hedge copper and zinc across commercial case production

Brass cases carry copper and zinc exposure that moved sharply and that commercial producers absorb without the contractual price adjustment defence supply routinely provides for them. Hedging costs treasury capability and margin during stable periods. It protects the half of the business that faces retail pricing pressure and cannot pass input movements through to a consumer at short notice.

Portfolio Architecture for Margin Defence

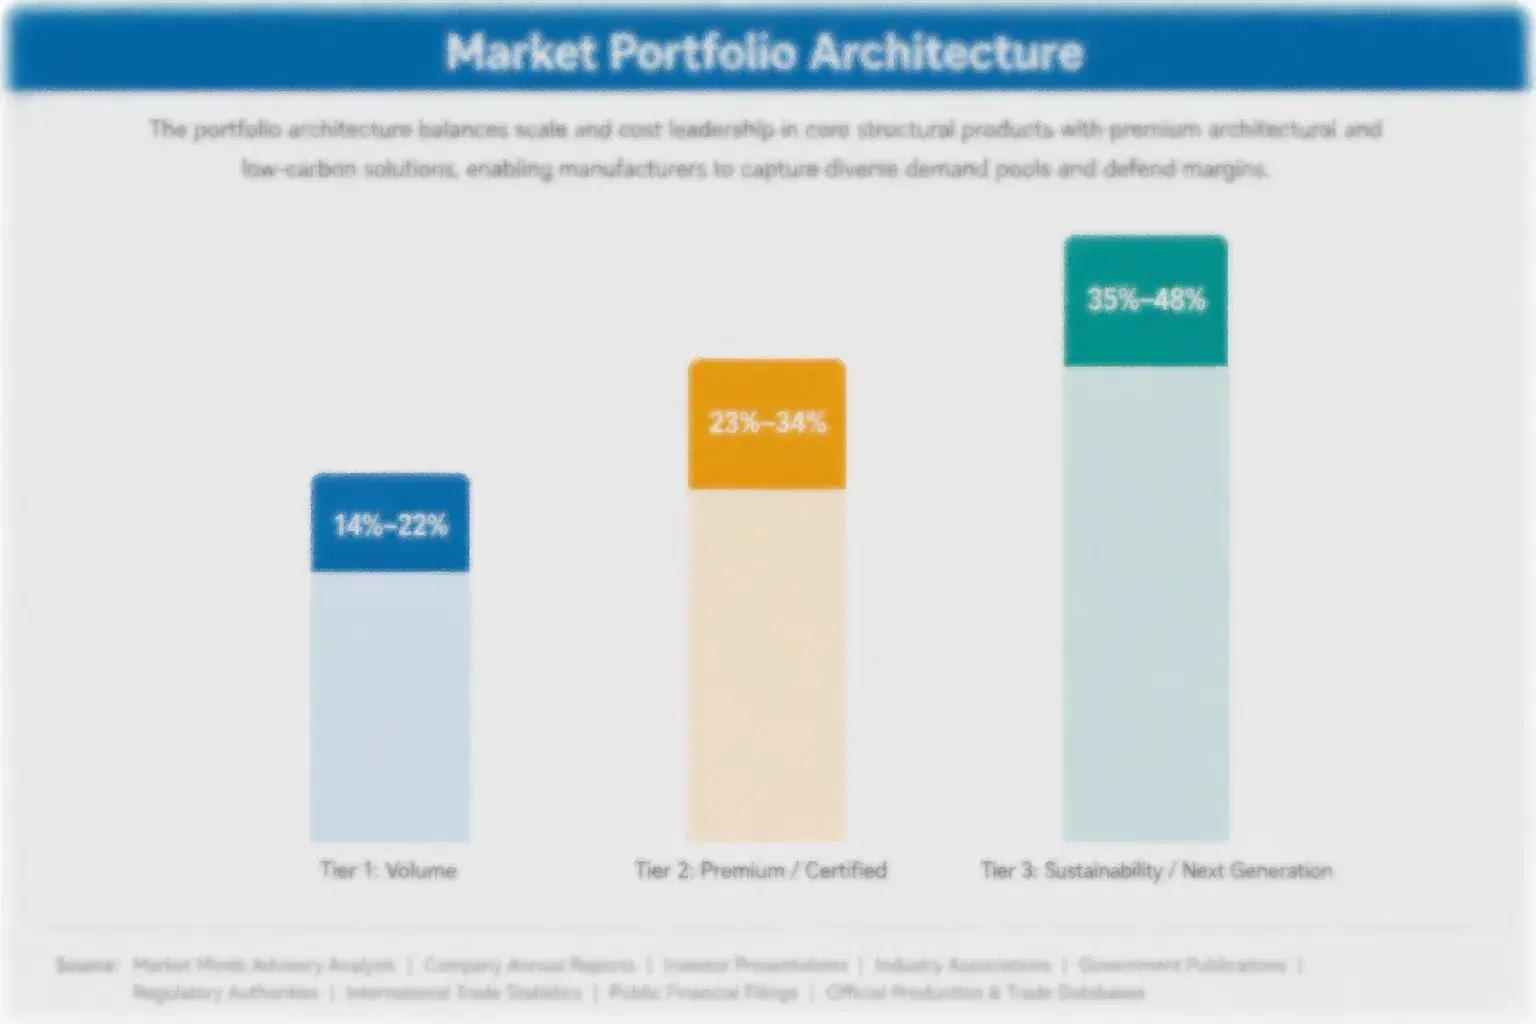
Margin follows scarcity of capability rather than volume, which inverts what the tonnage suggests. Commercial sporting ammunition earns modestly against retail price competition and violent demand cycles. Small calibre defence supply earns thinly on competitive volume tendering. Medium calibre earns reasonably. Mortar and rocket natures earn better. Large calibre artillery earns well on delivery scarcity. Propellants and energetic materials earn best of anything, because everybody else needs them and very few can make them.
The tension is that the scarce capability requires the longest commitment. Energetic material capacity takes roughly 42 months to commission, needs permits that take years and depends on contracts that political cycles do not respect. A producer weighted to assembly earns thinner margin with far shorter payback; one weighted upstream holds the industry's scarcest asset and the industry's least forgiving investment horizon at the same time.

High-value pools sit in three places. Propellant and energetic material capacity, which constrains everybody and which very few can build. Large calibre supply under multi-year commitment, where delivery certainty rather than price decides awards. And retained Eastern European energetic capability, which was maintained through decades when Western equivalents were closed and is now considerably more valuable than anybody expected.

Volume / Commodity-Adjacent

Small calibre defence supply and commercial sporting ammunition competing on volume tendering and retail price. The 10-point range separates producers with integrated case and projectile manufacture from those assembling purchased components at market prices.
Gross Margin: 12-22%

Premium / Certified

Medium calibre, mortar and rocket natures supplied under qualified production approvals to defence customers. The 14-point spread reflects how differently competitively tendered supply and sole-source qualified production are priced across otherwise comparable natures.
Gross Margin: 24-38%

Sustainability / Regulatory / Next-Generation

Large calibre artillery under multi-year commitment together with propellant and energetic material supply to the wider industry. The 22-point range is wide because delivery-scarce finished ammunition and constrained upstream chemistry earn on entirely different bases.
Gross Margin: 36-58%
ammunition-market-trends-portfolio-architecture-1787719716776

High-value Sub-segments and Strategic Watch-out

Propellant And Energetic Materials

Highest margin in the category because plants run near 96% utilisation, take 42 months to replicate and everybody downstream depends on them completely. The risk is a 20 year asset financed against commitments that political cycles have historically failed to renew. History is not encouraging here.
Gross Margin: 44-58%

Large Calibre Under Commitment

Strong economics while delivery certainty rather than unit price decides awards and European output remains below stated replenishment targets. The risk is that targets get quietly relaxed once immediate pressure eases, which has happened after every previous surge. Targets have a way of relaxing quietly.
Gross Margin: 36-48%

Small Calibre Defence Volume

The volume core, supplied under competitive tendering where manufacturing efficiency rather than capability decides who wins the work. Producers hold it because it keeps plants loaded between large calibre programmes and preserves qualified production status. Qualified production status is worth holding for that reason alone.
Gross Margin: 14-24%

Commercial Cycle Exposure

The strategic watch-out. Commercial ammunition is 24% of the category and swings through spikes and gluts driven by civilian sentiment rather than planning. The risk is shortage and write-downs arriving within the same three year period repeatedly. Civilian sentiment is not really a planning input.
Gross Margin: 12-22%

Consumed, Then Replaced

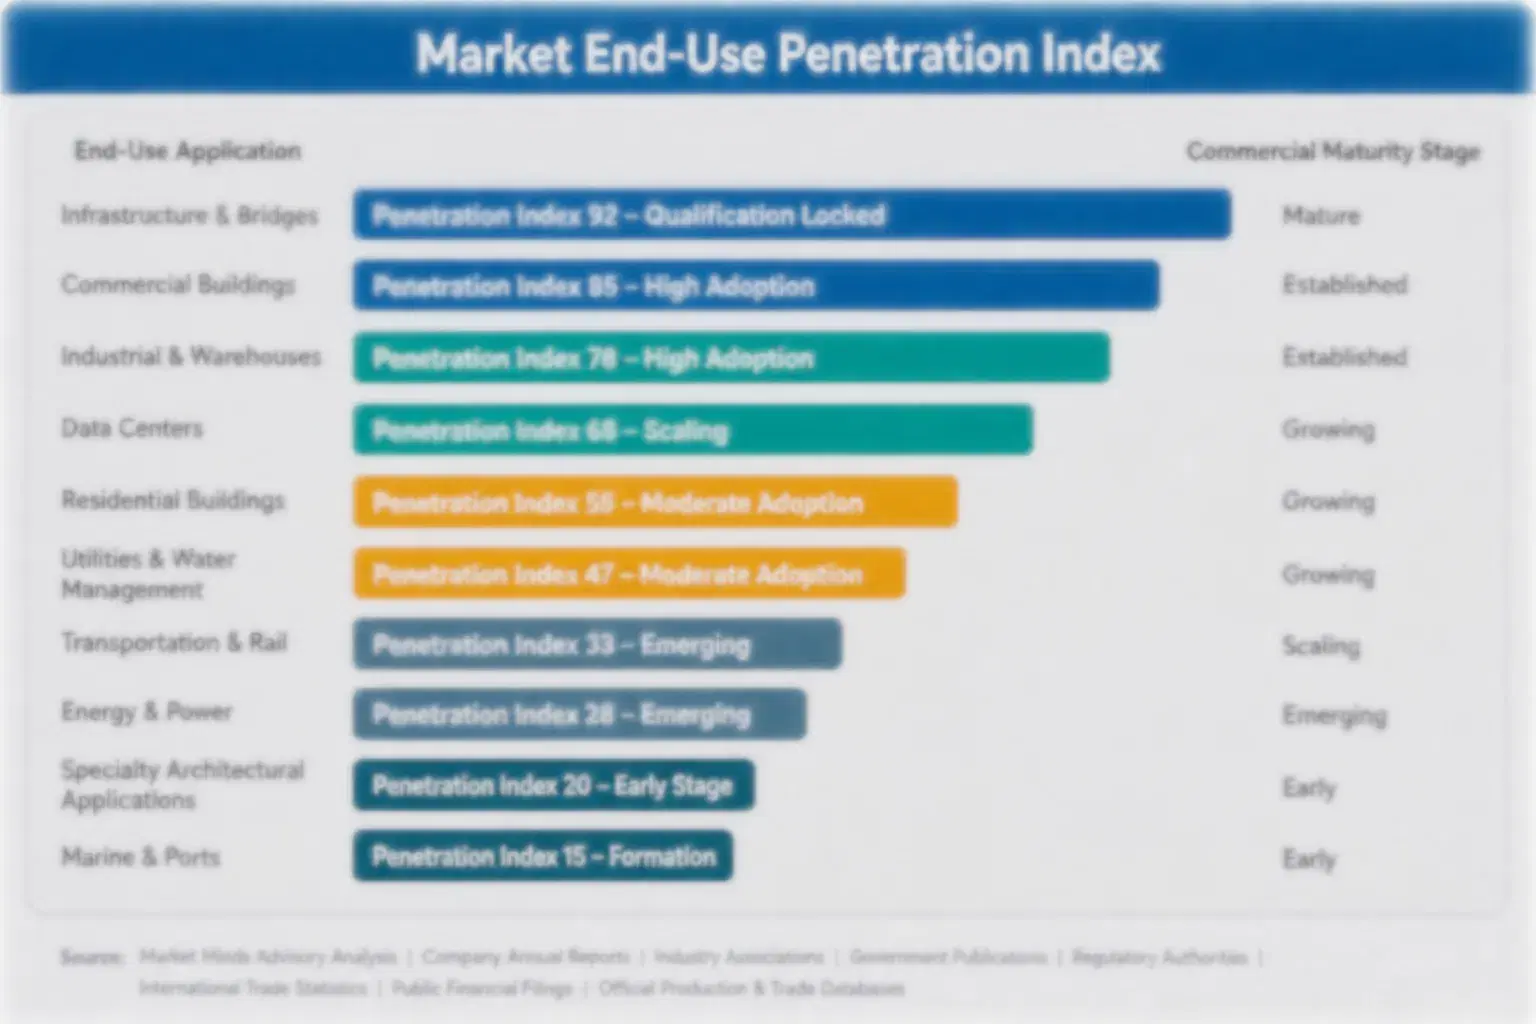
Ammunition is the rare defence category that is genuinely consumed rather than maintained, which makes demand a function of usage and inventory policy rather than of platform fleets. A stockpile has a target level, a shelf life and a consumption rate, and the gap between those three numbers is the entire demand model. That produces predictable requirement in peacetime and violent requirement when consumption exceeds anything planning contemplated.
Stickiness comes from qualification rather than from preference. A nature qualified against a national specification, produced on approved tooling and accepted through a documented lot acceptance process is not casually resourced, because requalifying a supplier takes years and involves testing nobody wants to repeat. Large calibre relationships are the stickiest of all. Commercial ammunition is the opposite entirely, with retail buyers switching brands on availability alone.

The buyer has extended its planning horizon and may not keep it extended. Annual procurement made capacity investment irrational for thirty years, and multi-year commitments covering roughly 47% of purchasing have finally changed that. Whether that horizon survives the next budget cycle is the most important commercial question here, and every producer building capacity today is betting on an answer nobody can give.
ammunition-market-trends-end-use-penetration-index-1787719717064

Upstream Or Nowhere

These are among the four positions where our research anticipates prominent divergence between winners and laggards over the coming forecast period. Each is grounded in the demand model, the regulatory perimeter, and the announced capacity pipeline.
01 / UPSTREAM CAPACITY PRIORITY

Loading lines were never the problem

Assembly capacity can be added within a matter of months while energetic material plants take roughly 42 months to commission and Western facilities have been running near 96% utilisation right throughout. Investment placed downstream therefore produces assembly capability with nothing at all available to load into it, which several governments went and discovered rather expensively. Producers who committed to propellant and explosive fill capacity ahead of the demand now hold the genuinely scarce asset in this entire industry at all today.
02 / CONTRACT HORIZON MATCHING

Twenty year assets need twenty year terms

A facility with a twenty year working life financed against a five year commitment becomes a stranded asset in year six, which is precisely the calculation that suppressed capacity investment for three whole decades and produced the shortage that everybody was so surprised by. Offtake guarantees, government-funded capacity and shared ownership each move that risk to where it properly belongs. Accepting five year terms for twenty year assets simply repeats the original mistake all over again right from the start.
03 / FEEDSTOCK SECURITY DISCIPLINE

A nitration plant needs something to nitrate

Propellant production depends entirely on nitrocellulose, which depends on cotton linters and specialised wood pulp drawn from a supply base that decades of consolidation had left far narrower than anybody had ever bothered to check. Expanding nitration capacity without first securing feedstock produces a commissioned plant that cannot actually run anywhere near its rated output. Long-term pulp contracting is the difference between capacity on paper and capacity actually producing something, which several operators have now discovered for themselves quite directly.
04 / COMMERCIAL CYCLE SEPARATION

Two businesses, one order book, constant trouble

Commercial and sporting ammunition is fully 24% of the whole category, grows at under half the overall category rate and swings through demand spikes and gluts driven by civilian sentiment bearing no relation at all to any defence procurement rhythms. Running both halves from a single inventory and a single production plan reliably produces shortage in one and write-downs in the other. Producers who treat them as genuinely separate businesses with separate capacity planning consistently outperform those who never do.

Engagement Snapshot From the Field

A live engagement with an industry participant carrying material or product regulatory and market exposure ahead of a defining policy shift, showing how our research translates into a defensible multi-year portfolio strategy.
MARKET MINDS ADVISORY · CLIENT ENGAGEMENT SUMMARY
Ammunition 2025-2035 Producer Strategic Portfolio Review and Transition Roadmap 2026·Investment Scenario on Ammunition 2025-2035 Exposure Evaluation 2025-26
CLIENT PROFILE
An ammunition producer supplying small and medium calibre natures across European and Asian markets, with reported ammunition revenue of 410 million dollars (client-reported, unverified by MMA). Roughly 64% came from small calibre defence supply. All propellant was purchased from external suppliers and no energetic material capability existed anywhere within the business at that particular point.
STRATEGIC CHALLENGE
Order intake had risen sharply while deliveries slipped, because propellant allocation from external suppliers had been cut as those suppliers prioritised their own downstream production. Management was preparing to expand loading capacity. That would have added assembly capability the company already had in surplus while leaving the constraint that was actually delaying every delivery entirely untouched.
MMA APPROACH
MMA analysed delivery performance against propellant allocation by supplier and by nature, a reconciliation the company had never assembled despite holding all the data. Twenty-three expert interviews with procurement officials, propellant producers, government capacity programme managers and competitor executives established where the constraint genuinely sat. The analysis treated upstream capability and contract structure rather than assembly capacity as the routes available.
KEY FINDINGS
  1. Every delayed delivery in the preceding two years traced to propellant allocation rather than to loading capacity, which had never once been the limiting factor at all.
  2. External propellant suppliers were prioritising their own vertically integrated downstream production, which meant allocation would tighten further as their own order books grew.
  3. Government capacity funding programmes were open to applications from producers building energetic material capability, and the company had never approached any of them.
  4. Competitors holding integrated propellant capability were quoting delivery timelines the company could not match at any price, and winning awards on that basis alone.
CLIENT PROFILE
An ammunition producer supplying small and medium calibre natures across European and Asian markets, with reported ammunition revenue of 410 million dollars (client-reported, unverified by MMA). Roughly 64% came from small calibre defence supply. All propellant was purchased from external suppliers and no energetic material capability existed anywhere within the business at that particular point.
STRATEGIC CHALLENGE
Order intake had risen sharply while deliveries slipped, because propellant allocation from external suppliers had been cut as those suppliers prioritised their own downstream production. Management was preparing to expand loading capacity. That would have added assembly capability the company already had in surplus while leaving the constraint that was actually delaying every delivery entirely untouched.
MMA APPROACH
MMA analysed delivery performance against propellant allocation by supplier and by nature, a reconciliation the company had never assembled despite holding all the data. Twenty-three expert interviews with procurement officials, propellant producers, government capacity programme managers and competitor executives established where the constraint genuinely sat. The analysis treated upstream capability and contract structure rather than assembly capacity as the routes available.
KEY FINDINGS
  1. Every delayed delivery in the preceding two years traced to propellant allocation rather than to loading capacity, which had never once been the limiting factor at all.
  2. External propellant suppliers were prioritising their own vertically integrated downstream production, which meant allocation would tighten further as their own order books grew.
  3. Government capacity funding programmes were open to applications from producers building energetic material capability, and the company had never approached any of them.
  4. Competitors holding integrated propellant capability were quoting delivery timelines the company could not match at any price, and winning awards on that basis alone.
RECOMMENDED STRATEGY
Phase 1: Phase one: apply to government capacity funding programmes for energetic material capability, since the constraint sits upstream and the money is available. Phase 2: Phase two: negotiate offtake terms matching asset life rather than budget cycles before committing any capital at all to a plant. Phase 3: Phase three: halt loading capacity expansion, which adds assembly capability the company already holds in very considerable surplus everywhere it operates.
OUTCOME
A capacity funding application was submitted and progressed to assessment within two quarters. Offtake negotiations opened on terms extending beyond the customary commitment period (client-reported, unverified by MMA). Loading expansion was halted and the capital redirected. Delivery performance did not improve during the period, which the analysis had predicted, since upstream capacity takes years rather than quarters to arrive.

Frequently Asked Questions

Foundational context covering the market sizes, CAGR, scope, country, region and competition that inform every finding below. This section is provided to cover basics and most often pre-purchase conversations, answered from the MMA Primary Research Dataset.

What is the current size of the Ammunition Market?

The market was worth 28.0 billion dollars in 2025, covering small, medium, large calibre, mortar and rocket, commercial and energetic material segments. It reaches 30.2 billion dollars in 2026.

How large will the Ammunition Market be by 2036?

MMA forecasts 65.2 billion dollars by 2036, an increase of 35.0 billion dollars over the 2026 base. That represents an expansion multiple of 2.16 times across the forecast period.

What is the CAGR for the Ammunition Market 2026 to 2036?

The base case compounds at 8.0% annually. The bull case reaches 9.2% if replenishment targets are held to, while the bear case sits at 6.8% on procurement reverting to annual budgeting.

Which segment is growing fastest?

Large calibre and artillery ammunition, at 12.0%, half again the market rate of 8.0%. Stockpile replenishment against unplanned consumption rates drives it, constrained by energetic material capacity.

Who are the major companies in the Ammunition Market?

Olin Winchester, Rheinmetall, Northrop Grumman, Nammo and The Kinetic Group lead on disclosed ammunition and energetic materials revenue. Hanwha, Poongsan and Czechoslovak Group hold notable positions.

Which country is growing fastest?

India at 10.0%, as private sector participation in ordnance manufacture expands beyond the state factories. Energetic material capability there is being built more slowly than assembly.

Report Segmentation Architecture

The full report scope spans multiple orthogonal segmentation dimensions, with cross-tabulated demand data provided for each dimension pair. Coverage extends further to regional breakdowns, trend trajectories, and the competitive detail needed to support segment-level decision-making.

By Ammunition Class

  • Small Calibre Ammunition
  • Medium Calibre Ammunition
  • Large Calibre and Artillery Ammunition
  • Mortar and Rocket Ammunition
  • Commercial and Sporting Ammunition
  • Propellants Primers and Energetic Materials

By End-Use Industry

  • Land Forces Procurement
  • Naval and Air Force Procurement
  • Law Enforcement and Security Services
  • Civilian Sporting and Hunting
  • Export and Partner Nation Supply
  • Training and Range Consumption

By Commercial Dimension

  • Multi-Year Framework Procurement
  • Annual Budget Cycle Purchase
  • Government-Owned Contractor-Operated Supply
  • Licensed and Offset Production
  • Commercial Retail Distribution
  • Energetic Material Merchant Supply

By Region

  • North America
  • Western Europe
  • East Asia
  • South Asia and Pacific
  • Latin America
  • Middle East and Africa
  • Eastern Europe

Scope, Methodology, and Coverage

Every figure in this report is reproducible from documented input assumptions. The scope below maps the historical period, the forecast horizon, the segmentation dimensions, and the countries covered, alongside the underlying primary and qualitative methodology.
Historical Period
2020 to 2025
Forecast Period
2026 to 2036
Base Year
2025 (USD billions; MMA Primary Research Dataset, August 2026)
Market Definition
Scope covers manufactured conventional ammunition together with the energetic materials supplied as inputs to its production, spanning small calibre ammunition, medium calibre ammunition, large calibre and artillery ammunition, mortar and unguided rocket ammunition, commercial and sporting ammunition, and propellants primers and energetic materials sold into the wider industry. Guided missiles, precision guidance kits and strike weapons, launch platforms weapon systems and fire control, ordnance disposal demilitarisation and stockpile destruction services, non-lethal and less-lethal munitions, and civilian pyrotechnics and display fireworks are excluded from the market size and all derived figures. The forecast follows the standard MMA horizon of 2026 to 2036 rather than any date range appearing in the market title.
Quantitative Units
USD billions (current prices); rounds produced; plant capacity utilisation; contract commitment duration in years; commissioning lead time in months
Segmentation Dimensions
By Ammunition Class; By End-Use Industry; By Commercial Dimension; By Region
Regions Covered
North America, Western Europe, East Asia, South Asia and Pacific, Latin America, Middle East and Africa, Eastern Europe
Countries Covered
USA, Germany, South Korea, China, India, Poland, France, Czechia, Norway, Turkey, Japan, Brazil, Serbia, UK, Bulgaria
Key Companies Profiled
Olin Winchester, Rheinmetall, Northrop Grumman, Nammo, The Kinetic Group, General Dynamics Ordnance and Tactical Systems, BAE Systems, Thales, Hanwha Aerospace, Poongsan, Czechoslovak Group, Fiocchi Munizioni, Beretta Holding, Elbit Systems, KNDS, PGZ, Arsenal JSCo, Denel, MKEK, Prvi Partizan
Quantitative Methodology
Primary survey, n=3,800 respondents, Q4 2025, six countries; demand-side model with trade association cross-validation
Qualitative Methodology
47 expert interviews, Q4 2025; applied to validate demand model assumptions, identify emerging dynamics, and assess competitive positioning
Report Format
PDF and XLSX data workbook (Word format preview document)
Publisher
Market Minds Advisory
Report Code
MMA-2026-CON-141
Published
August 2026
Contact
sales@marketmindsadvisory.com | www.marketmindsadvisory.com

Purchase the full Ammunition Market 2025-2035 Report (2026 to 2036).

The full report runs to 185 pages and covers all six ammunition class segments, seven regions and 20 profiled producers in detail. It includes the complete segment CAGR set, regional procurement scale and industrial capability comparison, and capacity analysis separating assembly capability from energetic material production. Company profiles carry evaluation on disclosed ammunition and energetic materials revenue, with moat and risk assessment for the top five producers. The competitive section extends to 16 tracked funding, capacity and procurement developments across 2024 and 2025. Primary research inputs include a quantitative survey of 3,800 respondents and 47 expert interviews conducted in Q4 2025.
Six ammunition class segments with individual CAGR forecasts
Seven regional markets with procurement and industrial capability comparison
Twenty producer profiles on consistent revenue evaluation basis
Sixteen tracked funding and procurement developments with commercial interpretation
Capacity separated between assembly and energetic material production
Contract horizon assessed against facility asset life requirements

Built For The People Who Decide

From boardroom strategy to bench-side execution, this report is read cover-to-cover by leaders shaping the next decade of their industry, turning demand scenarios, market dynamics and valuation benchmarks into decisions.
CXOs/ Presidents/ VPs/ Managers
M&A and Corporate Development
Strategy Teams and R&D Heads
Procurement and Product Directors
Regulatory and Compliance Leaders
Investor Relations and Equity Analysts